

#tslab
tslab
38,553 Aufrufe
798 Kommentare
Hot
Zuletzt




Übersetzung ansehen
特斯拉现在有一批人,每天戴着摄像头擦桌子、拿杯子、叠衣服,一遍遍重复。攒下来的动作数据已经超过 50 万小时,内部目标是年底翻倍,部分环节已经在 24 小时三班倒地采集。
听着像科幻片花絮,但放进 TSLAB 的定价链条里,它的位置很明确:这是量产前必须先付掉的一笔成本,不是收入。
🔍 数据时长要算投入,不是进度条
市场很容易把“50 万小时”当成 Optimus 的进度百分比。但数据采集和交付台数之间,隔着一整个工程化阶段:模型能不能收敛、硬件 BOM 降不降得下来、产线良率撑不撑得住,每一步都可能把时间表往后推。数据量翻倍只能证明预算还在批、人还在招,证明不了明年能交多少台。TSLAB 锚的是可交付台数乘单台毛利,采集时长进不了这个公式的分子——它只会出现在分母的成本侧。
⚙️ 三班倒既是正信号,也是反信号
正向看,愿意 24 小时三班倒地消耗人力,说明内部优先级很高,不是 PPT 项目。反向看,如果数据已经够用,就该转去测试和量产爬坡,而不是继续加人叠衣服。所以“还在三班倒”本身就说明采集阶段没结束。这个信号几乎免费,可以当前瞻指标跟着看:哪天招工口径从“数据采集员”变成“产线操作员”,那才是从成本端切向收入端的节点。
📉 叙事脉冲和持仓结构的错位
这类具身智能数据新闻在离岸时段发出来,最容易走成脉冲式的行情——在那个时间点,TSLAB 是少数能立刻交易的 Tesla 机器人叙事载体,反应自然快。但判断它是真买盘还是杠杆追新闻,有个简单的分辨法:看资金费率和持仓量是否同向。费率短时抬升、持仓量没跟上,说明是短线杠杆在赌情绪,新闻热度一过就撤,对应几个小时的行情;费率和持仓同步走高,才说明有人愿意用仓位承担时间成本,对应几周的行情。新闻本身不改变任何一个交付假设,能改变的只有愿意为这个假设付多久的钱。
💸 还有一笔容易被忽略的会计位置
雇人戴摄像头采集动作数据,人力成本在会计上落在研发费用里,是纯支出,不会出现在任何交付口径中。也就是说,在 Optimus 产生第一笔规模收入之前,这类投入只会让研发费用这一项继续抬高。对 TSLAB 这种拿不到现金流索取权的载体来说,能被验证的只有一件事:这些费用最终换不换得来可交付的台数。换不来是沉没成本,换来了才是护城河。
我的判断:这次的动作数据新闻,真正有价值的地方,是给了一个可证伪的时间表指标,而不是一个新的上涨理由。该盯的是年底那个翻倍目标有没有兑现,以及兑现之后招工需求是否转向产线——这两件事比任何一条花絮都更接近 TSLAB 的定价核心。
仓位盈亏自己扛,别把“数据翻倍”直接读成“交付翻倍”。
#TSLAB #马斯克 #Crypto
5


Übersetzung ansehen
$TSLAB: Moving Beyond Volume Spikes
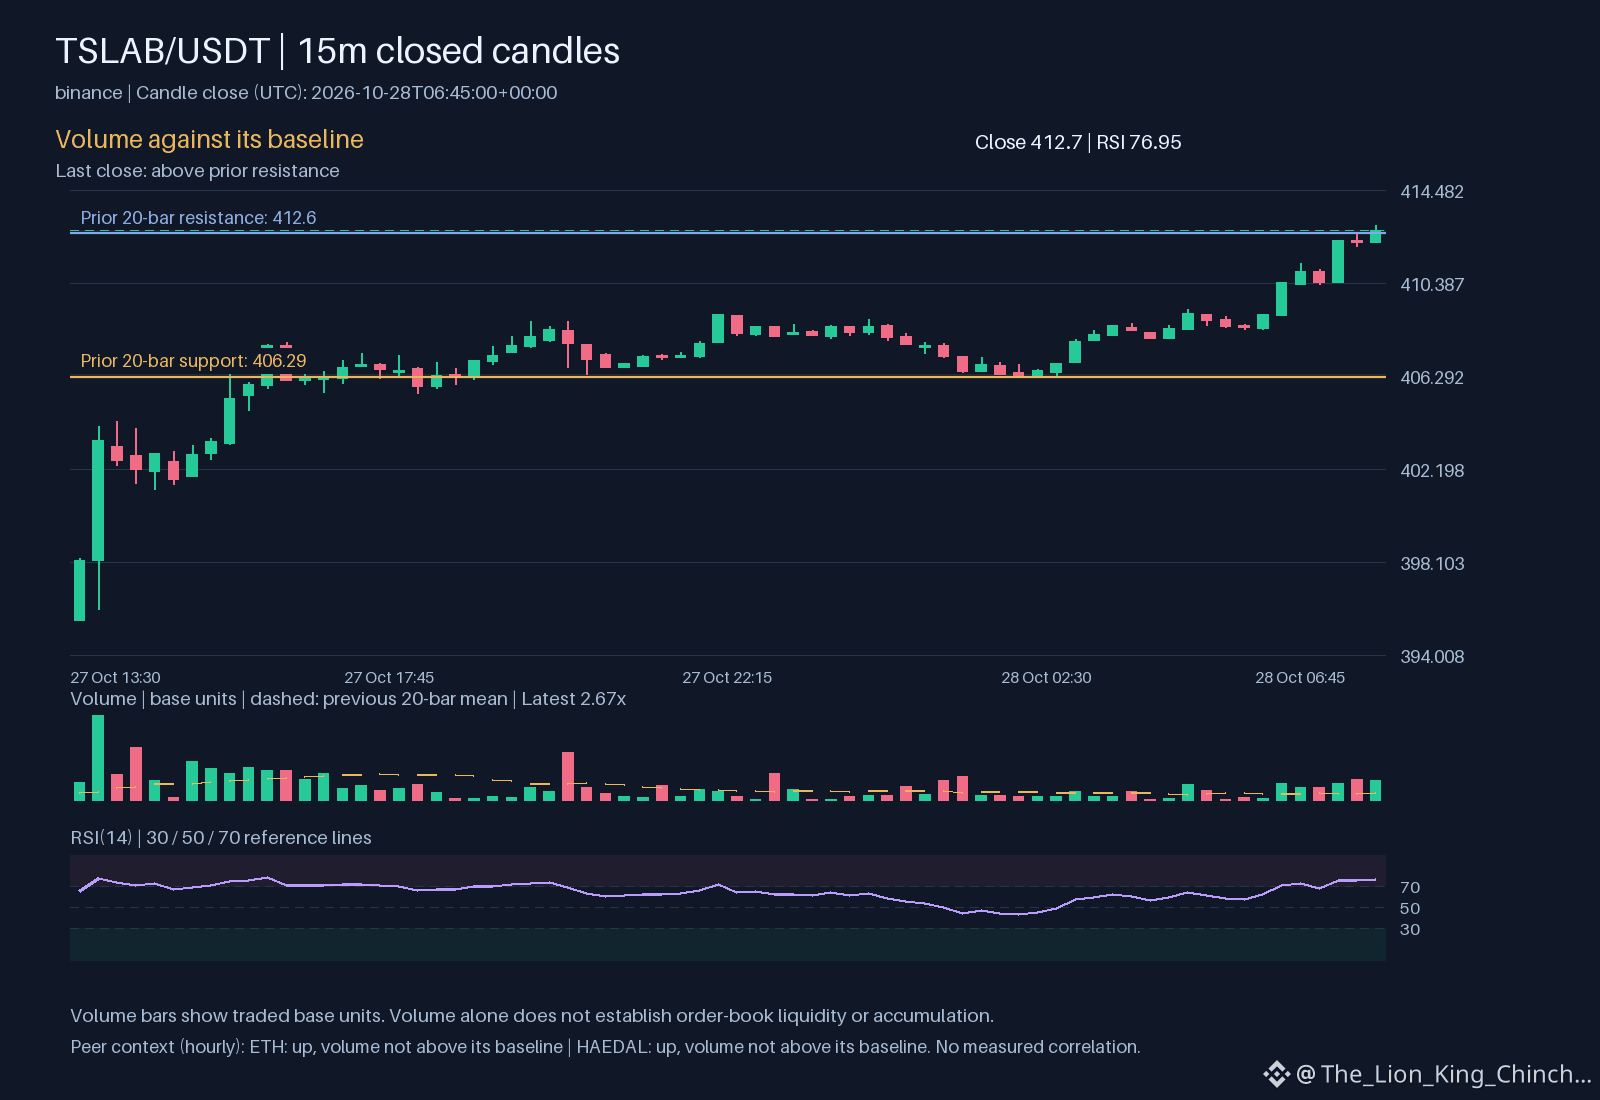
Trading $TSLAB currently shows an upward hourly direction while the volume remains above its baseline. This activity places the price at 412.7, which is currently positioned above the resistance level of 412.6. When an asset moves past such markers on elevated volume, the immediate question is whether the momentum reflects sustained interest or a temporary reaction to localized order flow.
Looking at peers on the same venue, $ETH and $HAEDAL both show an upward hourly direction as well. However, their volume remains at or below their respective baselines. This difference is significant. While all three assets moved up during the same hour, the mechanics behind the moves differ. A shared direction does not indicate a measured correlation or a common cause. It simply shows that multiple assets can move upward simultaneously for different reasons.
The presence of high volume on $TSLAB suggests a different level of participation compared to $ETH and $HAEDAL. One scenario is that the high volume confirms the breakout above 412.6, while another scenario suggests a climax where the move might struggle to hold. To reassess this interpretation, one should monitor if the price remains above 409.677 as volume returns to normal levels. Monitoring 76.9452 at 76.9452 also helps identify if the move is entering an overextended state. Ultimately, how a move holds matters more than the initial direction.
Probabilistic market research, not a recommendation or guaranteed return.
The comparison to keep in mind: $ETH has hourly direction up and volume not above its baseline; $HAEDAL has hourly direction up and volume not above its baseline. This alone does not establish correlation.
Which matters more in this comparison: direction or how the move holds?
#TSLAB #ETH #HAEDAL #CryptoWatchlist
$TSLAB : Moving Beyond Volume Spikes
Trading $TSLAB currently shows an upward hourly direction while the volume remains above its baseline. This activity places the price at 412.7, which is currently positioned above the resistance level of 412.6. When an asset moves past such markers on elevated volume, the immediate question is whether the momentum reflects sustained interest or a temporary reaction to localized order flow.
Looking at peers on the same venue, $ETH and $HAEDAL both show an upward hourly direction as well. However, their volume remains at or below their respective baselines. This difference is significant. While all three assets moved up during the same hour, the mechanics behind the moves differ. A shared direction does not indicate a measured correlation or a common cause. It simply shows that multiple assets can move upward simultaneously for different reasons.
The presence of high volume on $TSLAB suggests a different level of participation compared to $ETH and $HAEDAL . One scenario is that the high volume confirms the breakout above 412.6, while another scenario suggests a climax where the move might struggle to hold. To reassess this interpretation, one should monitor if the price remains above 409.677 as volume returns to normal levels. Monitoring 76.9452 at 76.9452 also helps identify if the move is entering an overextended state. Ultimately, how a move holds matters more than the initial direction.
Probabilistic market research, not a recommendation or guaranteed return.
The comparison to keep in mind: $ETH has hourly direction up and volume not above its baseline; $HAEDAL has hourly direction up and volume not above its baseline. This alone does not establish correlation.
Which matters more in this comparison: direction or how the move holds?
#TSLAB #ETH #HAEDAL #CryptoWatchlist
79

·
--
Übersetzung ansehen
Electric Surge: $TSLAB Eyes Breakout on Binance Spot ⚡
Price action – $TSLAB opened the session at $408.17, up 3.81 % over the past 24 hours on solid USDT‑denominated volume. The token is coiling just below its recent ceiling, hinting at a potential breakout if buying pressure intensifies.
Key levels – Immediate support sits around $395.00, a floor that held during the last pull‑back. Resistance is clustered near $415.00, the prior swing high that has capped upside so far. The mid‑range corridor runs roughly $402‑$410, with current price perched near the top of this band.
Why it matters – Tesla’s EV momentum remains strong and the upcoming Q3 earnings report could add catalyst fuel to the price action, making the token a focal point for both crypto‑and‑equity traders.
Short outlook – From a breakout‑watch perspective, a decisive volume spike above $415.00 would likely trigger a bullish thrust toward $430+. Absent that, the token may retest $395–$402 before attempting another push. Keep an eye on order‑book depth for the trigger.
#TSLAB #Tesla #BinanceSquare

·
--
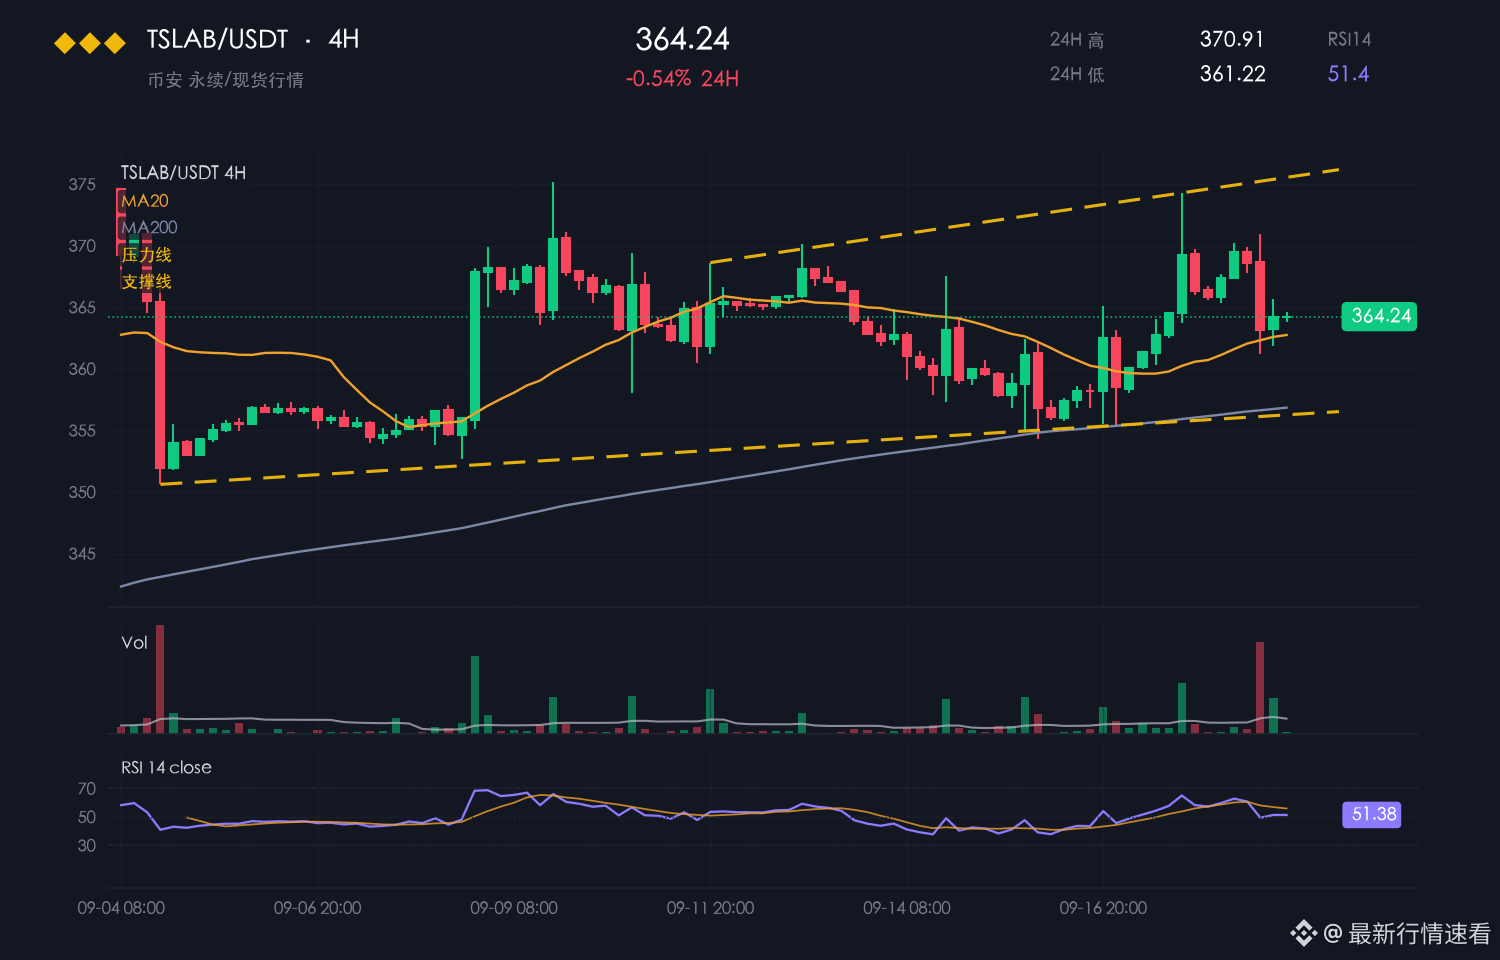
TSLAB steht aktuell bei 381.54, ein Plus von 2.66 % in 24 Stunden und 5.32 % in 7 Tagen. Die Tagesspanne liegt bei 370.36–381.72, die Schwankungsbreite bei 3.1 %.
【Marktüberblick】
Viele fragen, ob TSLAB derzeit interessant ist. Hier eine kurze Einschätzung.
Zunächst eine Selbstverständlichkeit: Die Tagesspanne von 370.36–381.72 ist öffentlich einsehbar und nicht von irgendwem eingezeichnet.
Bei dieser Korrektur hat sich TSLAB bemerkenswert widerstandsfähig gezeigt und gehört kurzfristig zu den stärksten Werten am Markt.
Der Bereich um 370.36 markiert den Ausgangspunkt des aktuellen Anstiegs. Ein Rücksetzer dorthin wäre vom Chancen-Risiko-Verhältnis her nicht schlecht.
Im Vergleich zu BTC mit -0.20 % zeigt TSLAB relative Stärke. Solche Werte sind bei Erholungen oft die Vorreiter.
【Makrolage】 Über Nacht: US-Aktienmärkte – Nasdaq -0.21 %, S&P 500 -0.52 % (Schlusskurs vom 2026-10-26); bei BTC-ETFs gab es in diesem Monat Nettoabflüsse von rund 45,2 Mrd. US-Dollar. Die US-CPI-Inflation lag mit 3.7 % im Jahresvergleich über den Erwartungen. Die Wahrscheinlichkeit einer Zinserhöhung beim Zinsentscheid am 2026-10-27/28 liegt bei rund 47 %.
Kurzfristig überwiegt die bullische Einschätzung.
【Argumente für einen Kursanstieg】
Was ist der entscheidende Punkt? Die Marke von 370.36. Erst mit 370.36 gibt es eine Spanne, und erst mit einer Spanne gibt es einen Rhythmus.
Der Anstieg von 5.32 % in sieben Tagen ist bereits erreicht. Hinter dieser Aufwärtsbewegung steht Unterstützung auf Wochenbasis.
Die Marke von 381.72 wurde wiederholt getestet, doch die Käufer zeigen bislang keine Anzeichen, nachzugeben.
Lass es langsam angehen, keine Eile.
Das Risiko besteht darin, dass es nach dem kurzfristigen Anstieg jederzeit zu Gewinnmitnahmen kommen kann. Wer dem Kurs hinterherläuft, riskiert, von einem plötzlichen Docht nach unten erwischt zu werden.
$TSLAB #TSLAB
·
--
Mensch, die Krypto-Aktien sind heute wohl im Rudel unterwegs, um uns Angst einzujagen. $TSLAB kostet aktuell 397.91 US-Dollar, ein Plus von 4.812 % innerhalb von 24 Stunden. Heute erreichte der Kurs ein Hoch von 398.11 und fiel gerade einmal auf 379.06. Der Glücksgott starrte eine ganze Weile auf diese Linie und konnte partout nicht erkennen, was sie eigentlich vorhatte.
Tesla ist nicht die einzige Aktie, die verrücktspielt: $SNDKB kostet aktuell 1283.62 US-Dollar, ein Plus von 3.094 %, und $NVDAB 217.9 US-Dollar, ein Plus von 3.109 %. Alle drei ziehen nach oben. Alle sagen, Krypto-Aktien würden nur dem US-Aktienmarkt hinterherlaufen und ein bisschen davon profitieren. Ich habe mir die Kursgewinne der drei angesehen: Tesla liegt vorn, aber die anderen beiden sind auch nicht zurückgeblieben. Das ist kein bloßes Hinterherlaufen – die sind ganz offensichtlich gemeinsam unterwegs.
Der Glücksgott legt sich fest: Diesmal setze ich auf den gemeinsamen Tanz. Tesla kämpft nicht allein.
Und was jetzt? Es gibt zwei Fragen: 1. Wenn alle drei nach oben ziehen, wer treibt hier eigentlich wen an? 2. Wer wird als Nächstes nahe an einem Höchststand liegen? Verratet mir eure Antwort und nennt #TSLAB #美股 .
46

·
--
$TSLAB +3.78% | $MRNAB +3.60% | $ANIME +3.48%
#TSLAB stieg leicht auf 393,77 $, ein Plus von +3,78 % bei einem Handelsvolumen von 7,0 Mio. $. Der moderate Anstieg deutet trotz der höheren Marktkapitalisierung auf anhaltendes Interesse hin.
#MRNAB stieg auf 196,84 $ und legte um +3,60 % zu, während 1,5 Mio. $ den Besitzer wechselten. Die Dynamik wirkt stabil, auch wenn das Volumen nicht besonders hoch ist.
#ANIME kletterte auf 0,00297000 $ und legte bei einem Handelsvolumen von 1,3 Mio. $ um +3,48 % zu. Small-Cap-Token können starken Schwankungen unterliegen, daher könnte dieser Anstieg nur ein kurzfristiger Schub sein.
Achte auf die relative Stärke des Kapitalflusses von 7 Mio. $ in TSLAB gegenüber den Aktivitäten von unter 2 Mio. $ bei MRNAB und ANIME. Die Unterschiede könnten darauf hindeuten, wo Trader Risiken eingehen.
#Write2Earn #Binance
1

·
--
$SNXXB +4.79% | $TSLAB +4.75% | $INTCB +4.72%
#SNXXB liegt bei 8,53 $, ein Plus von +4,79 % bei einem Handelsvolumen von 6,5 M $. Das moderate Volumen deutet darauf hin, dass der Anstieg durch kurzfristige Käufe getrieben sein könnte.
#TSLAB steigt auf 393,15 $, ein Plus von +4,75 % bei einem Handelsvolumen von 7,6 M $. Dieses Handelsaufkommen reicht aus, um den Aufwärtsdruck aufrechtzuerhalten, ist aber nicht überwältigend.
#INTCB erreicht 90,58 $, ein Plus von +4,72 % bei einem Volumen von 8,4 M $. Der höhere Umsatz könnte auf ein breiteres Interesse hindeuten, doch die Rally könnte weiterhin fragil sein.
👀 Beobachte, ob der Volumenvorsprung von INTCB den Kursvorteil gegenüber den beiden anderen aufrechterhält.
#Write2Earn #Binance
1
·
--
$TSLAB +5,17 % | $MET +5,09 % | $OSMO +4,86 %
#TSLAB liegt bei 393,17 $, ein Plus von +5,17 % bei einem Volumen von 7,7 Mio. $. Die Kursentwicklung deutet auf moderaten Kaufdruck hin, könnte aber auch nur eine kurzfristige Erholung sein.
#MET wird zu 0,3136 $ gehandelt und steigt bei einem Volumen von 1,6 Mio. $ um +5,09 %. Die Dynamik wirkt solide, doch die geringe Marktkapitalisierung macht den Token anfällig für schnelle Kehrtwenden.
#OSMO liegt bei 0,0518 $ und gewinnt bei einem Volumen von 1,6 Mio. $ +4,86 %. Das ähnliche Volumen wie bei MET deutet auf eine koordinierte Bewegung hin, doch die allgemeine Marktstimmung könnte weitere Gewinne begrenzen.
👀 Behalte im Auge, ob die ähnlichen Volumina von MET und OSMO auf ein rotierendes Interesse an diesen kleineren Token hindeuten.
#Write2Earn #Binance
3
·
--
$TSLAB +5.96% | $ZIL +5.89% | $SNXXB +5.69%
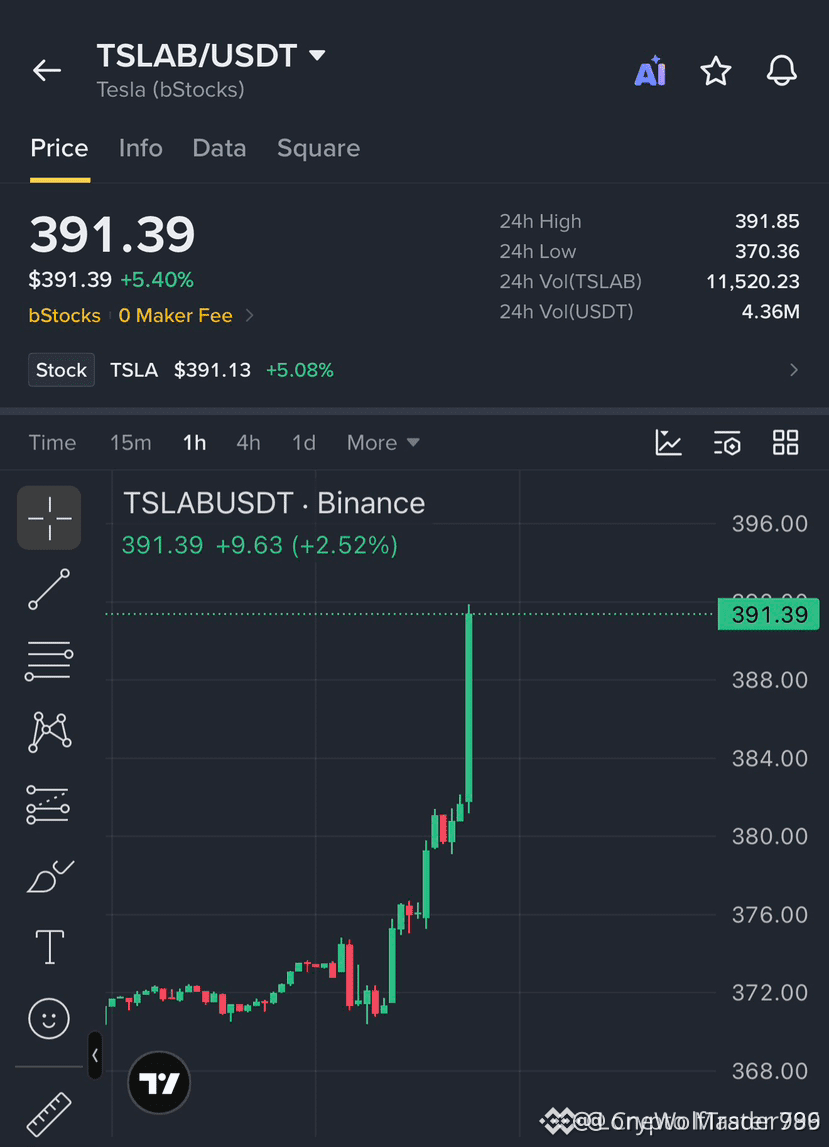
#TSLAB wird zu $393.39 gehandelt und steigt bei einem Handelsvolumen von $7.9 M um +5.96%.
#ZIL liegt bei $0.00197600 und steigt bei einem Handelsvolumen von $1.2 M um +5.89%.
#SNXXB steigt auf $8.54 und gewinnt +5.69%, während ein Handelsvolumen von $6.5 M verzeichnet wird.
🔎 Der Kontrast zwischen dem starken Handelsfluss bei SNXXB und dem moderaten Volumen bei ZIL könnte auf eine unterschiedliche kurzfristige Dynamik hindeuten.
#Write2Earn #Binance
9

🔥 $TSLAB Bereit für den nächsten Schritt? 🚀
Trader, behaltet TSLAB im Blick! 👀 Volatilität kann Chancen eröffnen, aber eine Bestätigung ist entscheidend.
📊 Achtet auf wichtige Unterstützungs- und Widerstandsniveaus.
🎯 Haltet Ausschau nach einem Ausbruch mit hohem Volumen.
⚡ Steigt erst nach einer Bestätigung ein und behaltet euer Risiko im Griff.
Seid ihr bei $TSLAB bullish oder bearish? Teilt eure Analyse unten! 👇
#TSLAB #CryptoTrading #BinanceSquare #TradingSetup
{spot}(TSLABUSDT)
🔥 $TSLAB Bereit für den nächsten Schritt? 🚀
Trader, behaltet TSLAB im Blick! 👀 Volatilität kann Chancen eröffnen, aber eine Bestätigung ist entscheidend.
📊 Achtet auf wichtige Unterstützungs- und Widerstandsniveaus.
🎯 Haltet Ausschau nach einem Ausbruch mit hohem Volumen.
⚡ Steigt erst nach einer Bestätigung ein und behaltet euer Risiko im Griff.
Seid ihr bei $TSLAB bullish oder bearish? Teilt eure Analyse unten! 👇
#TSLAB #CryptoTrading #BinanceSquare #TradingSetup
73

👑🔥 VIP-SIGNAL | $TSLAB 🔥
📊 Zeitrahmen: 4H
🟢 Tendenz: LONG (Bestätigung erforderlich)
🎯 Einstieg: 385–392
🥇 TP1: 405
🥈 TP2: 420
🥉 TP3: 435
🛑 SL: 374
📈 Warte vor dem Einstieg auf einen Ausbruch und den anschließenden Retest.
💎 Riskiere pro Trade nur 1 %. Handle mit Bedacht!
{spot}(TSLABUSDT)
#TSLABUSDT #BinanceSquare #CryptoTrading #TSLAB 🚀
👑🔥 VIP-SIGNAL | $TSLAB 🔥
📊 Zeitrahmen: 4H
🟢 Tendenz: LONG (Bestätigung erforderlich)
🎯 Einstieg: 385–392
🥇 TP1: 405
🥈 TP2: 420
🥉 TP3: 435
🛑 SL: 374
📈 Warte vor dem Einstieg auf einen Ausbruch und den anschließenden Retest.
💎 Riskiere pro Trade nur 1 %. Handle mit Bedacht!
#TSLABUSDT #BinanceSquare #CryptoTrading #TSLAB 🚀
📊 Zeitrahmen: 4H
🟢 Tendenz: LONG (Bestätigung erforderlich)
🎯 Einstieg: 385–392
🥇 TP1: 405
🥈 TP2: 420
🥉 TP3: 435
🛑 SL: 374
📈 Warte vor dem Einstieg auf einen Ausbruch und den anschließenden Retest.
💎 Riskiere pro Trade nur 1 %. Handle mit Bedacht!
#TSLABUSDT #BinanceSquare #CryptoTrading #TSLAB 🚀
1
1
115

·
--
$TSLAB sieht bereit aus, von hier aus weiter nach oben auszubrechen 🚀
🎯 Kaufen $TSLAB 389.9429 bis 392.4393
Stop-Loss 379.4757
Kursziele 410.6364 / 423.1007 / 441.7971
Der Kurs steigt über das 7-Tages-Hoch von 397.5800
Der RSI liegt bei 68, also ist noch Luft nach oben
Heute 5,0 Prozent im Plus und hält sich nahe dem Hoch stark
Während ich das schreibe, bewegt sich der Kurs innerhalb der Zone
Tippe auf $TSLAB , um zu kaufen
#TSLAB #TradingSignals
5
·
--
$TSLAB +6.08% | $NIGHT +5.93% | $NOM +5.68%
#TSLAB wird zu 395,20 $ gehandelt und legt bei einem Volumen von 7,0 M $ um +6,08 % zu. Der Preissprung wird durch einen soliden Umsatz gestützt und deutet auf echten Kaufdruck hin.
#NIGHT liegt bei 0,0397 $ und steigt bei einem Volumen von 1,9 M $ um +5,93 %. Das moderate Volumen bedeutet, dass die Rallye anfälliger für kurzfristige Schwankungen sein könnte.
#NOM stieg auf 0,00165500 $ und legte bei einem Handelsvolumen von 2,6 M $ um +5,68 % zu. Das relativ höhere Volumen verleiht dem Anstieg etwas mehr Glaubwürdigkeit als bei den kleineren Gewinnern.
👀 Beobachte, wie sich die unterschiedlichen Volumina auf die Nachhaltigkeit des Aufwärtstrends der einzelnen Token auswirken könnten.
#Write2Earn #Binance
14

·
--
Erst mal keine Spekulationen: $TSLAB 24 Stunden +6,08 %, aktueller Preis: 394,19 USDT.
📊 Daten-Snapshot
· Aktueller Preis: 394,19 USDT
· 24 Std.: +6,08 %
· Spanne: 370,36 — 395,15
· Handelsvolumen: 5017809.96 USDT
Die Daten liegen auf dem Tisch, die Stimmung spricht für sich. Das Volumen ist wichtiger als der Preis – Bullen und Bären ringen in dieser Spanne miteinander.
Wie schätzt du diese Bewegung ein? 👇
#市场观察 #TSLAB #Binance

1
·
--
$TSLAB liegt heute 6.5 Prozent im Plus, aber ich lasse die Finger davon
Das Volumen liegt bei nur dem 0,7-Fachen des Durchschnitts, während der RSI auf dem 1-Stunden-Chart 87 erreicht 📉
Das bedeutet, dass der Anstieg ohne echte Unterstützung an Fahrt verliert
Ich möchte erst einen Stundenschlusskurs über 395.1500 $ sehen und dass sich der Kurs darüber hält, bevor ich einsteige
Oder einen sauberen Rücksetzer, der bei 370.3600 $ hält und wieder nach oben dreht 🛑
Der Kurs könnte weiter steigen, ohne dass du dabei bist, aber ein schlechter Einstieg kostet mehr als eine verpasste Bewegung
$TSLAB jetzt hinterherjagen oder auf 370.3600 $ warten?
#TSLAB #Risikomanagement
5

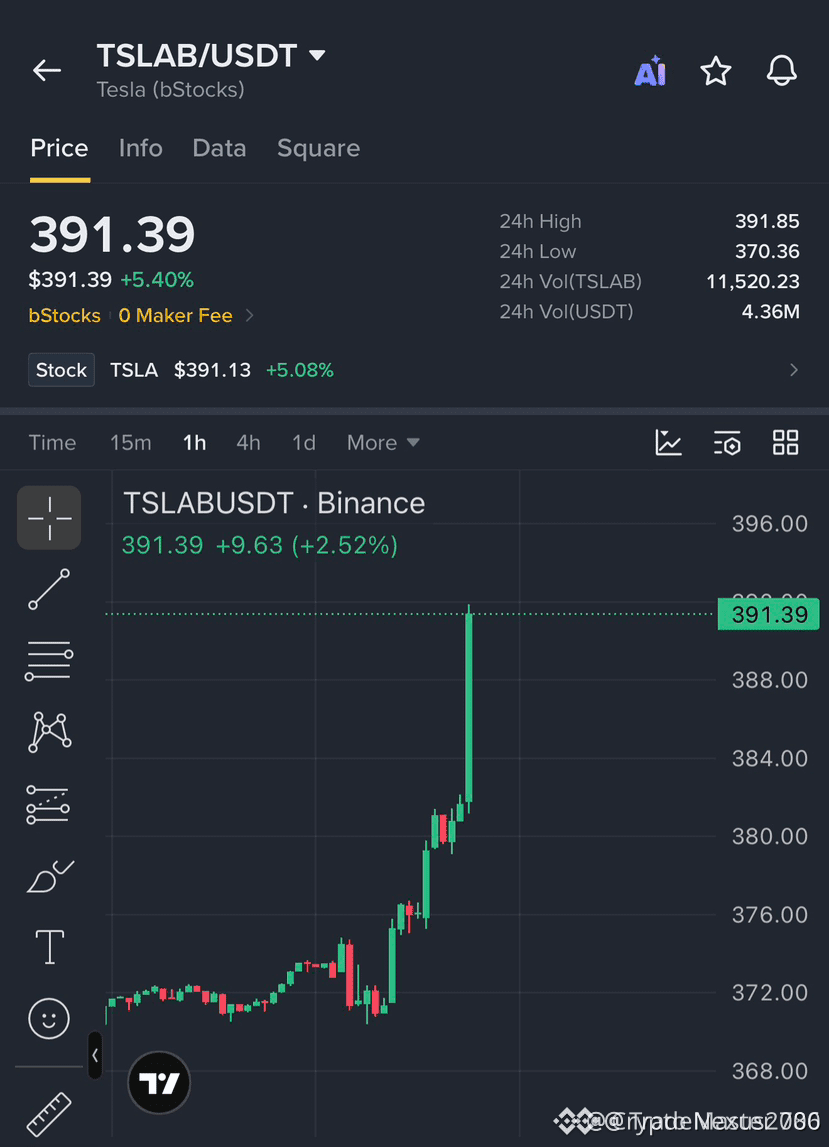
🚀 $TSLAB STÜRMT DURCH DIE LIQUIDITÄTSZONE – BULLISHES SETUP! 🦈
Einstieg: 389.00-391.40 ⚡
Kursziele: 394.00/396.00/400.00 🚀
Stop-Loss: 384.00 ⚠️
📊 Der Nachfrageblock zwischen 389 und 391.40 hat wiederholt Verkaufsdruck absorbiert – ein Zeichen für eine Akkumulationsphase durch Smart Money. 🌊 Jüngste Volumenspitzen im 4-Stunden-Chart zeigen einen Liquiditäts-Sweep, der eine klare Fair-Value-Lücke hinterlassen hat, die nun geschlossen werden könnte. 📌 Da der Markt jetzt den Korridor zwischen 394 und 400 im Blick hat, entspricht dieses Setup einem klassischen institutionellen Vorstoß.
💬 Wie positionierst du dich, wenn sich der nächste Liquiditätspool wieder auffüllt? 👇
⚠️ Keine Anlageberatung. Begrenze stets dein Risiko. 🛡️
🏷️ #TSLAB #LongSetup #LiquiditySweep #Crypto
🔥 💎
7

🚀 $TSLAB STÜRMT IN DIE BULLISCHE ZONE – BEREIT, AUF DER NÄCHSTEN WELLE ZU REITEN! 💥
Einstieg: 389-391.40 ⚡
Ziel: 394.00 🚀
Ziel: 396.00 🚀
Ziel: 400.00 🚀
Stop-Loss: 384.00 ⚠️
📊 Der Orderblock im Bereich 389‑391 schluckt den Verkaufsdruck wie ein Hai, während das Volumen im 4-Stunden-Chart stark anzieht. 🦈 Das große Geld sichert sich Liquidität und bereitet einen klaren Ausbruch in Richtung der 400er-Marke vor. 💡 Da das Chance-Risiko-Verhältnis zu unseren Gunsten steht, wirkt das Aufwärtspotenzial wie eine Startbahn für den nächsten Höhenflug. 💬 Platzierst du schon deine Kauforders für den nächsten Schub oder wartest du auf einen Rücksetzer, um erneut einzusteigen? 👇
⚠️ Keine Finanzberatung. Achte immer auf dein Risikomanagement. 🛡️
🏷️ #TSLAB #LongSetup #Momentum #Crypto
🚀 💎
1
Anmelden und weiter Inhalte entdecken
Krypto-Nutzer weltweit auf Binance Square kennenlernen
⚡️ Bleib in Sachen Krypto stets am Puls.
💬 Die weltgrößte Kryptobörse vertraut darauf.
👍 Erhalte verlässliche Einblicke von verifizierten Creators.
E-Mail-Adresse/Telefonnummer
Trendthemen
1
#CanMicrosoftDeliverOnAI
353,256 Aufrufe
2,808 Kommentare
2
#CanGoogleDefindItsCore
209,558 Aufrufe
1,996 Kommentare
3
#EarningsSeason
5.9M Aufrufe
28,838 Kommentare
4
#$10.9BBitcoinOptionsExpireFriday
537 Aufrufe
32 Kommentare
5
#ThailandSupremeCourtRulesBitcoinIsProperty
1,370 Aufrufe
116 Kommentare
6
#BitcoinSurpasses$81K
19,845 Aufrufe
82 Kommentare
7
#RobinhoodFalls8.4%AfterItsResults
12,299 Aufrufe
262 Kommentare
8
#KOSPISurges6.63%BackAbove6000
12,469 Aufrufe
275 Kommentare
9
#DatavaultAICantWithdrawBitcoinFromBiconomy
13,789 Aufrufe
245 Kommentare
10
#FOMCWatch
9.3M Aufrufe
29,558 Kommentare