
#impactbytrade
impactbytrade
365 Aufrufe
3 Kommentare
Hot
Zuletzt

·
--
Übersetzung ansehen
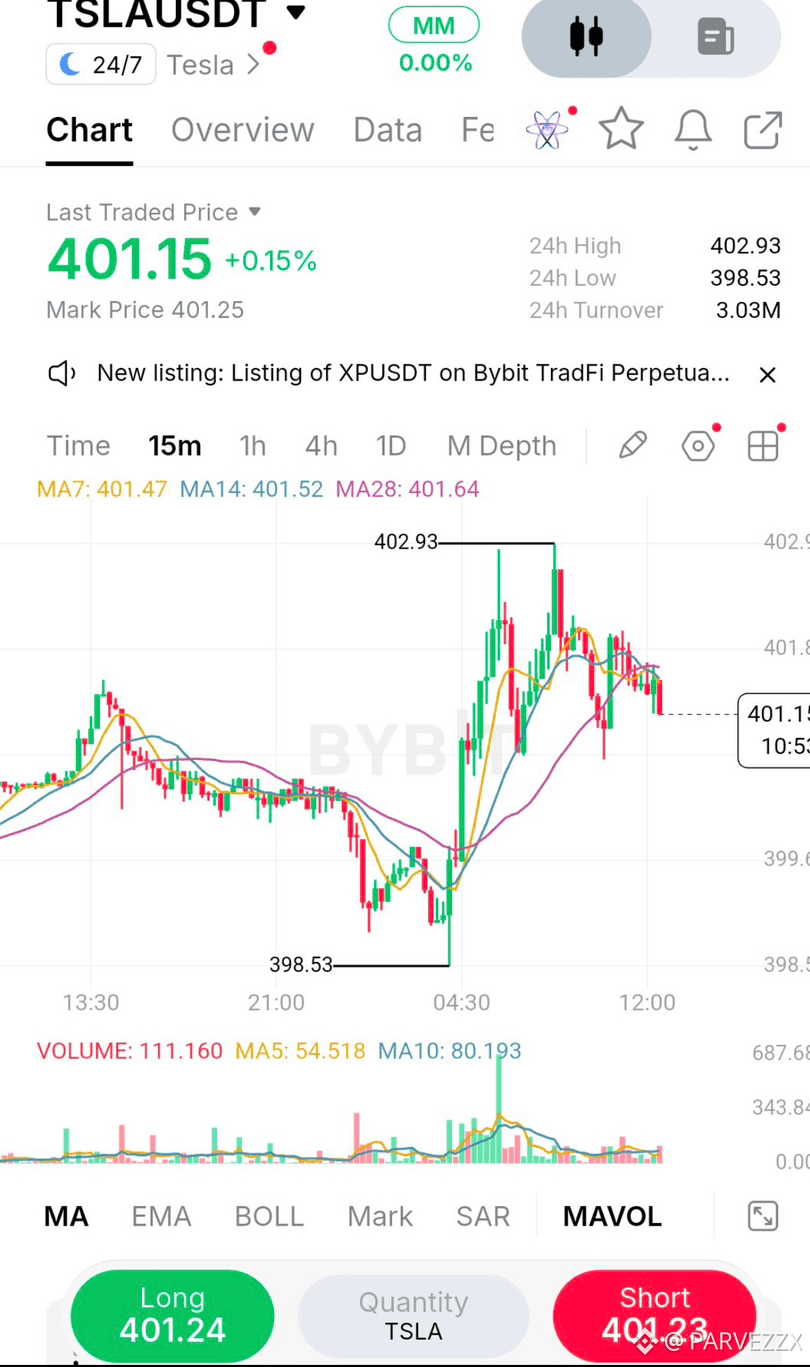
I watched that sharp spike off 398.53 and chose not to chase it. Right now, on the 15m TSLAUSDT chart, price is compressing between 400.50 and the 402.93 high. What stands out is the faded volume following the initial impulse usually a sign buyers are exhausted and a pullback is brewing.
When volume dries up at the highs, it rarely means the move is over; it usually means the market is taking a breath. But if that breath turns into a heavy sell-off without buyers stepping in, the structure shifts quickly. I've been burned before by assuming every tight consolidation is just a pause before continuation. That's why I'm letting the chart come to me instead of forcing an entry mid-range.
I'm waiting for a lower-risk test of structure rather than buying the top. A pullback into 399.50-
400.50 would let me align with the 15m moving averages (currently pinching around 401.50) and the midpoint of that impulse leg. If price pushes straight to 406 without a retest, I simply miss the trade. I'm okay with that. There will be another setup.
Bias: LONG
Entry Zone: $399.50 - $400.50
Confirmation: A bullish 15m close (rejection wick) inside the zone.
Stop / Invalidation: $398.40 (Just below the recent swing low)
TP1: $402.50
TP2: $406.00
R:R: 1:2
The main risk? A complete rejection at 402.93 leaving a double top, or a slow bleed that slices right through 398.53. I won't blindly catch a falling knife; I need to see buyers step in first. My personal rule here: waiting for a retest typically provides a tighter stop and better R:R than entering mid-range. Are you buying this breakout or waiting for the dip?
$TSLAB $BTC
#IMPACTbyTrade #WSOT2026
{spot}(TSLABUSDT)
{future}(BTCUSDT)
I watched that sharp spike off 398.53 and chose not to chase it. Right now, on the 15m TSLAUSDT chart, price is compressing between 400.50 and the 402.93 high. What stands out is the faded volume following the initial impulse usually a sign buyers are exhausted and a pullback is brewing.
When volume dries up at the highs, it rarely means the move is over; it usually means the market is taking a breath. But if that breath turns into a heavy sell-off without buyers stepping in, the structure shifts quickly. I've been burned before by assuming every tight consolidation is just a pause before continuation. That's why I'm letting the chart come to me instead of forcing an entry mid-range.
I'm waiting for a lower-risk test of structure rather than buying the top. A pullback into 399.50-
400.50 would let me align with the 15m moving averages (currently pinching around 401.50) and the midpoint of that impulse leg. If price pushes straight to 406 without a retest, I simply miss the trade. I'm okay with that. There will be another setup.
Bias: LONG
Entry Zone: $399.50 - $400.50
Confirmation: A bullish 15m close (rejection wick) inside the zone.
Stop / Invalidation: $398.40 (Just below the recent swing low)
TP1: $402.50
TP2: $406.00
R:R: 1:2
The main risk? A complete rejection at 402.93 leaving a double top, or a slow bleed that slices right through 398.53. I won't blindly catch a falling knife; I need to see buyers step in first. My personal rule here: waiting for a retest typically provides a tighter stop and better R:R than entering mid-range. Are you buying this breakout or waiting for the dip?
$TSLAB $BTC
#IMPACTbyTrade #WSOT2026
When volume dries up at the highs, it rarely means the move is over; it usually means the market is taking a breath. But if that breath turns into a heavy sell-off without buyers stepping in, the structure shifts quickly. I've been burned before by assuming every tight consolidation is just a pause before continuation. That's why I'm letting the chart come to me instead of forcing an entry mid-range.
I'm waiting for a lower-risk test of structure rather than buying the top. A pullback into 399.50-
400.50 would let me align with the 15m moving averages (currently pinching around 401.50) and the midpoint of that impulse leg. If price pushes straight to 406 without a retest, I simply miss the trade. I'm okay with that. There will be another setup.
Bias: LONG
Entry Zone: $399.50 - $400.50
Confirmation: A bullish 15m close (rejection wick) inside the zone.
Stop / Invalidation: $398.40 (Just below the recent swing low)
TP1: $402.50
TP2: $406.00
R:R: 1:2
The main risk? A complete rejection at 402.93 leaving a double top, or a slow bleed that slices right through 398.53. I won't blindly catch a falling knife; I need to see buyers step in first. My personal rule here: waiting for a retest typically provides a tighter stop and better R:R than entering mid-range. Are you buying this breakout or waiting for the dip?
$TSLAB $BTC
#IMPACTbyTrade #WSOT2026
99

$ARB 🚀 CATECOIN (CATE) — GROSSES AUSBRUCHSPOTENZIAL! 🔥
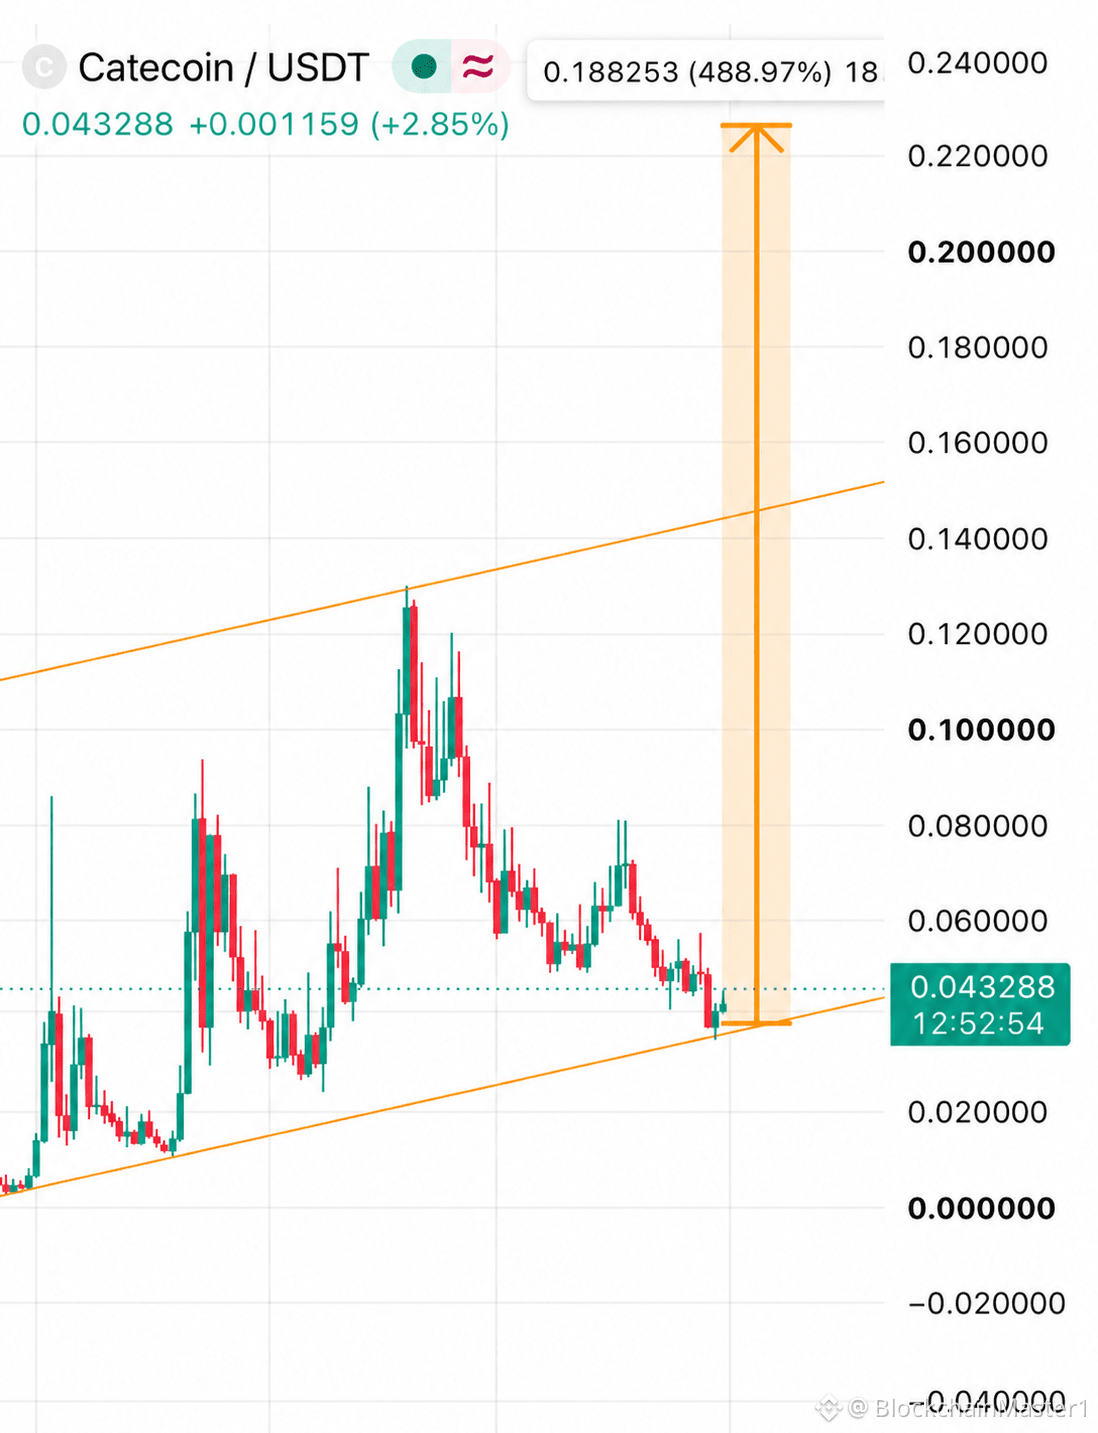
Catecoin zeigt eine interessante technische Struktur und wird derzeit bei etwa $0.043288 gehandelt. Käufer versuchen, eine wichtige Unterstützungszone zu verteidigen. Der Chart zeigt einen langfristig steigenden Kanal, was darauf hindeutet, dass die übergeordnete Struktur bullisch bleiben könnte, sofern die untere Trendlinie weiterhin hält.
📊 WICHTIGE NIVEAUS & LANGFRISTIGE ZIELE
💰 Aktueller Preis: $0.043288
🟢 Unterstützungszone: $0.0350–$0.0400
📈 Widerstand 1: $0.0500–$0.0600
🚀 Widerstand 2: $0.0800–$0.1000
🎯 TP1: $0.0600
🔥 TP2: $0.0800
🚀 TP3: $0.1200
🌕 Großes Chartziel: $0.2200–$0.2300
Der steigende Kanal deutet auf einen möglichen Erholungspfad hin, doch CATE benötigt ein höheres Kaufvolumen und einen bestätigten Anstieg über den nahegelegenen Widerstand. Ein erfolgreicher Ausbruch könnte neues Interesse wecken und den Weg zu höheren Kursniveaus ebnen.
⚠️ Fällt der Kurs unter die Unterstützung des unteren Kanals, könnte sich das bullische Setup abschwächen. Dies sind spekulative Kursziele aus dem Chart und keine garantierten Prognosen.
Kann $CATE bei der nächsten Marktrallye ein starkes Comeback schaffen? 🔥
#IMPACTbyTrade $CATI $LSK
{future}(CATIUSDT)
{future}(ARBUSDT)
$ARB 🚀 CATECOIN (CATE) — GROSSES AUSBRUCHSPOTENZIAL! 🔥
Catecoin zeigt eine interessante technische Struktur und wird derzeit bei etwa $0.043288 gehandelt. Käufer versuchen, eine wichtige Unterstützungszone zu verteidigen. Der Chart zeigt einen langfristig steigenden Kanal, was darauf hindeutet, dass die übergeordnete Struktur bullisch bleiben könnte, sofern die untere Trendlinie weiterhin hält.
📊 WICHTIGE NIVEAUS & LANGFRISTIGE ZIELE
💰 Aktueller Preis: $0.043288
🟢 Unterstützungszone: $0.0350–$0.0400
📈 Widerstand 1: $0.0500–$0.0600
🚀 Widerstand 2: $0.0800–$0.1000
🎯 TP1: $0.0600
🔥 TP2: $0.0800
🚀 TP3: $0.1200
🌕 Großes Chartziel: $0.2200–$0.2300
Der steigende Kanal deutet auf einen möglichen Erholungspfad hin, doch CATE benötigt ein höheres Kaufvolumen und einen bestätigten Anstieg über den nahegelegenen Widerstand. Ein erfolgreicher Ausbruch könnte neues Interesse wecken und den Weg zu höheren Kursniveaus ebnen.
⚠️ Fällt der Kurs unter die Unterstützung des unteren Kanals, könnte sich das bullische Setup abschwächen. Dies sind spekulative Kursziele aus dem Chart und keine garantierten Prognosen.
Kann $CATE bei der nächsten Marktrallye ein starkes Comeback schaffen? 🔥
#IMPACTbyTrade $CATI $LSK
Catecoin zeigt eine interessante technische Struktur und wird derzeit bei etwa $0.043288 gehandelt. Käufer versuchen, eine wichtige Unterstützungszone zu verteidigen. Der Chart zeigt einen langfristig steigenden Kanal, was darauf hindeutet, dass die übergeordnete Struktur bullisch bleiben könnte, sofern die untere Trendlinie weiterhin hält.
📊 WICHTIGE NIVEAUS & LANGFRISTIGE ZIELE
💰 Aktueller Preis: $0.043288
🟢 Unterstützungszone: $0.0350–$0.0400
📈 Widerstand 1: $0.0500–$0.0600
🚀 Widerstand 2: $0.0800–$0.1000
🎯 TP1: $0.0600
🔥 TP2: $0.0800
🚀 TP3: $0.1200
🌕 Großes Chartziel: $0.2200–$0.2300
Der steigende Kanal deutet auf einen möglichen Erholungspfad hin, doch CATE benötigt ein höheres Kaufvolumen und einen bestätigten Anstieg über den nahegelegenen Widerstand. Ein erfolgreicher Ausbruch könnte neues Interesse wecken und den Weg zu höheren Kursniveaus ebnen.
⚠️ Fällt der Kurs unter die Unterstützung des unteren Kanals, könnte sich das bullische Setup abschwächen. Dies sind spekulative Kursziele aus dem Chart und keine garantierten Prognosen.
Kann $CATE bei der nächsten Marktrallye ein starkes Comeback schaffen? 🔥
#IMPACTbyTrade $CATI $LSK
665
Anmelden und weiter Inhalte entdecken
Krypto-Nutzer weltweit auf Binance Square kennenlernen
⚡️ Bleib in Sachen Krypto stets am Puls.
💬 Die weltgrößte Kryptobörse vertraut darauf.
👍 Erhalte verlässliche Einblicke von verifizierten Creators.
E-Mail-Adresse/Telefonnummer
Trendthemen
1
#BTCRebounds80K
79,880 Aufrufe
795 Kommentare
2
#Binance98PercentReplenished
45,260 Aufrufe
609 Kommentare
3
#USMidterms-WhatAreMarketsExpecting?
364,157 Aufrufe
2,142 Kommentare
4
#USOctoberNFP-AreRateCutsStillPossible
407,025 Aufrufe
2,890 Kommentare
5
#USClearsSingleStockPerpetualFutures
1,118 Aufrufe
46 Kommentare
6
#StrategySTRCHits$100ForFirstTimeSinceMay
0 Aufrufe
0 Kommentare
7
#TrumpFamilyBackedBitcoinMinerReportsQ3Profit
613 Aufrufe
26 Kommentare
8
#SouthKoreaPlansImmediateCryptoSecurityIncidentReportingRules
20 Aufrufe
4 Kommentare
9
#CourtRejectsCMARequestToPauseSingleStockPerpetuals
313 Aufrufe
17 Kommentare
10
#AMDBeatsExpectations-AINarrativeContinues
105,355 Aufrufe
823 Kommentare