

#tradingsignal
tradingsignal
12.6M Aufrufe
50,943 Kommentare
Hot
Zuletzt

·
--
Bullisch
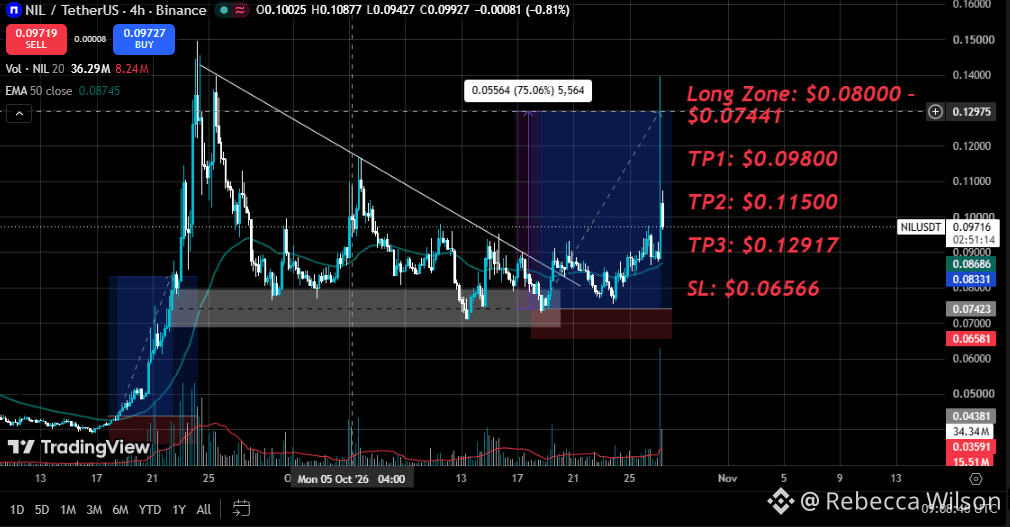
Alle, die ihr das sehen könnt: Ich teile den Swing-Trade in meinem Livestream $NIL
Alle +75%-Take-Profits erreicht, jetzt #TradingSignal
{future}(NILUSDT)
Alle, die ihr das sehen könnt: Ich teile den Swing-Trade in meinem Livestream $NIL
Alle +75%-Take-Profits erreicht, jetzt #TradingSignal
Alle +75%-Take-Profits erreicht, jetzt #TradingSignal
2
843

·
--
:
🚨 $ADA Wale häufen still und leise an: 816 Mio. $ Open Interest! Ausbruch oder Liquidationsfalle? 🚨
Die Derivate- und Spotmärkte für $ADA senden ein massives Warnsignal, das sich jeder Futures-Trader sofort ansehen sollte. Wenn du auf explosive Volatilität aus bist, könnte das dein nächstes Setup sein.
📊 Der Realitätscheck:
• Explosion des Open Interest: In den letzten 24 Stunden wurden über 1,99 Milliarden $ADA in aktive Futures-Kontrakte gebunden. Das ist eine atemberaubende Menge an frischem Hebelkapital.
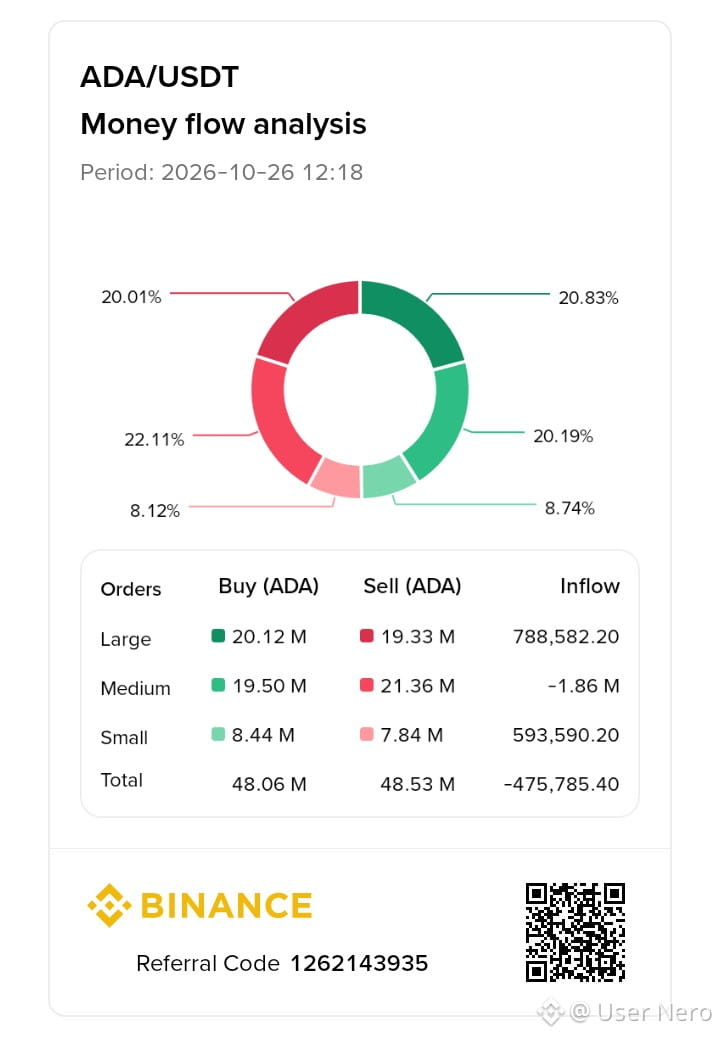
• Wal-Akkumulation vs. Panik im Kleinanlegerbereich (siehe Chart): Sieh dir die Money-Flow-Analyse genau an. Während Kleinanleger und mittelgroße Konten in Panik verkaufen (Abfluss von -1,86 Mio. ADA), tun institutionelle Wale genau das Gegenteil. Große Kauforders dominieren mit einem positiven Zufluss von +788,5.000 ADA! Die Wale fangen den Verkaufsdruck auf.
• Die technische Falle: Das Open Interest erreicht lokale Höchststände, während der Spotpreis direkt unter einer aggressiven lokalen Widerstandszone zusammengedrückt wird.
💡 Der Plan:
Wenn sich während einer Preiskonsolidierung so viel Hebel aufbaut und Wale aktiv große Kauforders platzieren, braut sich eine massive Bewegung in eine Richtung zusammen. Durchbricht ADA den Widerstand, könnte ein aggressiver Short Squeeze mit hoher Dynamik folgen. Sollten es die Bullen nicht schaffen, die Unterstützung zu halten, ist mit einer heftigen Kettenreaktion aus Long-Liquidationen zu rechnen.
💬 Trader, klären wir das in den Kommentaren:
Beobachtet ihr die Wale und baut LONG-Positionen für einen massiven Ausbruch auf, oder stockt ihr SHORT-Positionen auf, weil ihr erwartet, dass Kleinanleger den Kurs nach unten ziehen? Schreibt euren Hebel und eure Kursziele unten in die Kommentare! 👇 Mal sehen, wer richtigliegt.
#writetoearn #Cardano #ADA #FuturesTrading #TradingSignal
2
1.3k

·
--
Übersetzung ansehen
🔥 HAEDALUSDT LONG setup validated!
BIAS: LONG | SCORE: 60.82
STRUCTURE: BULLISH_BREAKOUT
ENTRY: 0.03089
SL: 0.029401 | TP1: 0.033123 | TP2: 0.034612
Strong volume surge +84.05% (5m) and +142.48% (15m) confirms momentum. Price action supports the breakout.
⚠️ This is a setup, not a guaranteed result.
Question: Are you watching HAEDAL for a breakout? 👀
#CryptoSetup
$HAEDAL #TradingSignal #CryptoAnalysis


Übersetzung ansehen
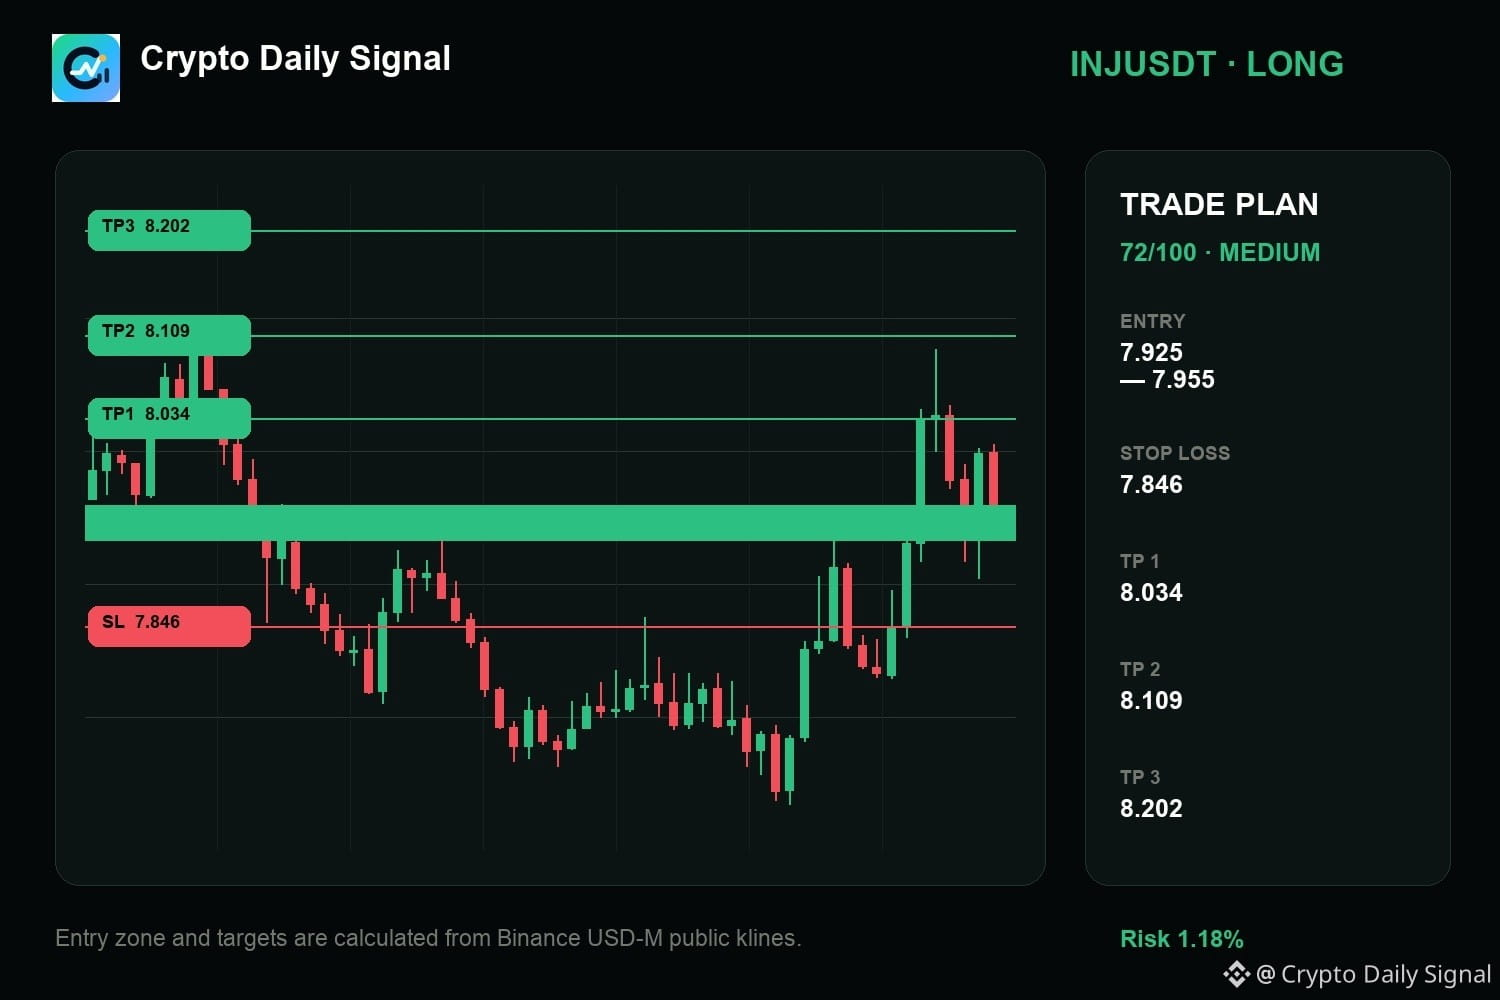
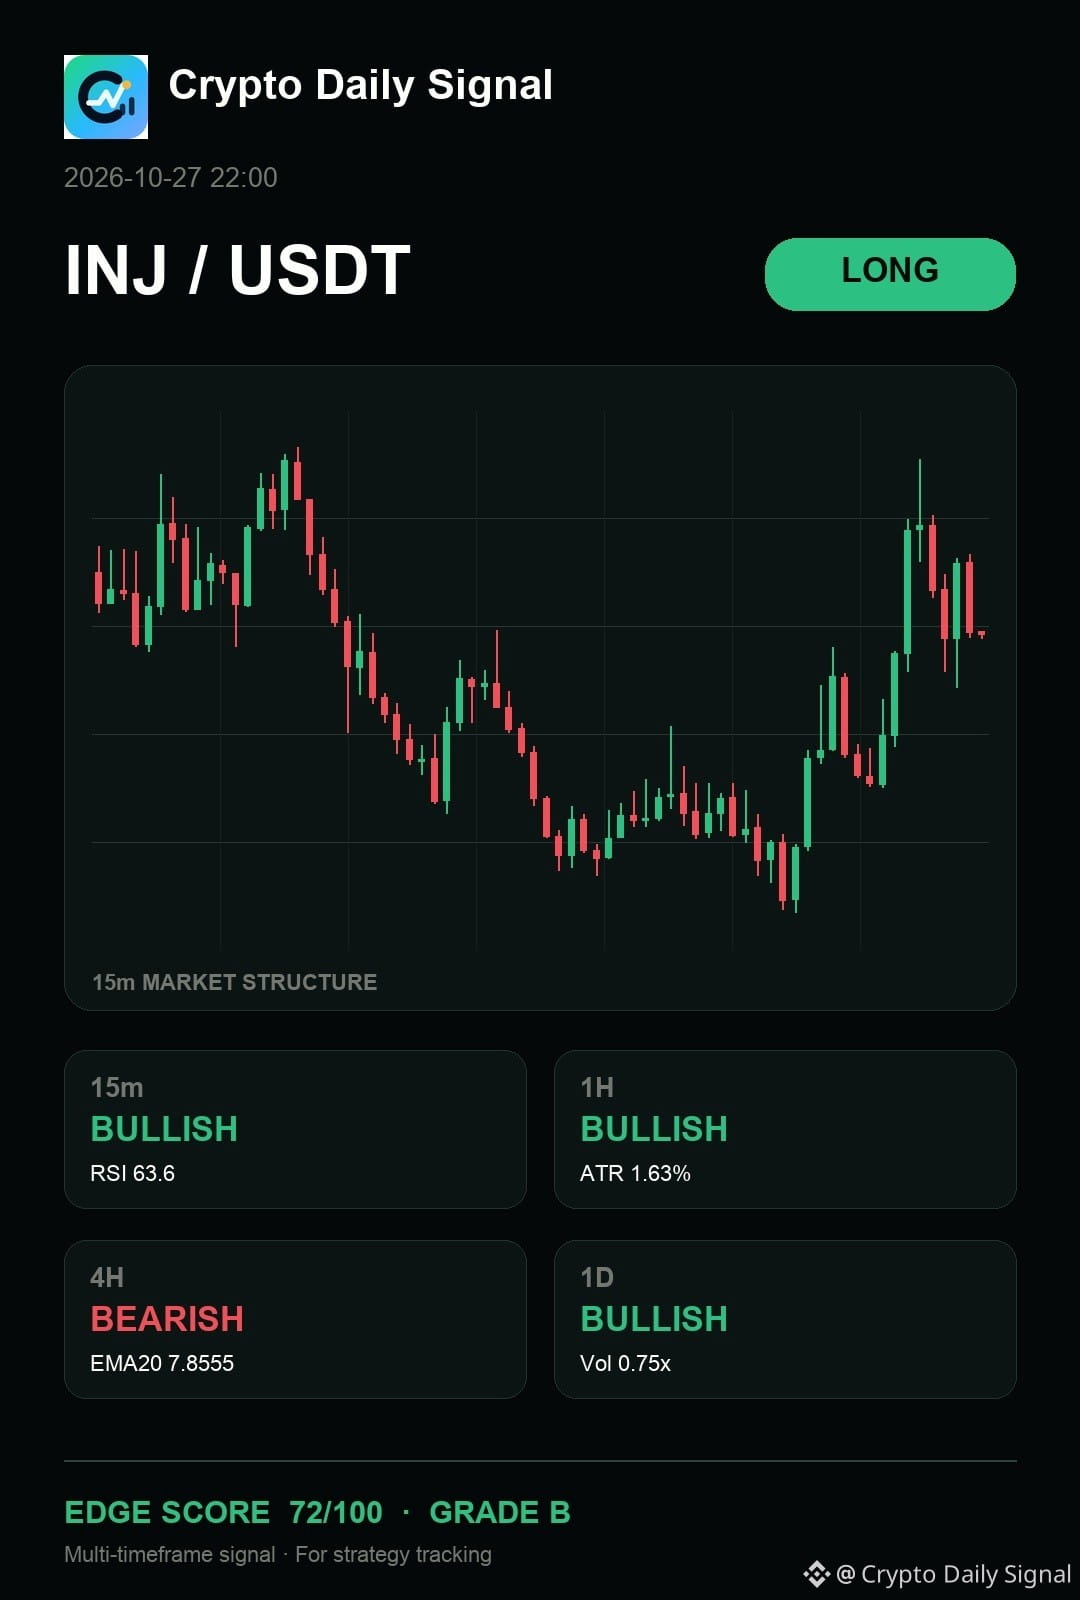
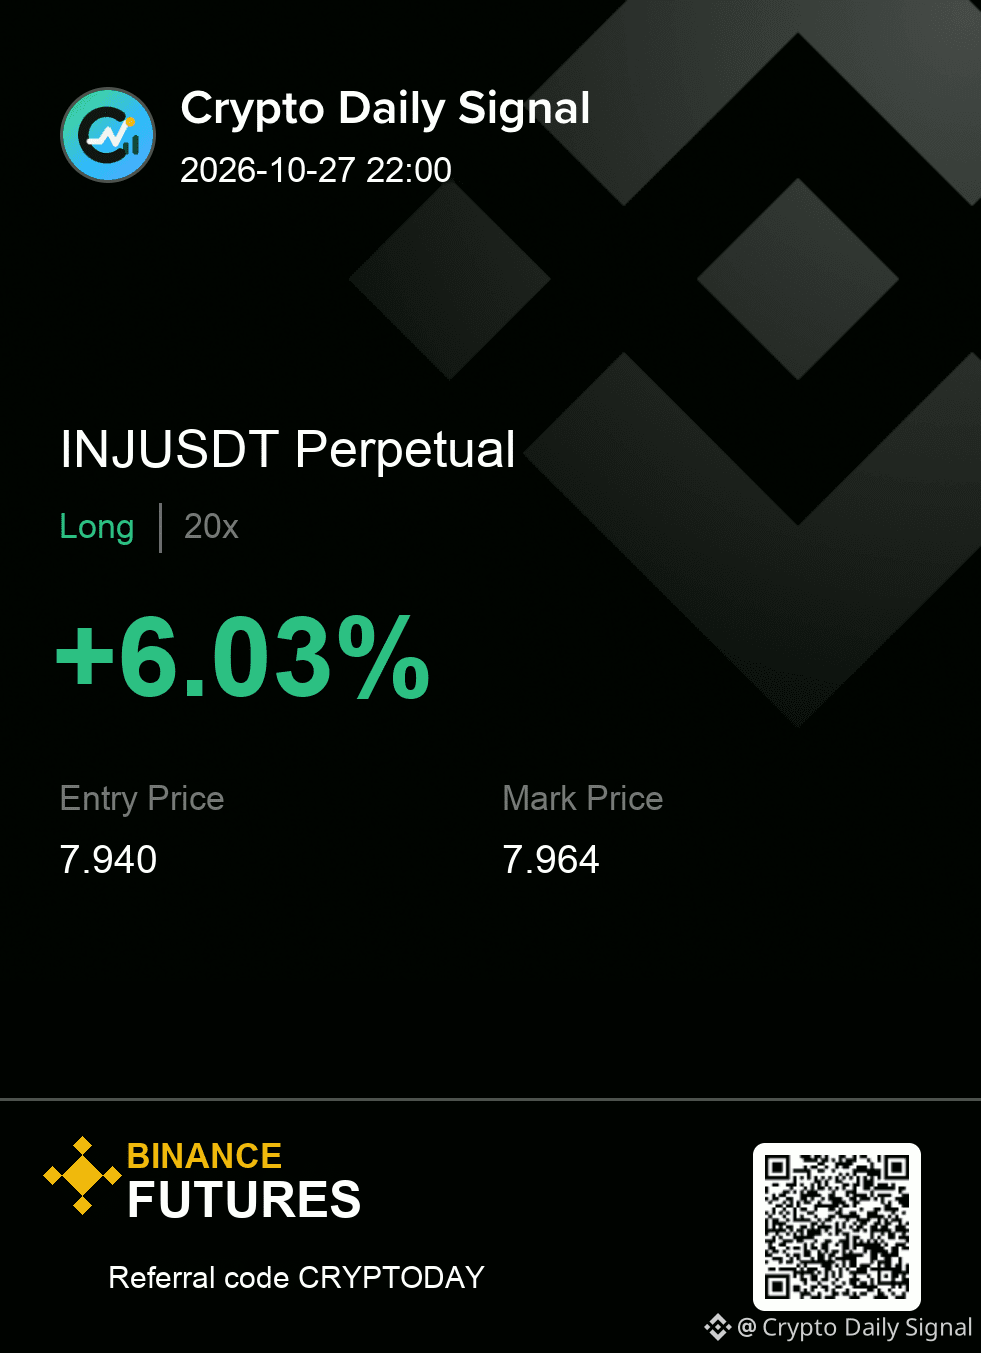
$INJ — man, the part I care about is how it keeps me focused on the upside response given the recent low boundary is holding firm. Short-term momentum is suggesting buyers are gaining ground, even though the longer-term view is leaning down. A strong close above the recent trading range high, accompanied by volume, would make this move much clearer. Anything that breaks that range floor into bearish territory invalidates the bullish setup.
INJUSDT LONG
IN 7.925 - 7.955
OUT 7.846
TP 8.034 · 8.109 · 8.202
Worth tracking from here, or does the range still need more time?
#TradingSignal
{future}(INJUSDT)
$INJ — man, the part I care about is how it keeps me focused on the upside response given the recent low boundary is holding firm. Short-term momentum is suggesting buyers are gaining ground, even though the longer-term view is leaning down. A strong close above the recent trading range high, accompanied by volume, would make this move much clearer. Anything that breaks that range floor into bearish territory invalidates the bullish setup.
INJUSDT LONG
IN 7.925 - 7.955
OUT 7.846
TP 8.034 · 8.109 · 8.202
Worth tracking from here, or does the range still need more time?
#TradingSignal
INJUSDT LONG
IN 7.925 - 7.955
OUT 7.846
TP 8.034 · 8.109 · 8.202
Worth tracking from here, or does the range still need more time?
#TradingSignal
20
Übersetzung ansehen
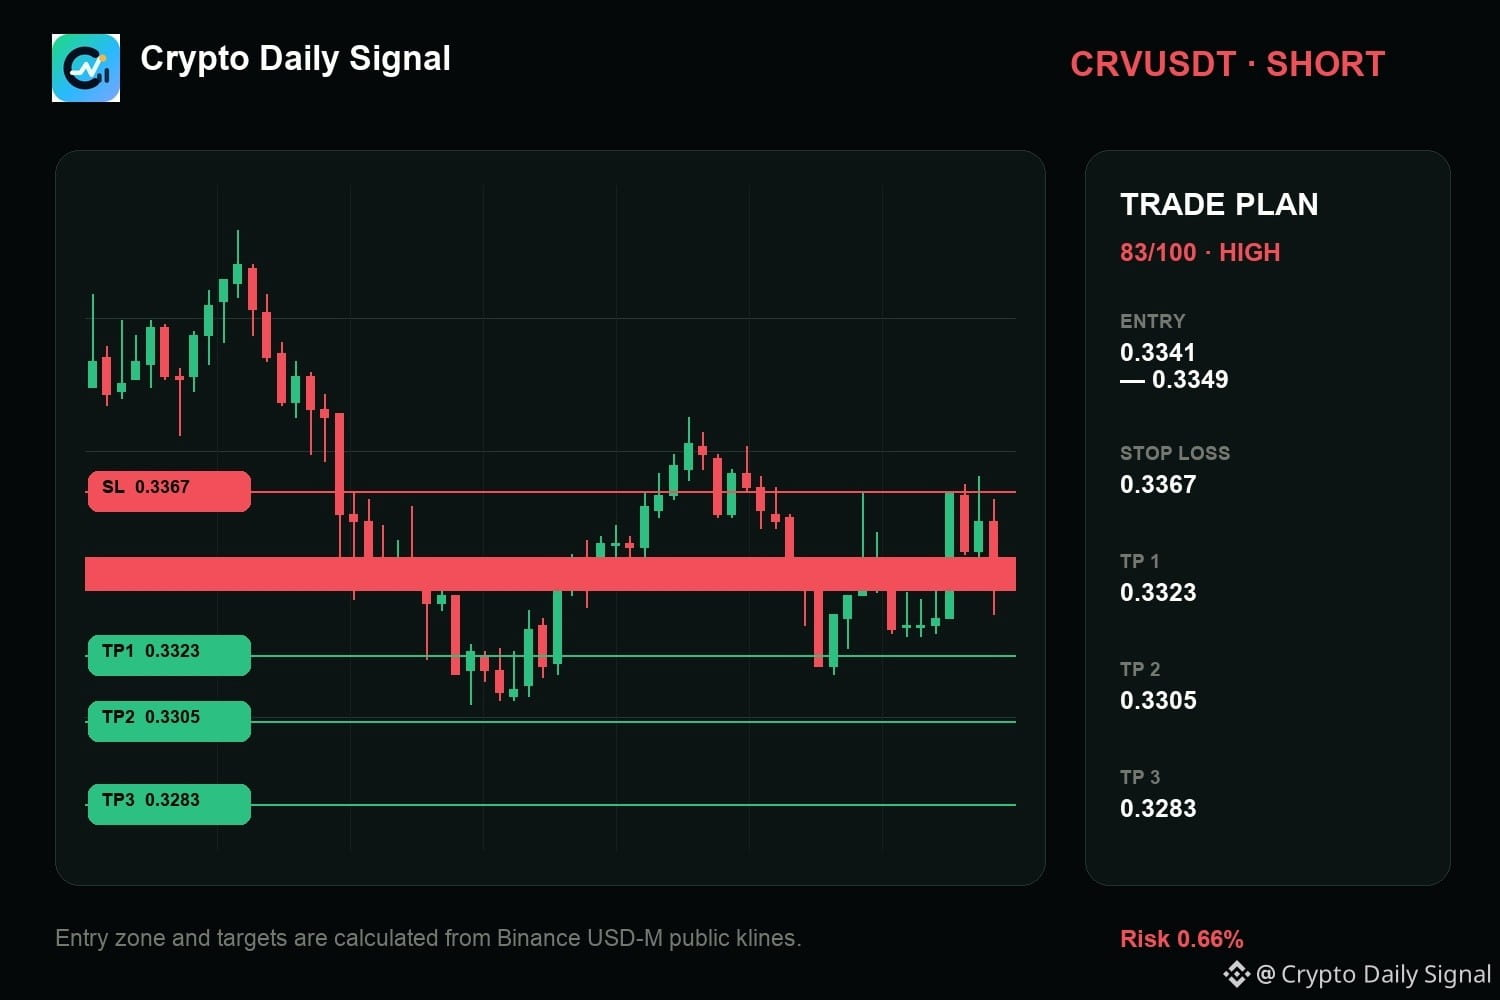
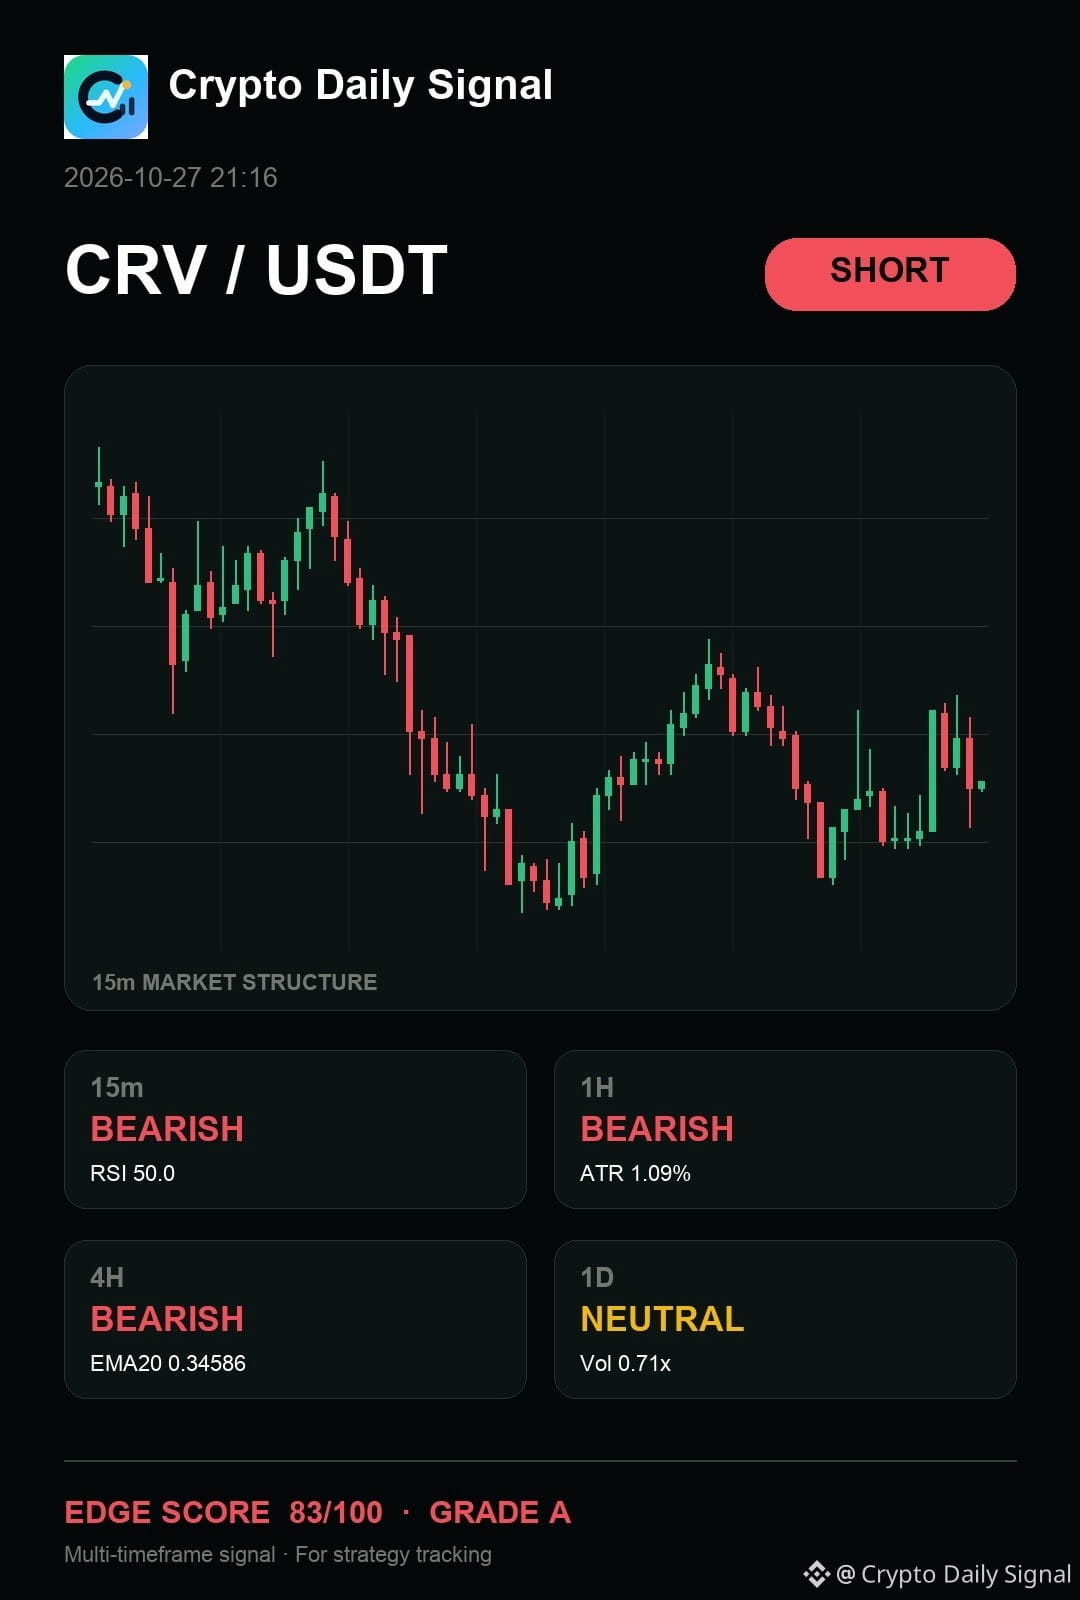
$CRV is a patience trade on the short side. The pattern of lower highs is showing that the selling momentum is currently finding support on the short-term chart. The rejection of the prior high and the low short-term momentum signal a setup for downside continuation. A clean close below the recent low would confirm this shift in favor of sellers.
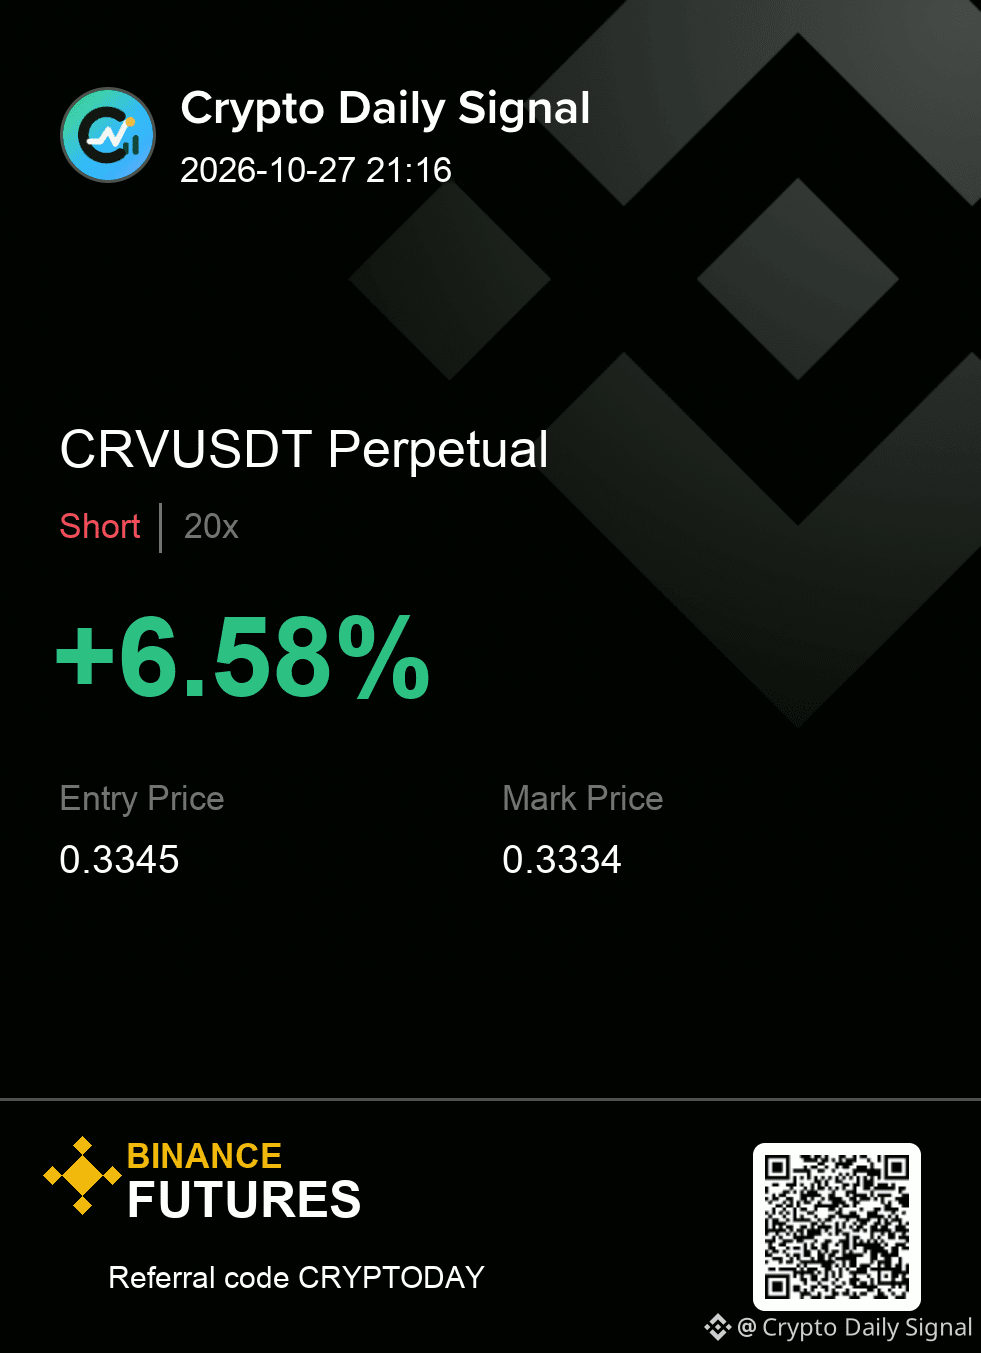
CRVUSDT SHORT
IN 0.3341 - 0.3349
OUT 0.3367
TP 0.3323 · 0.3305 · 0.3283
#TradingSignal
{future}(CRVUSDT)
$CRV is a patience trade on the short side. The pattern of lower highs is showing that the selling momentum is currently finding support on the short-term chart. The rejection of the prior high and the low short-term momentum signal a setup for downside continuation. A clean close below the recent low would confirm this shift in favor of sellers.
CRVUSDT SHORT
IN 0.3341 - 0.3349
OUT 0.3367
TP 0.3323 · 0.3305 · 0.3283
#TradingSignal
CRVUSDT SHORT
IN 0.3341 - 0.3349
OUT 0.3367
TP 0.3323 · 0.3305 · 0.3283
#TradingSignal
6
Übersetzung ansehen
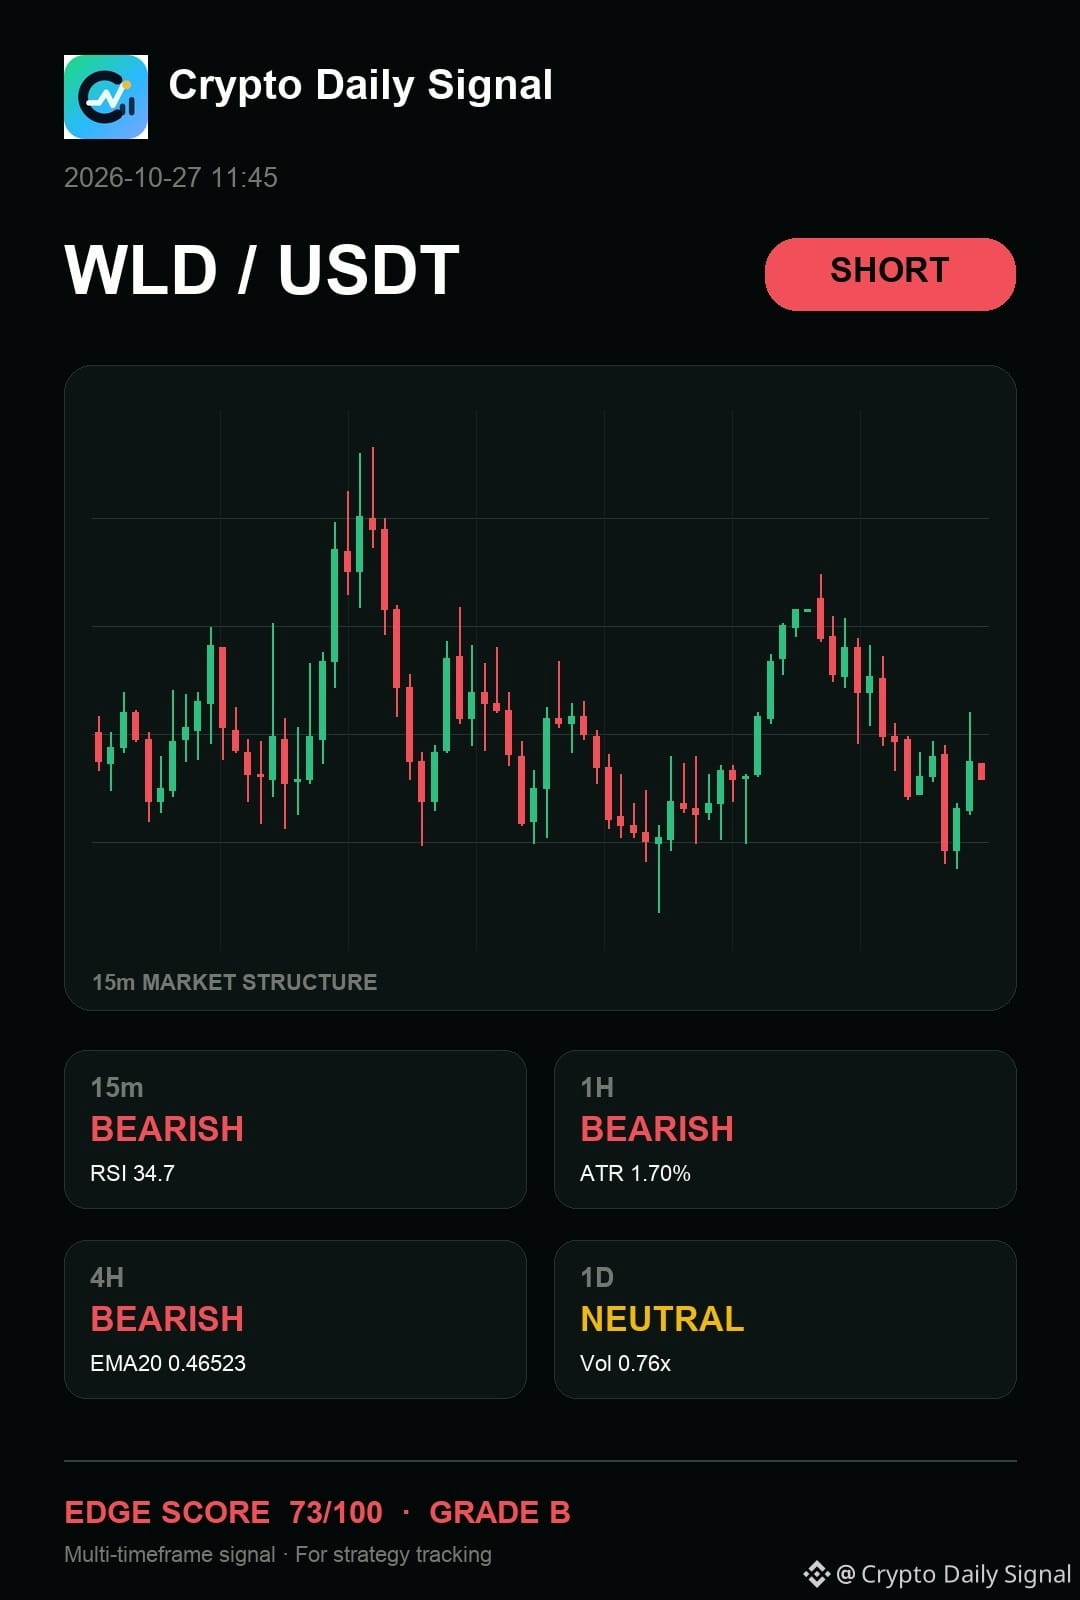
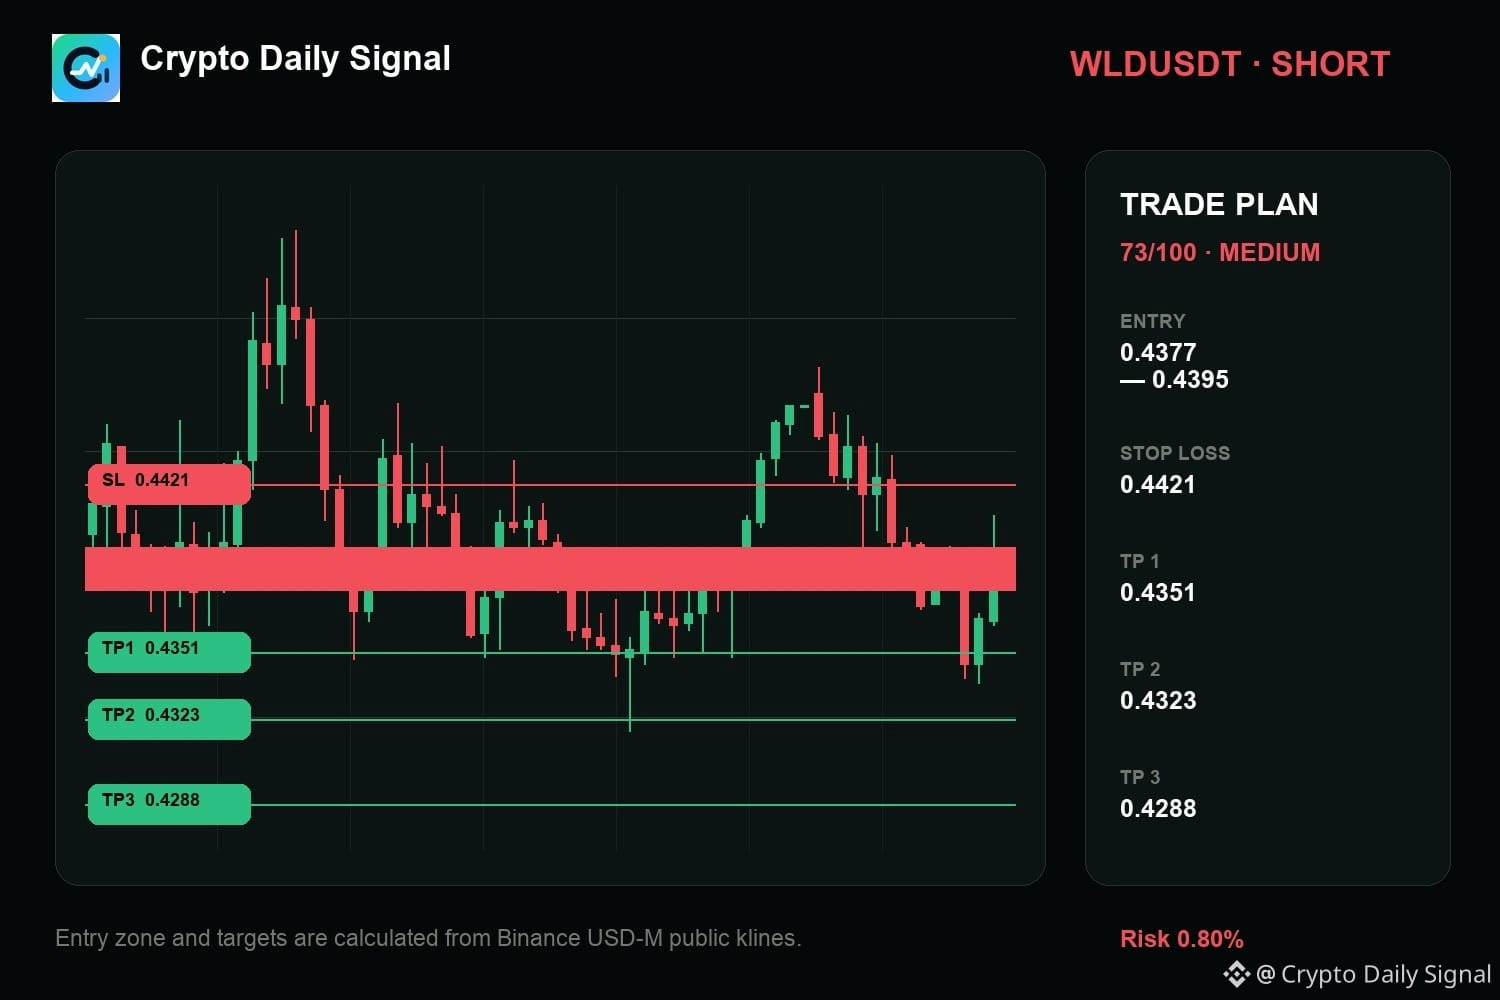
$WLD — honestly, the chart still says it is a patience trade on the short side as the momentum appears to be fading while contained within a falling channel structure. Lower highs on the short-term charts confirm this shift downwards, aligning with the bearish sentiment seen on the four-hour timeframe. A clean break beneath that range floor would give the sell thesis better footing.
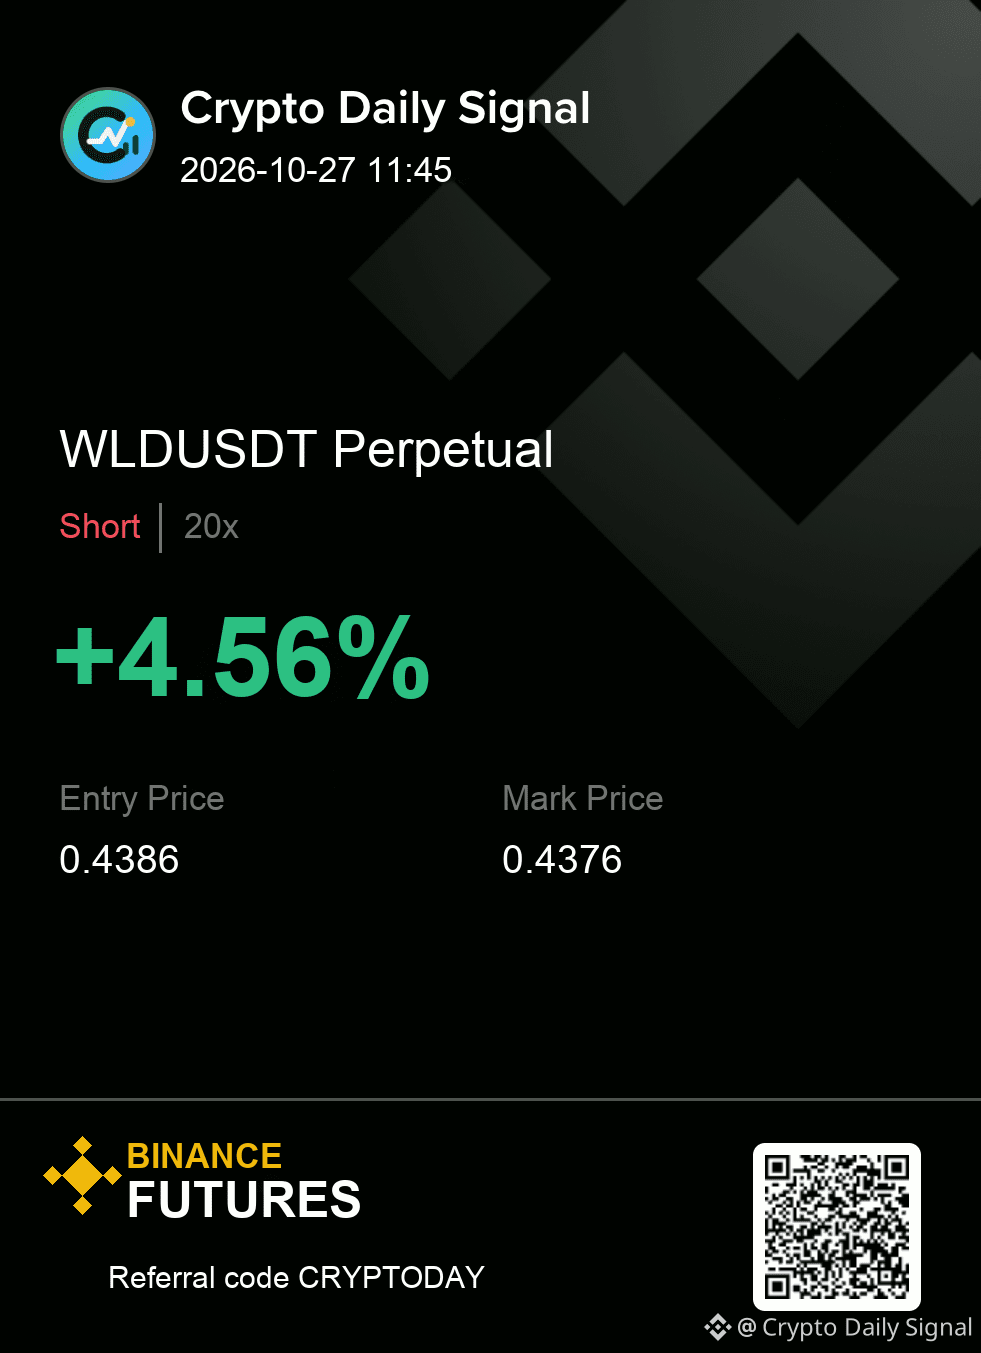
WLDUSDT | SHORT
Entry 0.4377 - 0.4395
Invalidation 0.4421
Targets 0.4351 / 0.4323 / 0.4288
#TradingSignal
{future}(WLDUSDT)
$WLD — honestly, the chart still says it is a patience trade on the short side as the momentum appears to be fading while contained within a falling channel structure. Lower highs on the short-term charts confirm this shift downwards, aligning with the bearish sentiment seen on the four-hour timeframe. A clean break beneath that range floor would give the sell thesis better footing.
WLDUSDT | SHORT
Entry 0.4377 - 0.4395
Invalidation 0.4421
Targets 0.4351 / 0.4323 / 0.4288
#TradingSignal
WLDUSDT | SHORT
Entry 0.4377 - 0.4395
Invalidation 0.4421
Targets 0.4351 / 0.4323 / 0.4288
#TradingSignal
1
43
Übersetzung ansehen
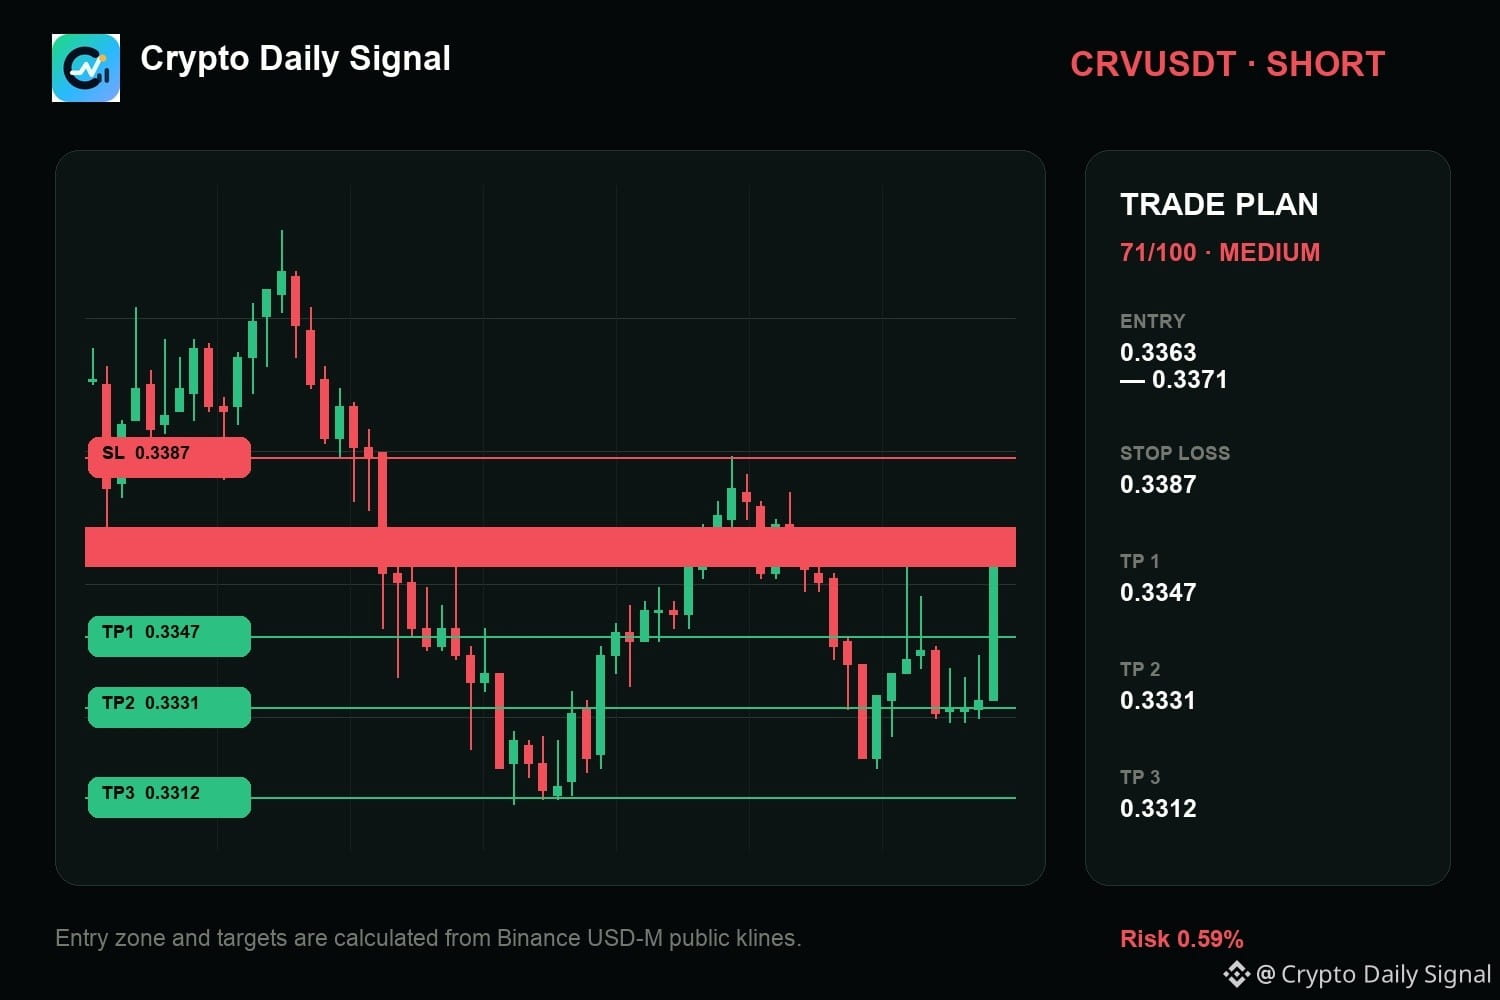
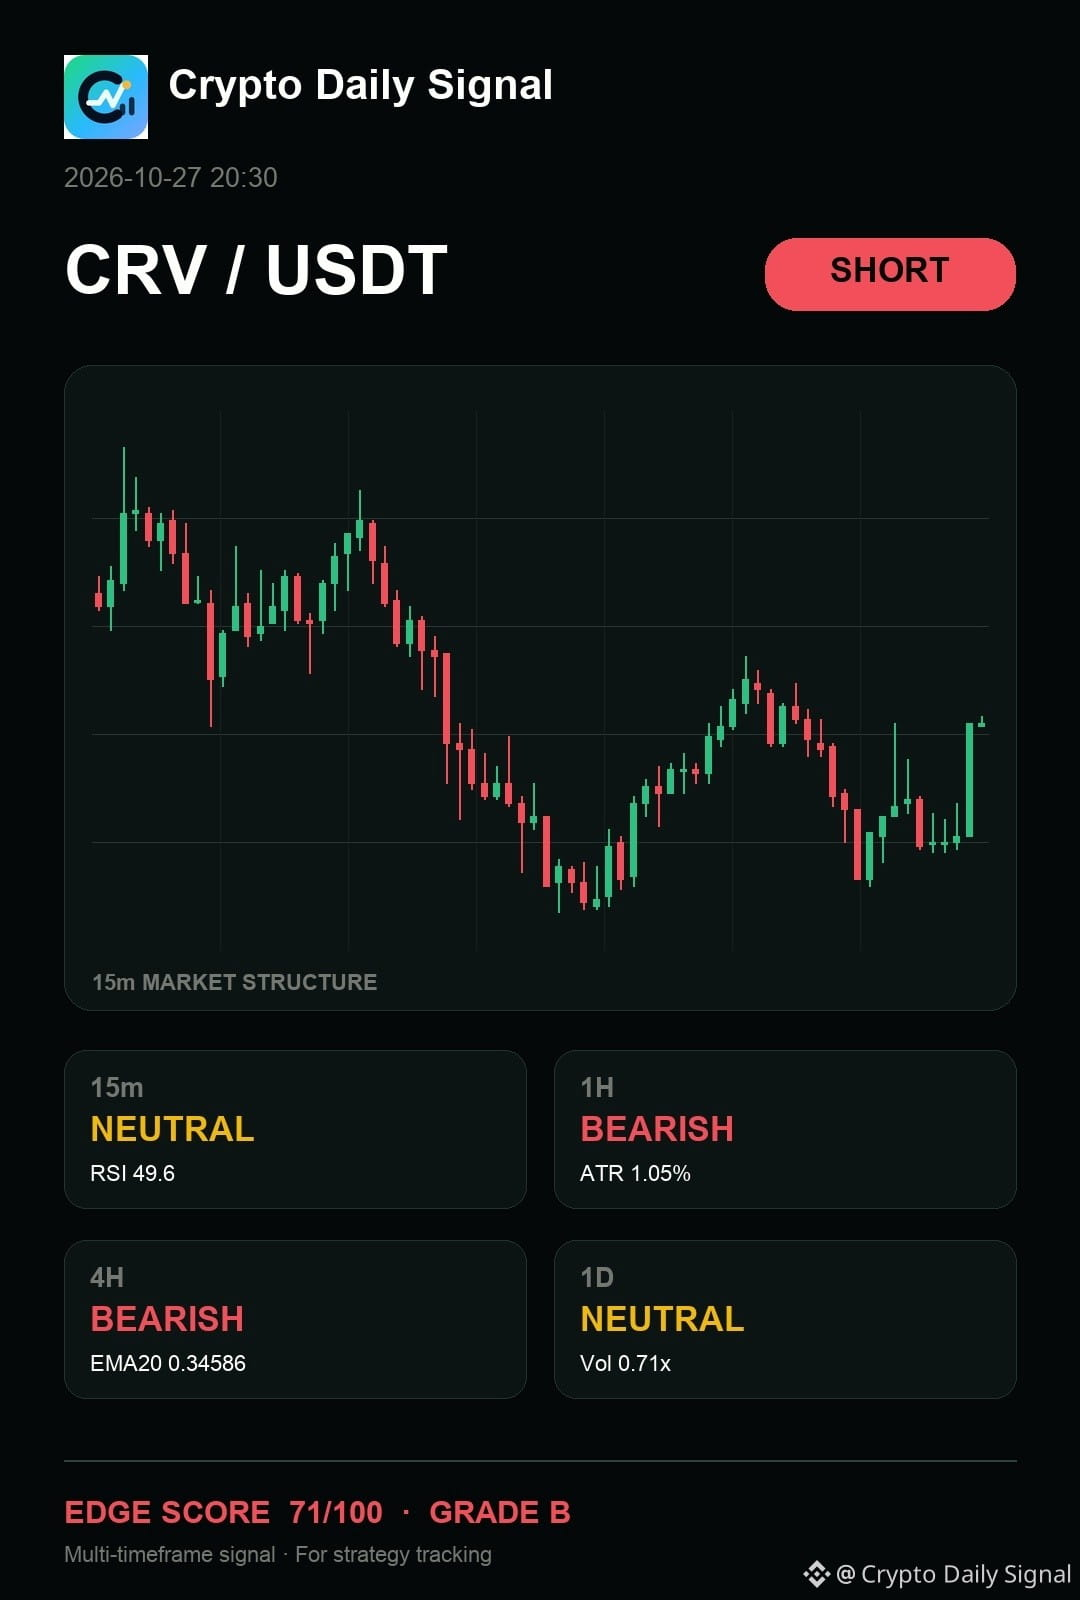
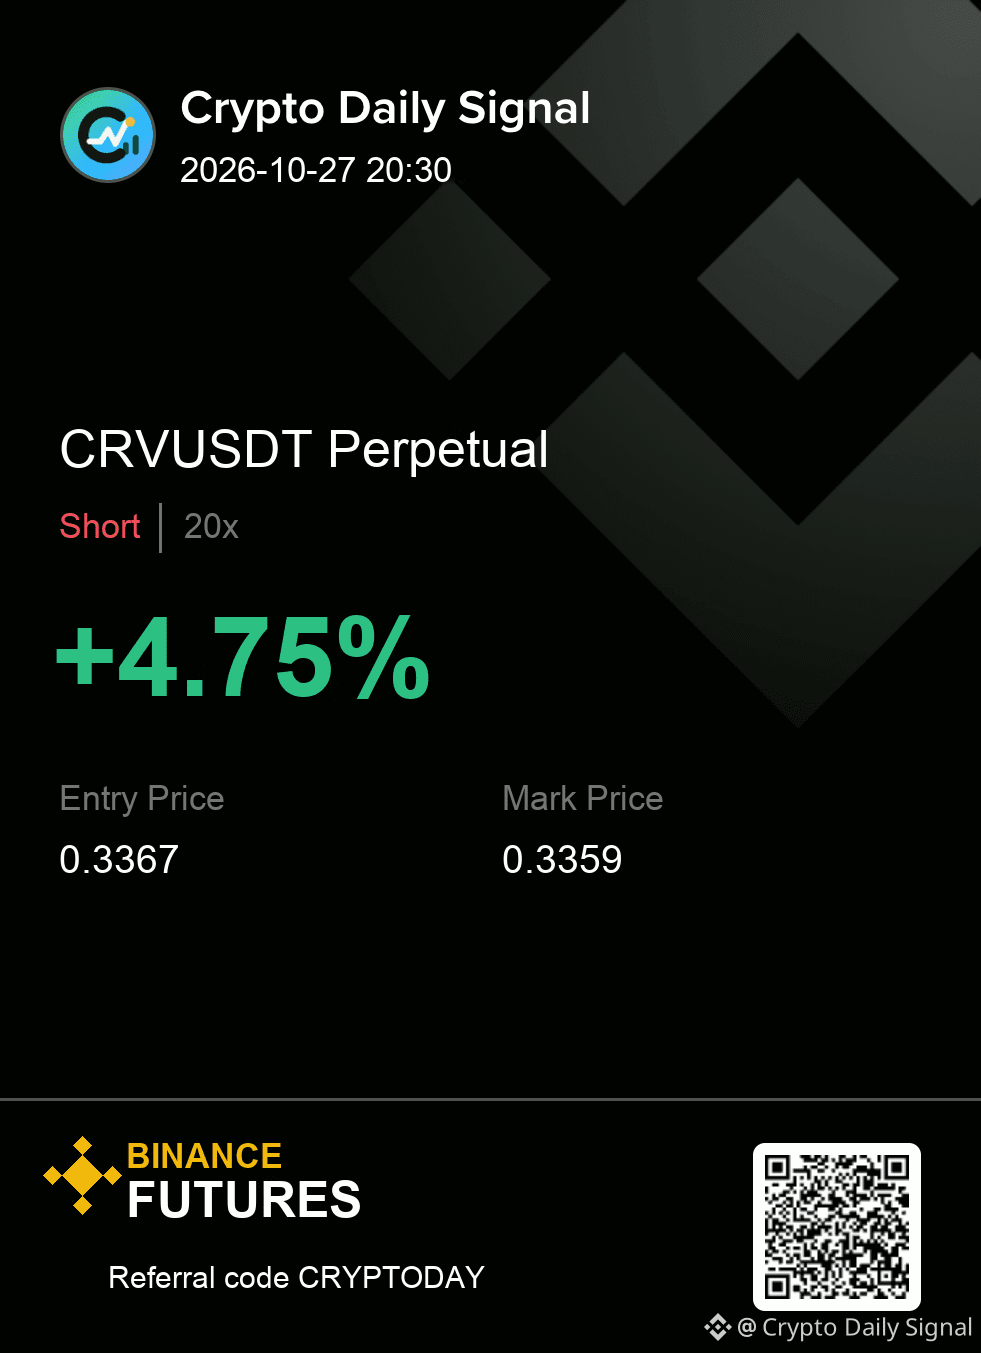
$CRV — honestly, the chart still says it keeps me focused on the downside response as the price stays caged in this tight range. Bearish rejection is showing up at the bottom of this current squeeze. If it prints a convincing close below the floor of this consolidation, that’s the trigger for action. A strong push past the recent peak would just wipe out the short thesis.
The levels matter more than the prediction. Size it accordingly.
CRVUSDT SHORT map
Entry → 0.3363 - 0.3371
SL → 0.3387
TP → 0.3347 · 0.3331 · 0.3312
#TradingSignal
{future}(CRVUSDT)
$CRV — honestly, the chart still says it keeps me focused on the downside response as the price stays caged in this tight range. Bearish rejection is showing up at the bottom of this current squeeze. If it prints a convincing close below the floor of this consolidation, that’s the trigger for action. A strong push past the recent peak would just wipe out the short thesis.
The levels matter more than the prediction. Size it accordingly.
CRVUSDT SHORT map
Entry → 0.3363 - 0.3371
SL → 0.3387
TP → 0.3347 · 0.3331 · 0.3312
#TradingSignal
The levels matter more than the prediction. Size it accordingly.
CRVUSDT SHORT map
Entry → 0.3363 - 0.3371
SL → 0.3387
TP → 0.3347 · 0.3331 · 0.3312
#TradingSignal
3
Übersetzung ansehen
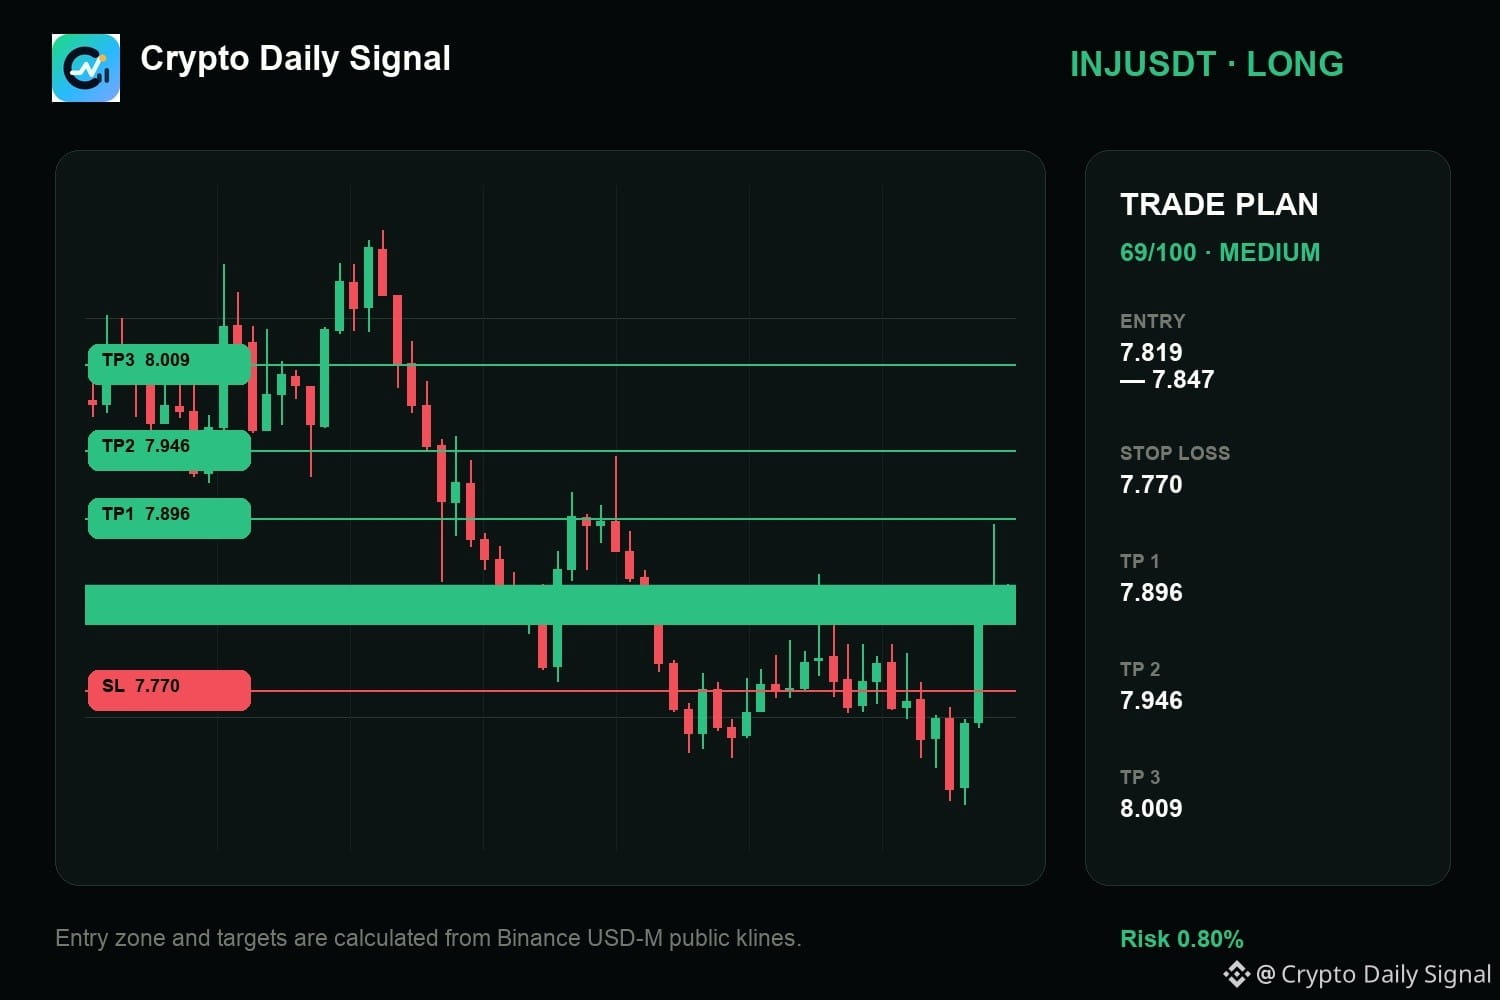
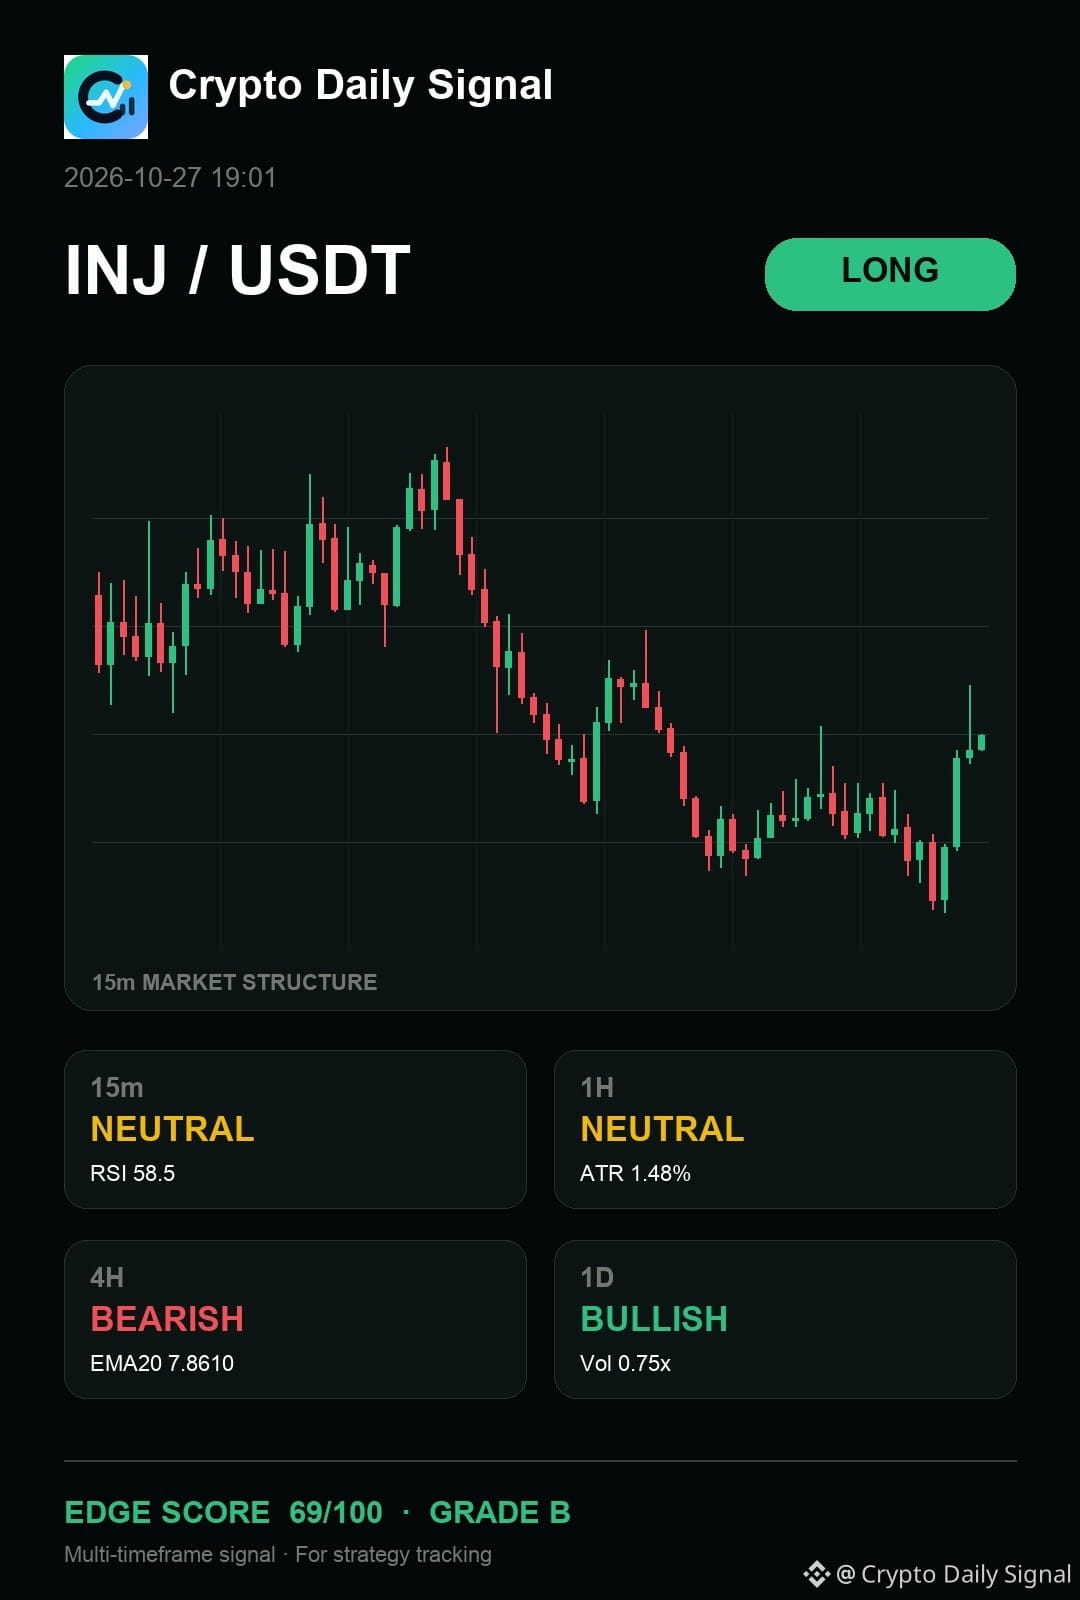
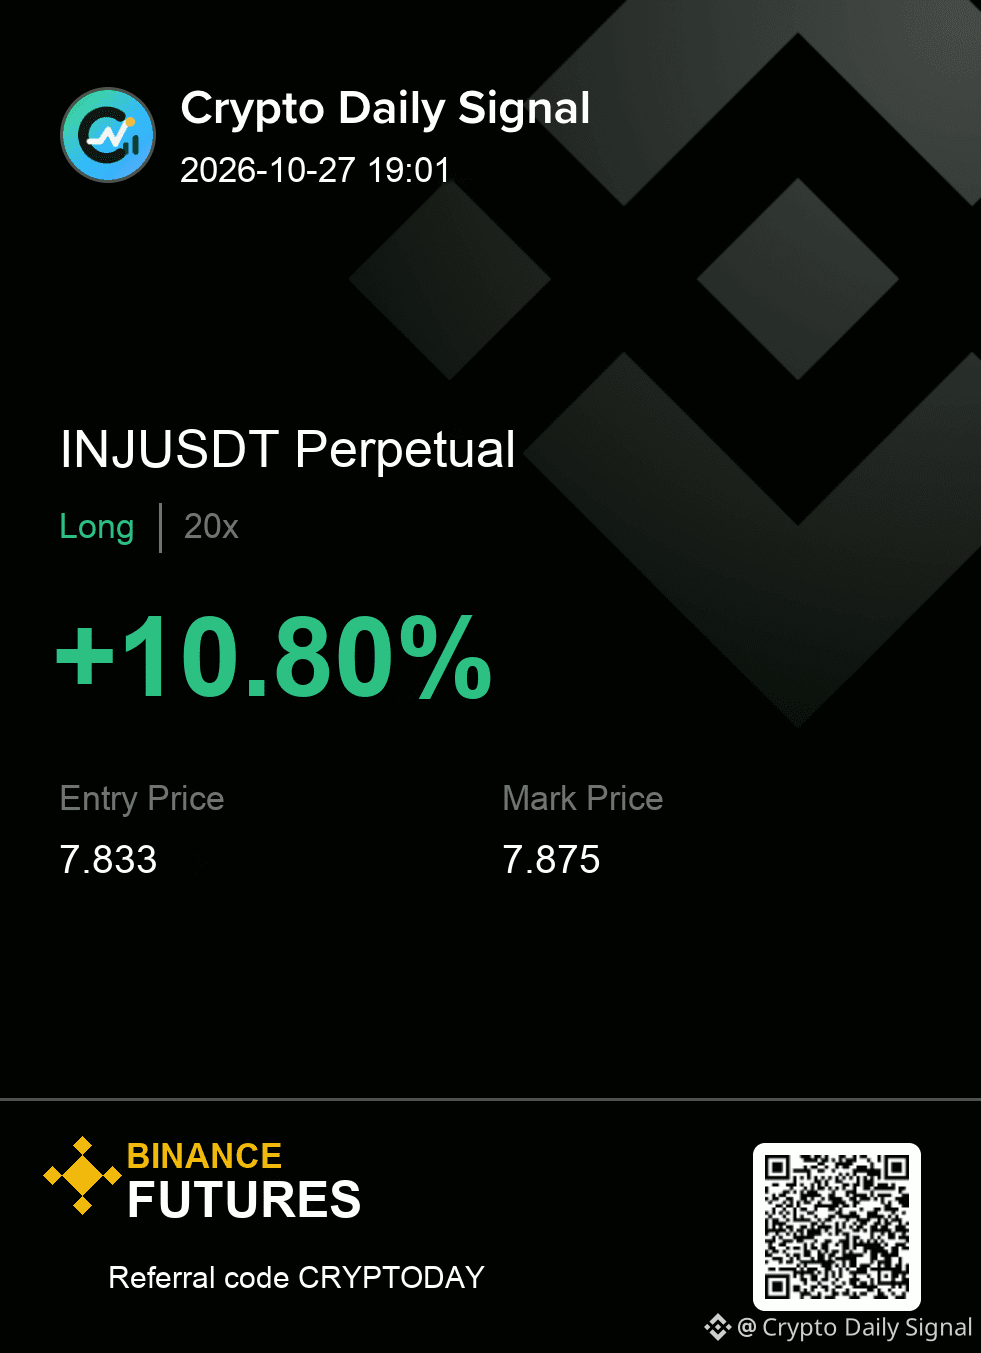
$INJ — the way I see this move, it remains a long watch for me as buying pressure is showing up on smaller timeframes even though the four-hour view has been down. We are seeing candles with lower tails as it tests the bottom of its recent trading space. If it can push cleanly past the recent high within this zone, that would confirm momentum is picking up. A firm close below that established range floor would immediately signal weakness.
Trade Plan — INJUSDT LONG
Entry: 7.819 - 7.847
Stop Loss: 7.770
TP1: 7.896 | TP2: 7.946 | TP3: 8.009
#TradingSignal
{future}(INJUSDT)
$INJ — the way I see this move, it remains a long watch for me as buying pressure is showing up on smaller timeframes even though the four-hour view has been down. We are seeing candles with lower tails as it tests the bottom of its recent trading space. If it can push cleanly past the recent high within this zone, that would confirm momentum is picking up. A firm close below that established range floor would immediately signal weakness.
Trade Plan — INJUSDT LONG
Entry: 7.819 - 7.847
Stop Loss: 7.770
TP1: 7.896 | TP2: 7.946 | TP3: 8.009
#TradingSignal
Trade Plan — INJUSDT LONG
Entry: 7.819 - 7.847
Stop Loss: 7.770
TP1: 7.896 | TP2: 7.946 | TP3: 8.009
#TradingSignal
1
26
·
--
Übersetzung ansehen
🔥 TAG showing strong bullish pressure with 66.2 combined score.
This is a trading setup based on validated signals, not a guaranteed result.
Entry: 0.0007137 | SL: 0.00069403 | TP1: 0.00074321 | TP2: 0.00076288
Volume spikes confirm momentum. Price action shows steady gains.
Will TAG hit TP2?
$TAG #TradingSignal #CryptoAnalysis
This is a trading setup based on validated signals, not a guaranteed result.
Entry: 0.0007137 | SL: 0.00069403 | TP1: 0.00074321 | TP2: 0.00076288
Volume spikes confirm momentum. Price action shows steady gains.
Will TAG hit TP2?
$TAG #TradingSignal #CryptoAnalysis

1
1
Übersetzung ansehen
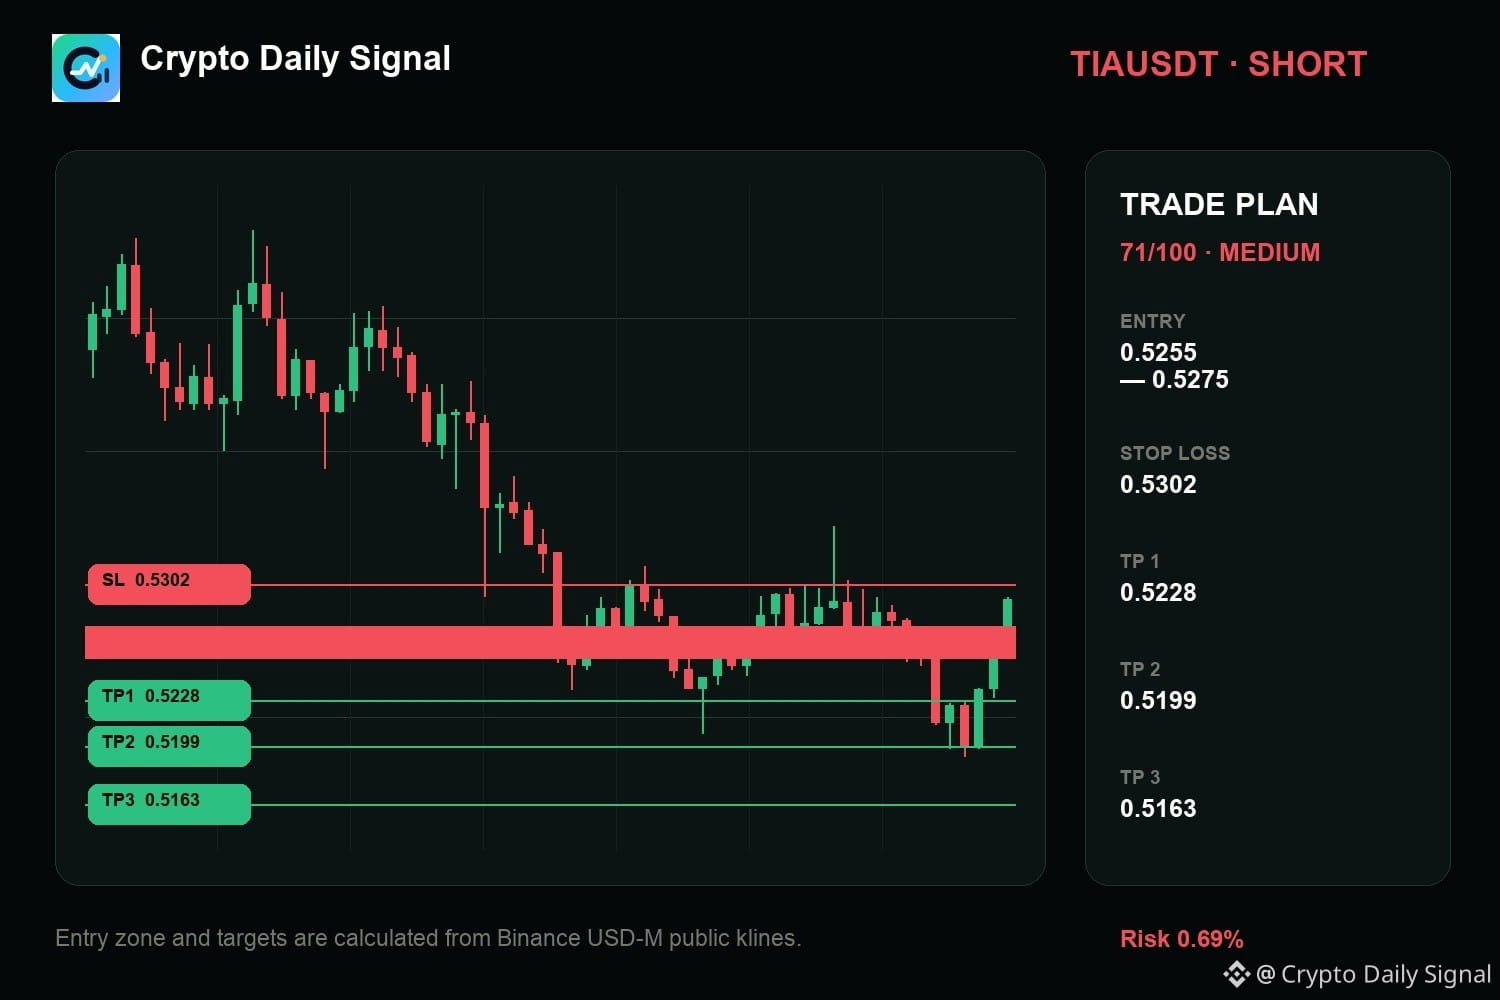
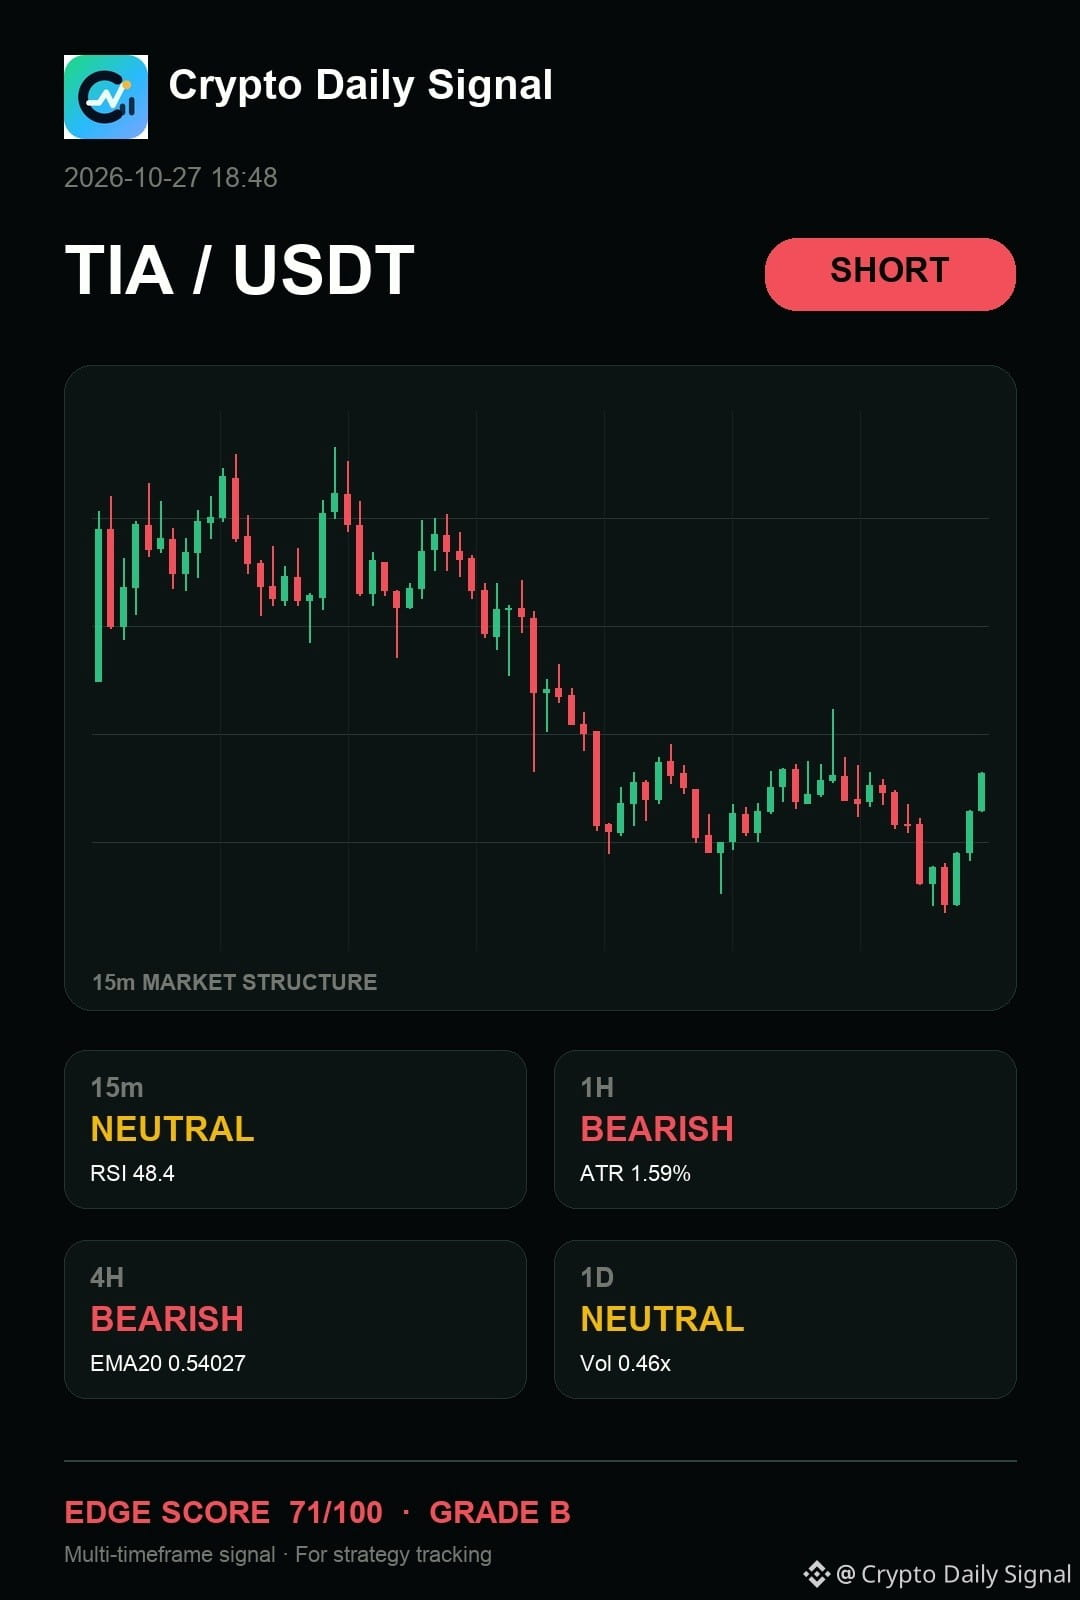
$TIA — for me, the core read is that it is one rejection away from a cleaner short as it sits right at the low end of this recent consolidation. The pattern shows clear lower highs forming, matching up with the descending channel shape on the shorter timeframes. A sharp drop below that range floor on a bearish bar would confirm the downside move.
The levels matter more than the prediction. Size it accordingly.
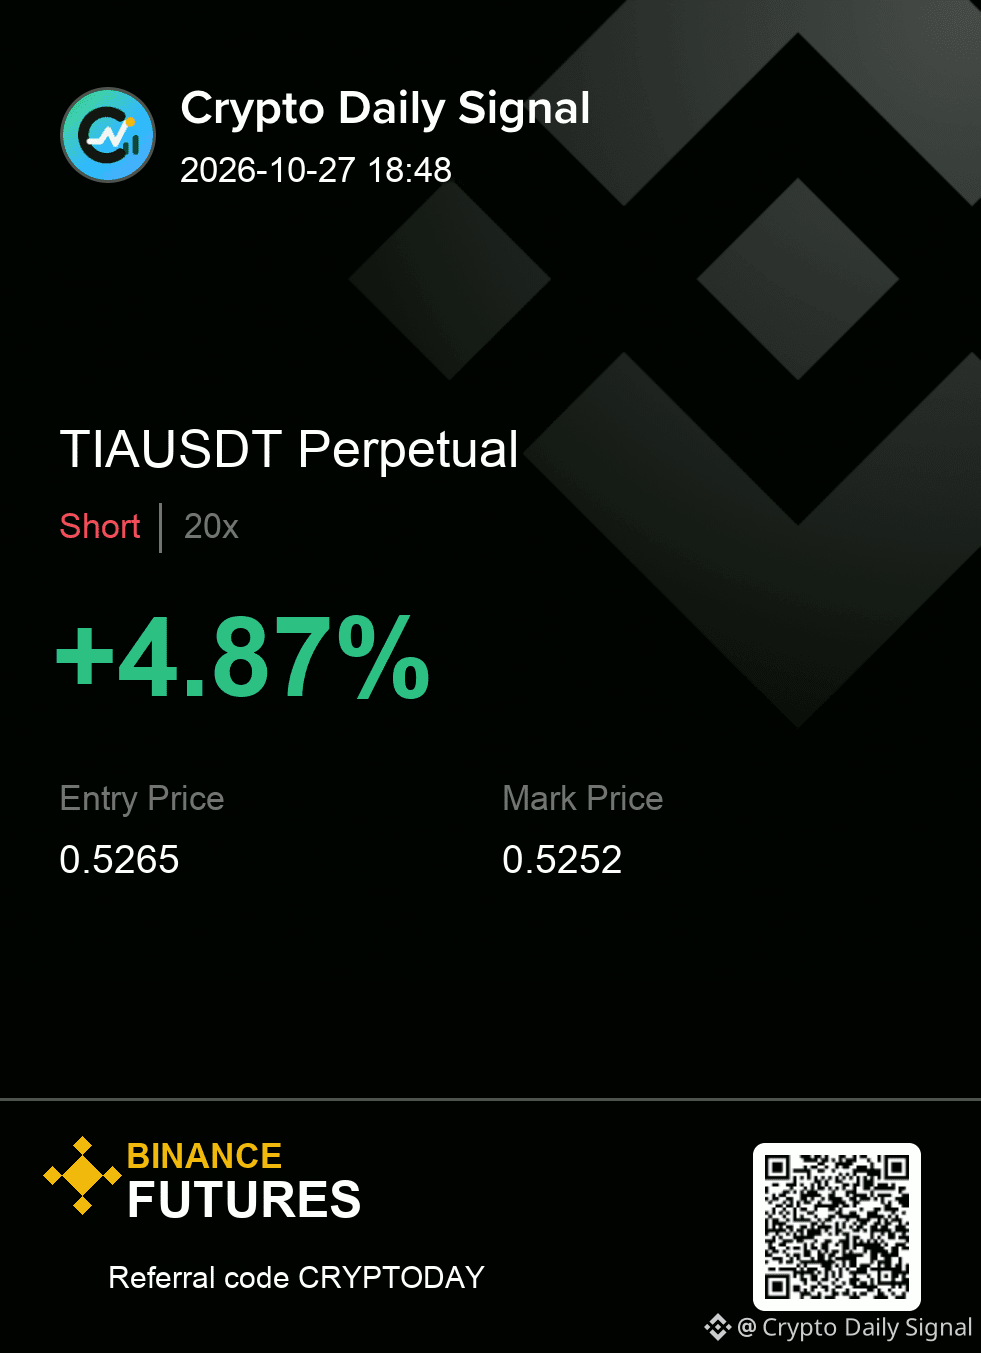
SHORT plan for TIAUSDT
0.5255 - 0.5275 entry | 0.5302 stop
0.5228 → 0.5199 → 0.5163
#TradingSignal
{future}(TIAUSDT)
$TIA — for me, the core read is that it is one rejection away from a cleaner short as it sits right at the low end of this recent consolidation. The pattern shows clear lower highs forming, matching up with the descending channel shape on the shorter timeframes. A sharp drop below that range floor on a bearish bar would confirm the downside move.
The levels matter more than the prediction. Size it accordingly.
SHORT plan for TIAUSDT
0.5255 - 0.5275 entry | 0.5302 stop
0.5228 → 0.5199 → 0.5163
#TradingSignal
The levels matter more than the prediction. Size it accordingly.
SHORT plan for TIAUSDT
0.5255 - 0.5275 entry | 0.5302 stop
0.5228 → 0.5199 → 0.5163
#TradingSignal
1
20
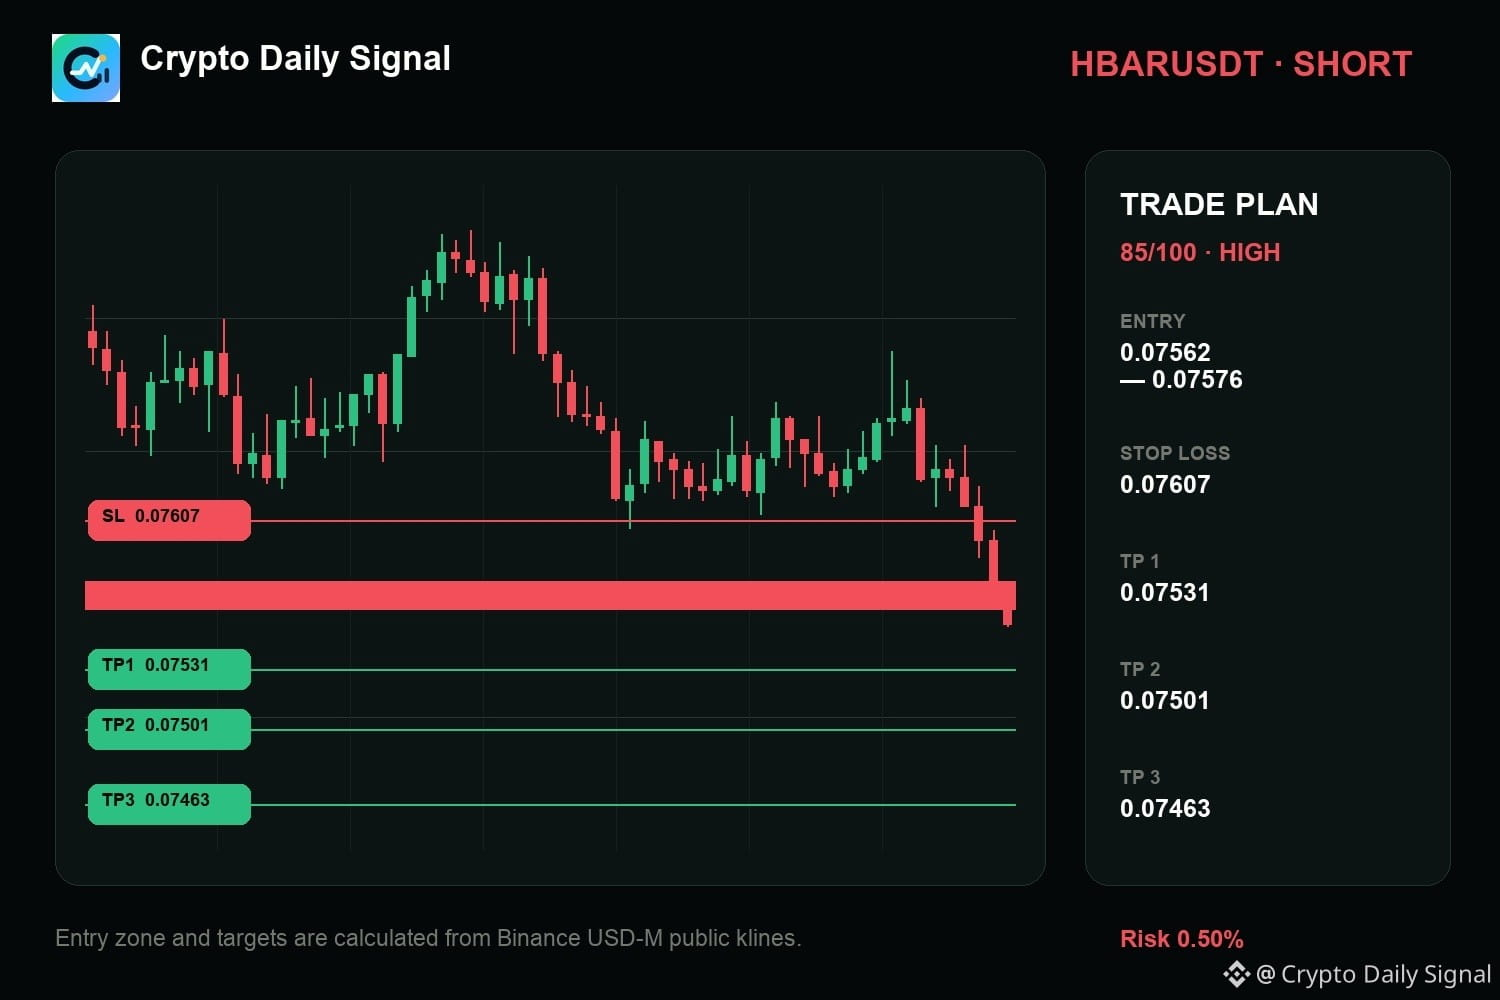
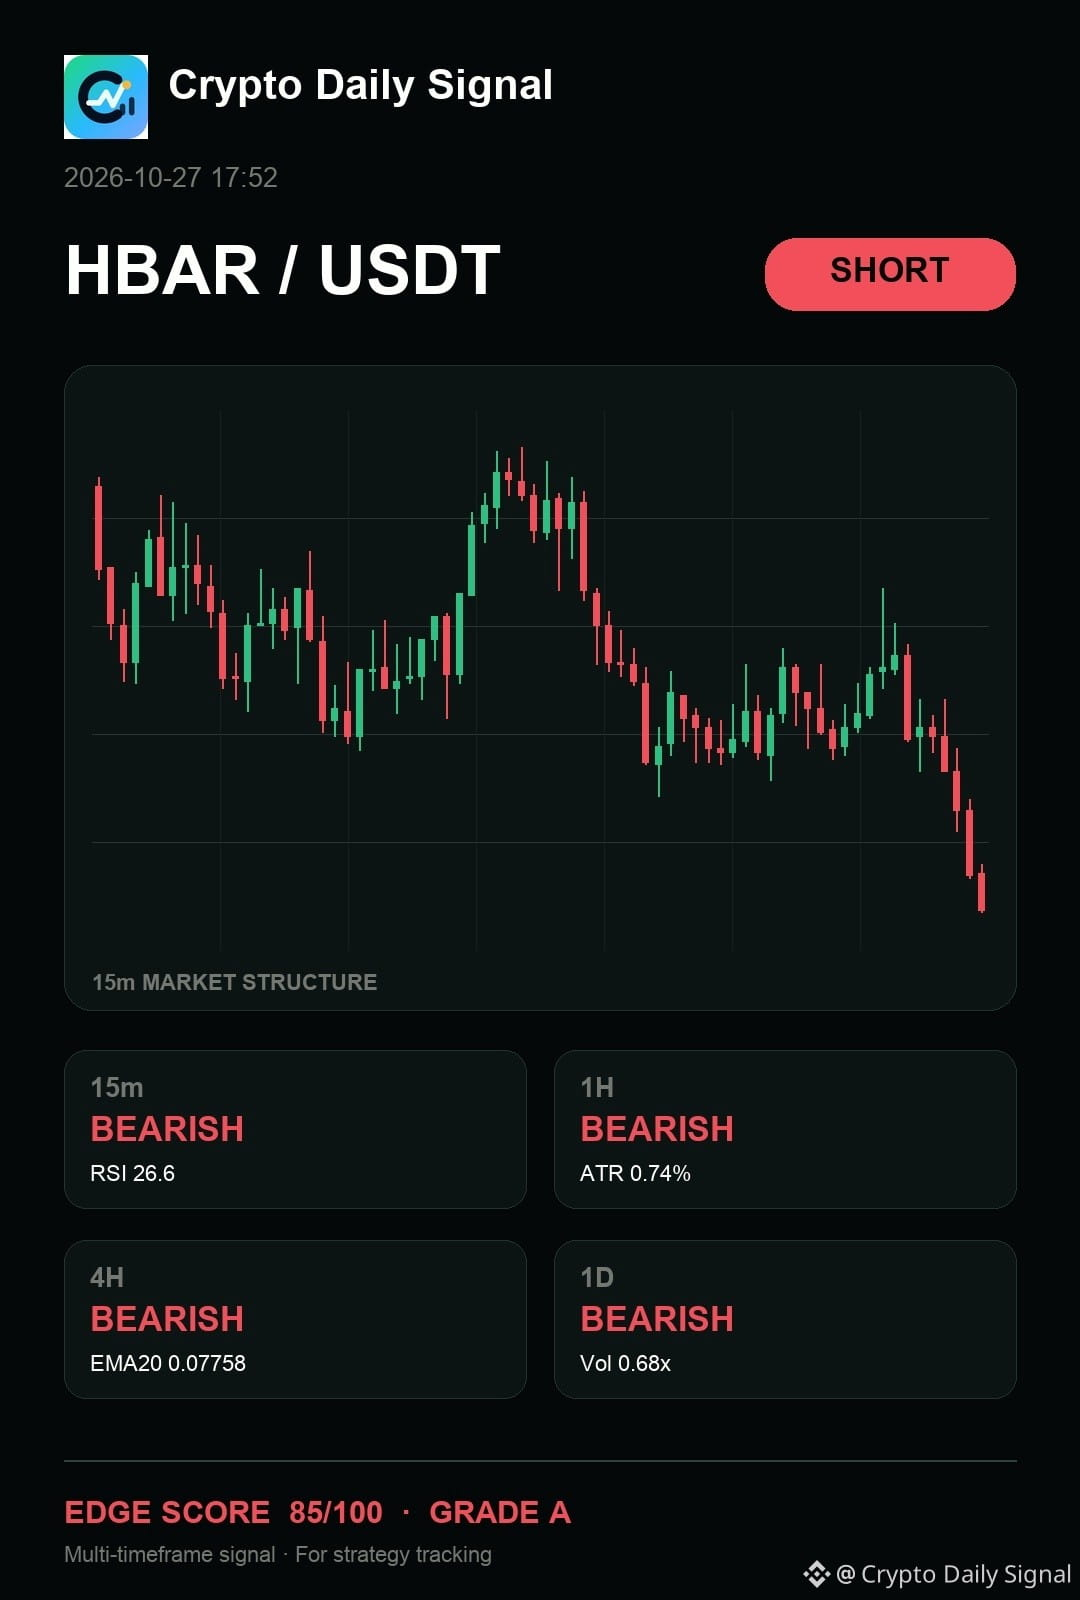
$HBAR — schau, meine Einschätzung ist einfach: Ich habe es auf der Verkaufsseite im Blick, nachdem ein Ausbruch nach einem Anstieg gescheitert ist. Der Preis findet Unterstützung am unteren Rand der Spanne, und die jüngste Kerzenbewegung tendiert insgesamt bärisch. Wenn er sich mit einer roten Kerze unterhalb dieses Spannenbodens festsetzen kann, bleibt der Bias bestehen; eine starke Bewegung nach oben würde diese Sichtweise infrage stellen.
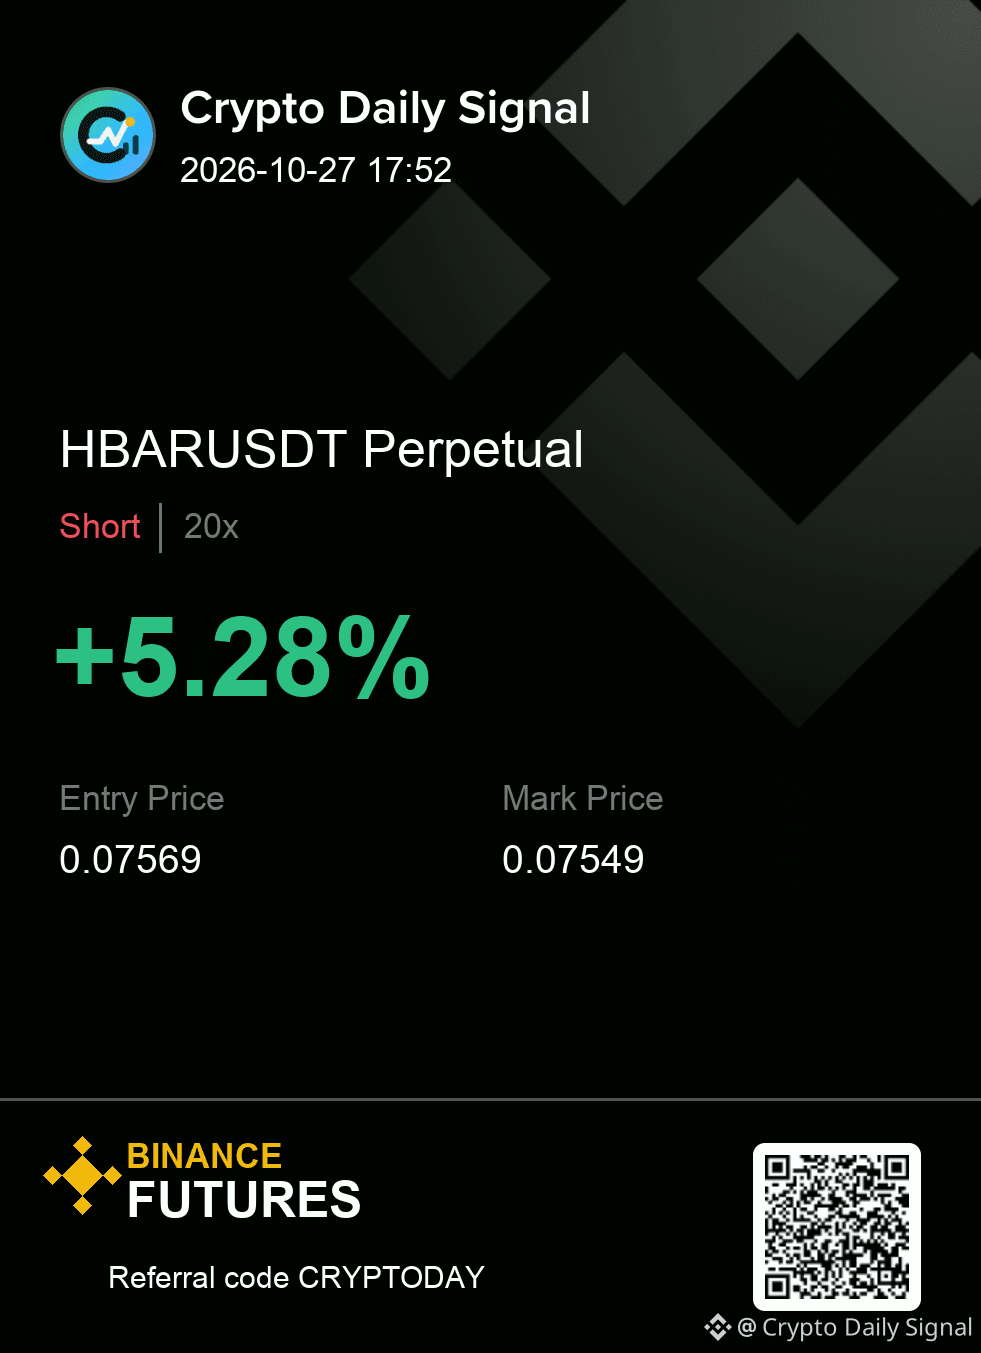
HBARUSDT SHORT-Map
Einstieg → 0.07562 - 0.07576
SL → 0.07607
TP → 0.07531 · 0.07501 · 0.07463
#TradingSignal
{future}(HBARUSDT)
$HBAR — schau, meine Einschätzung ist einfach: Ich habe es auf der Verkaufsseite im Blick, nachdem ein Ausbruch nach einem Anstieg gescheitert ist. Der Preis findet Unterstützung am unteren Rand der Spanne, und die jüngste Kerzenbewegung tendiert insgesamt bärisch. Wenn er sich mit einer roten Kerze unterhalb dieses Spannenbodens festsetzen kann, bleibt der Bias bestehen; eine starke Bewegung nach oben würde diese Sichtweise infrage stellen.
HBARUSDT SHORT-Map
Einstieg → 0.07562 - 0.07576
SL → 0.07607
TP → 0.07531 · 0.07501 · 0.07463
#TradingSignal
HBARUSDT SHORT-Map
Einstieg → 0.07562 - 0.07576
SL → 0.07607
TP → 0.07531 · 0.07501 · 0.07463
#TradingSignal
1
16
Übersetzung ansehen
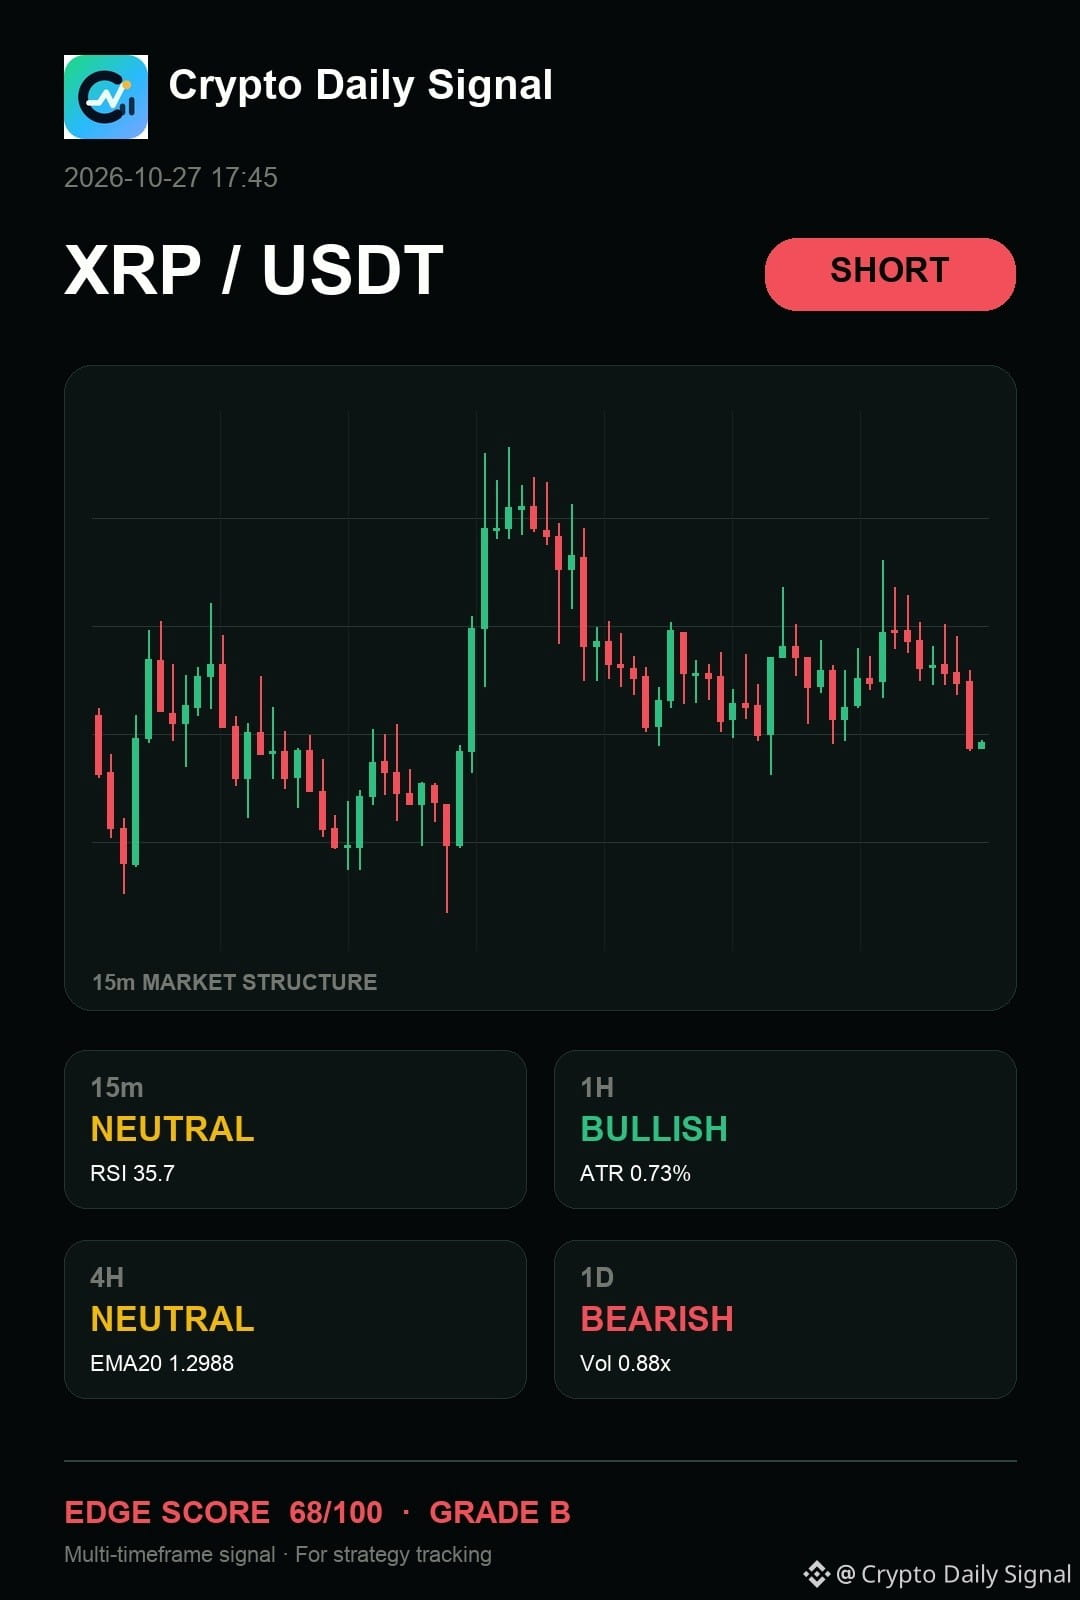
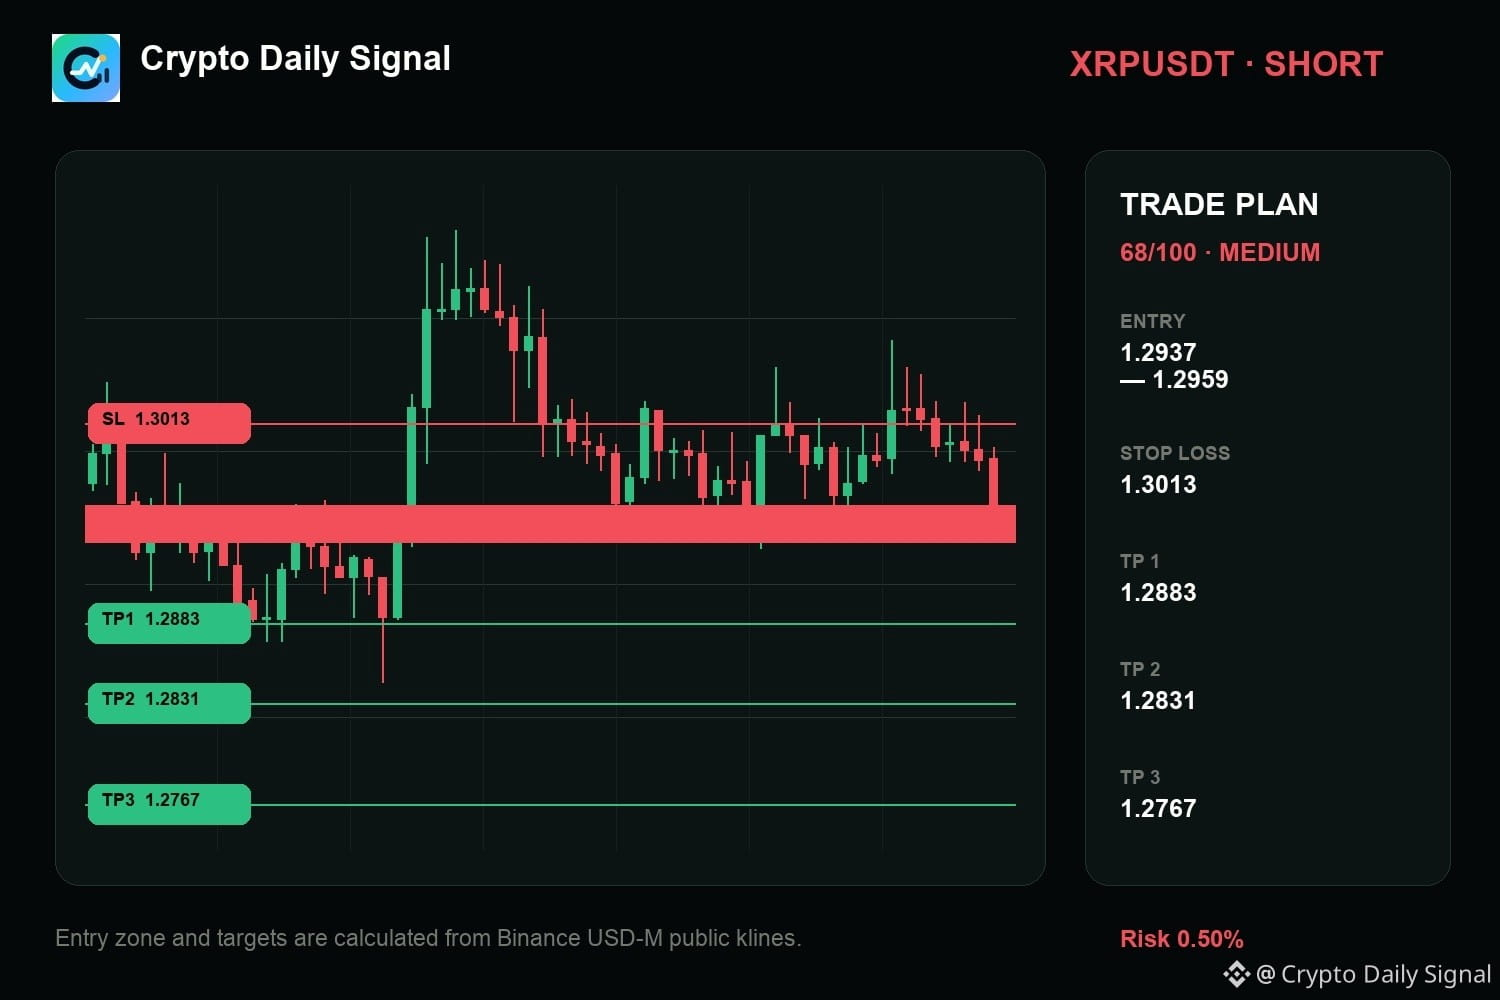
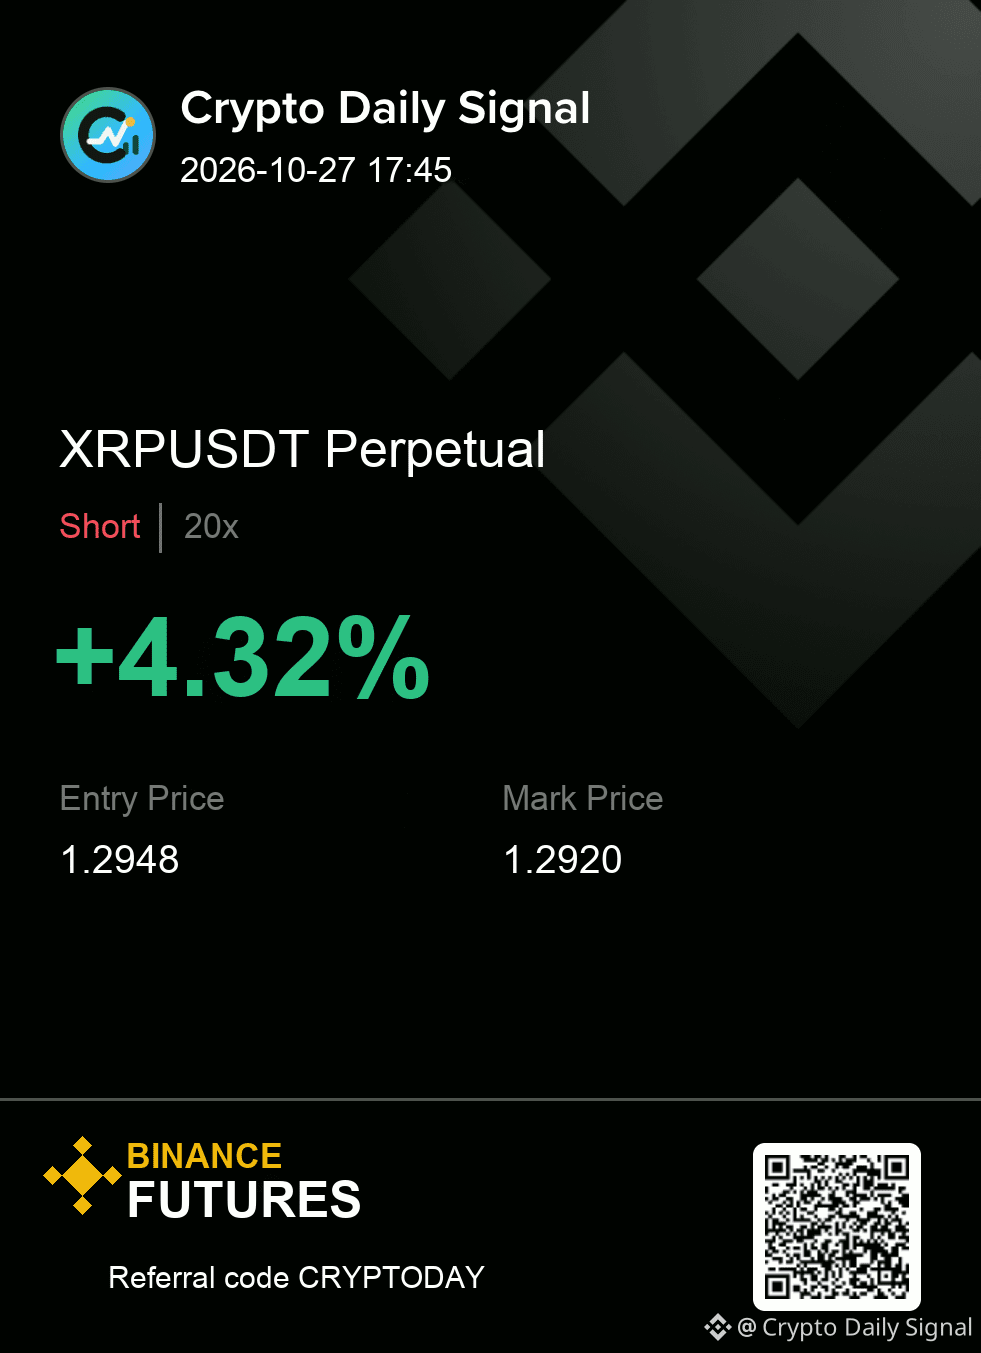
$XRP requires patience before the short is actionable as the current action is boxed within a descending channel. We see repeated rejections off upper levels, and the short-term structure is showing lower highs. For this downside view to solidify, we need a decisive drop below that range bottom, though a strong close above the recent peak would immediately call the idea off.
Trade Plan — XRPUSDT SHORT
Entry: 1.2937 - 1.2959
Stop Loss: 1.3013
TP1: 1.2883 | TP2: 1.2831 | TP3: 1.2767
#TradingSignal
{future}(XRPUSDT)
$XRP requires patience before the short is actionable as the current action is boxed within a descending channel. We see repeated rejections off upper levels, and the short-term structure is showing lower highs. For this downside view to solidify, we need a decisive drop below that range bottom, though a strong close above the recent peak would immediately call the idea off.
Trade Plan — XRPUSDT SHORT
Entry: 1.2937 - 1.2959
Stop Loss: 1.3013
TP1: 1.2883 | TP2: 1.2831 | TP3: 1.2767
#TradingSignal
Trade Plan — XRPUSDT SHORT
Entry: 1.2937 - 1.2959
Stop Loss: 1.3013
TP1: 1.2883 | TP2: 1.2831 | TP3: 1.2767
#TradingSignal
1
14
·
--
Übersetzung ansehen
🔥 V4 validated short setup on JCTUSDT.
BIAS: SHORT | Combined Score: 65.05
Entry: 0.007285 | SL: 0.007417 | TP1: 0.007087 | TP2: 0.006955
24h price +27.73% | Volume spikes 5m+301% | Price 5m -2.8%
A high-momentum reversal play.
Will price respect the bearish pressure?
$JCT #TradingSignal #CryptoAnalysis
BIAS: SHORT | Combined Score: 65.05
Entry: 0.007285 | SL: 0.007417 | TP1: 0.007087 | TP2: 0.006955
24h price +27.73% | Volume spikes 5m+301% | Price 5m -2.8%
A high-momentum reversal play.
Will price respect the bearish pressure?
$JCT #TradingSignal #CryptoAnalysis

1
9
Übersetzung ansehen
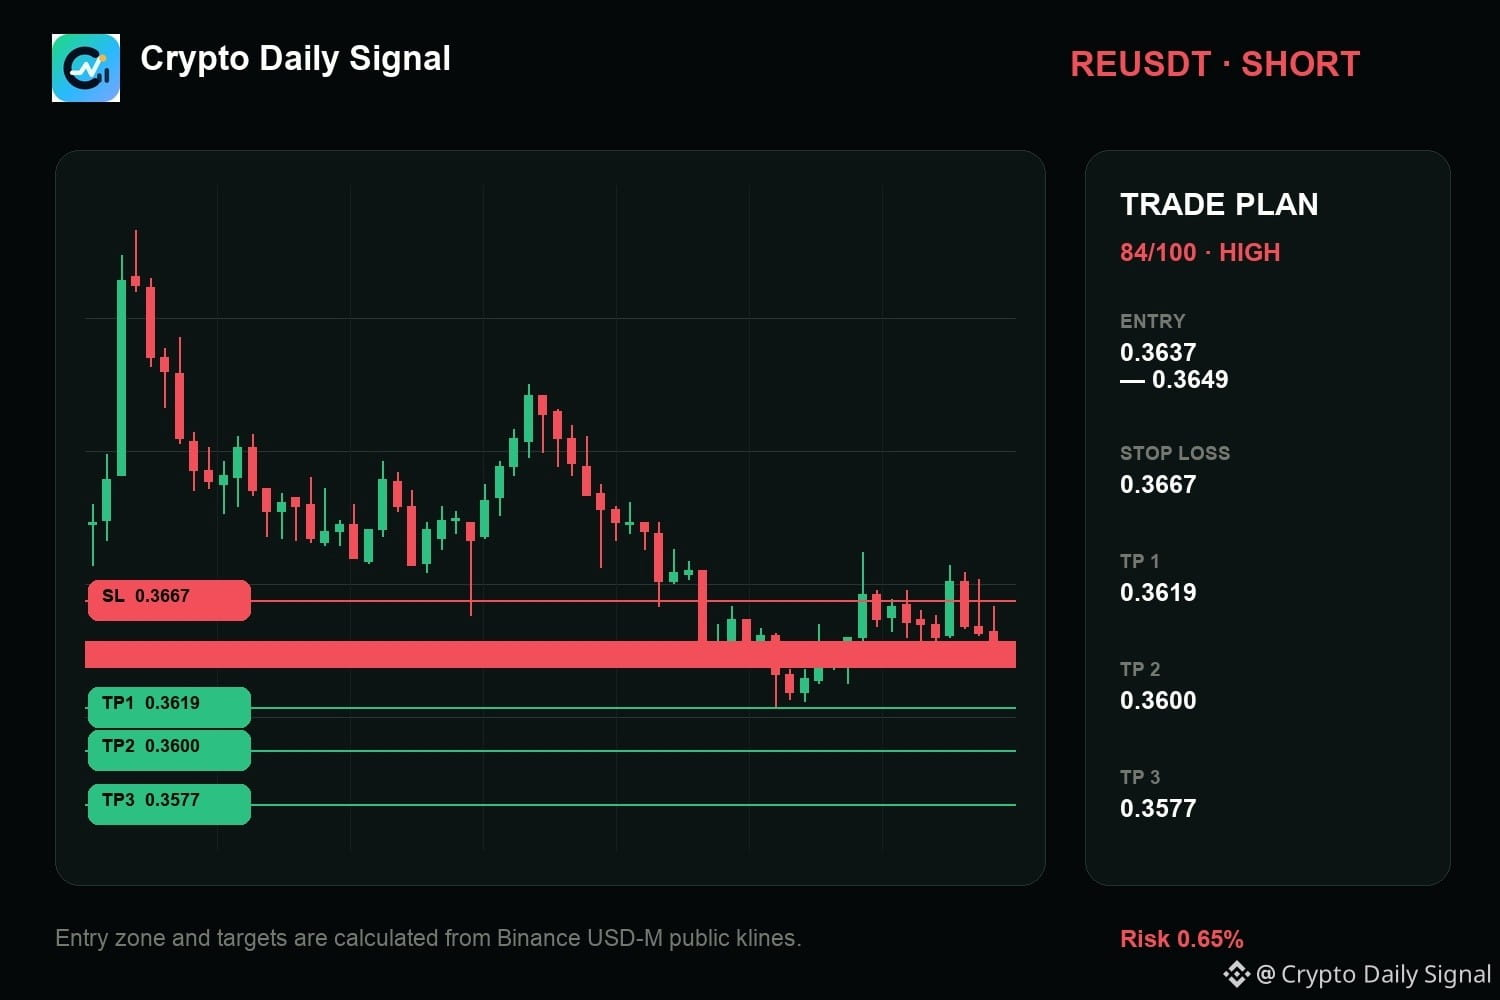
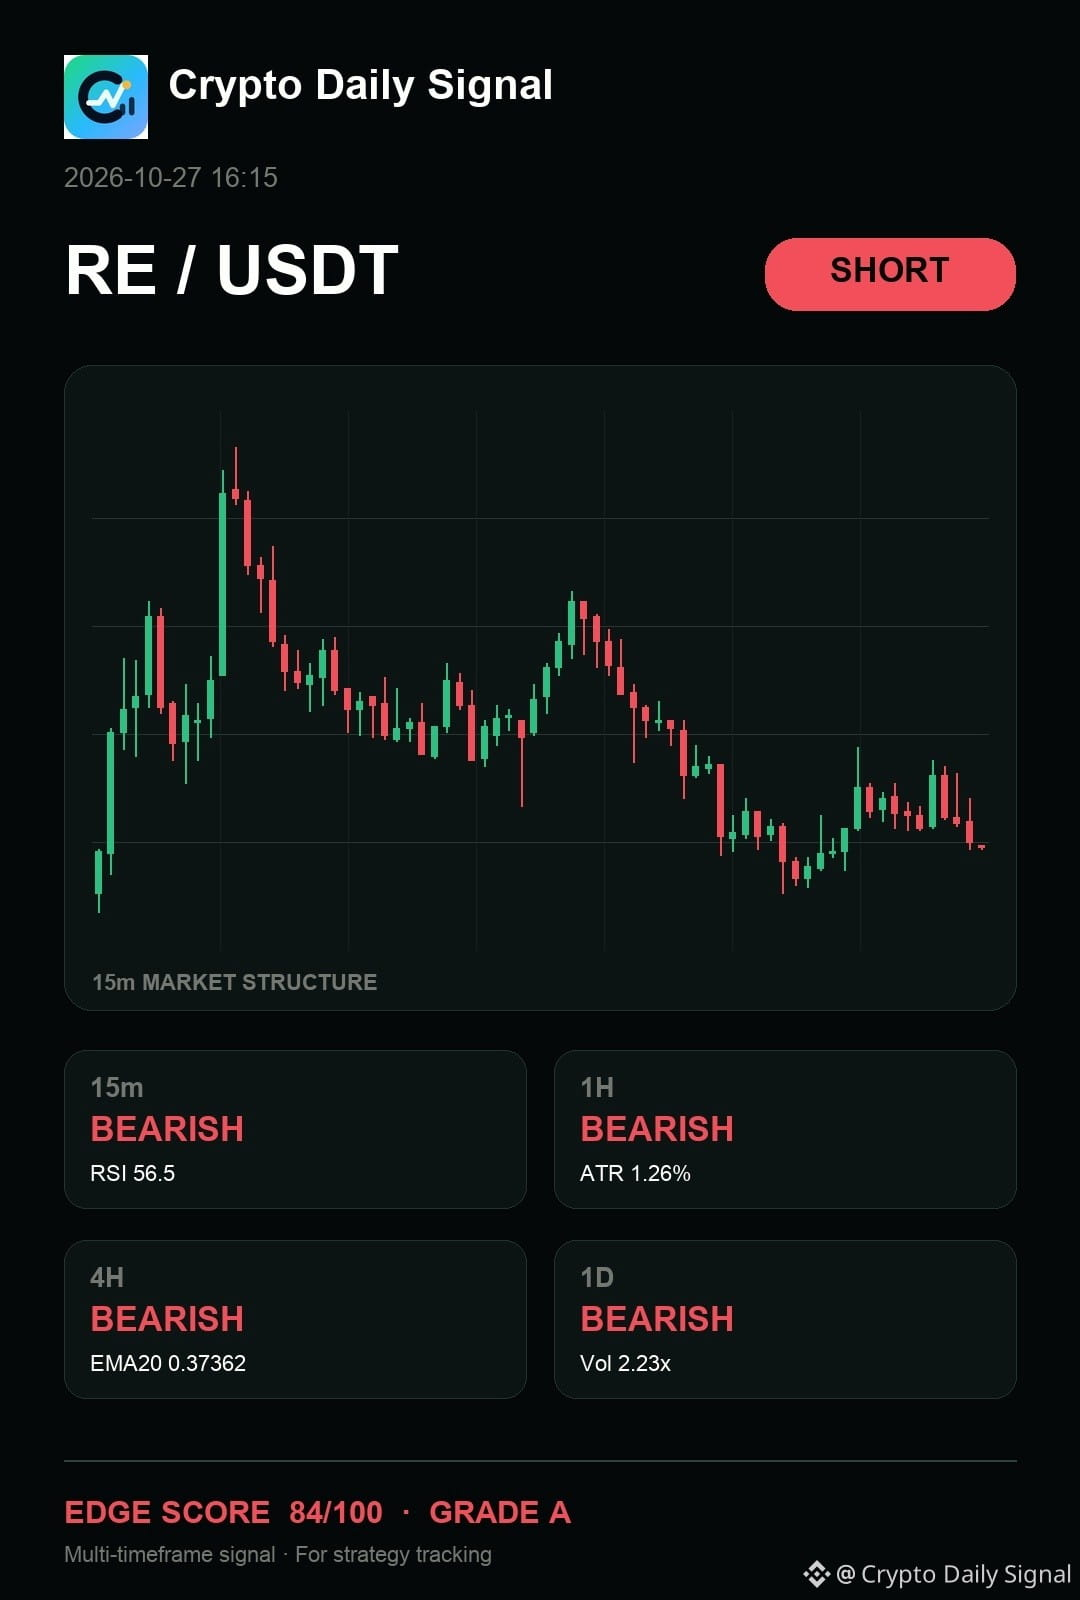
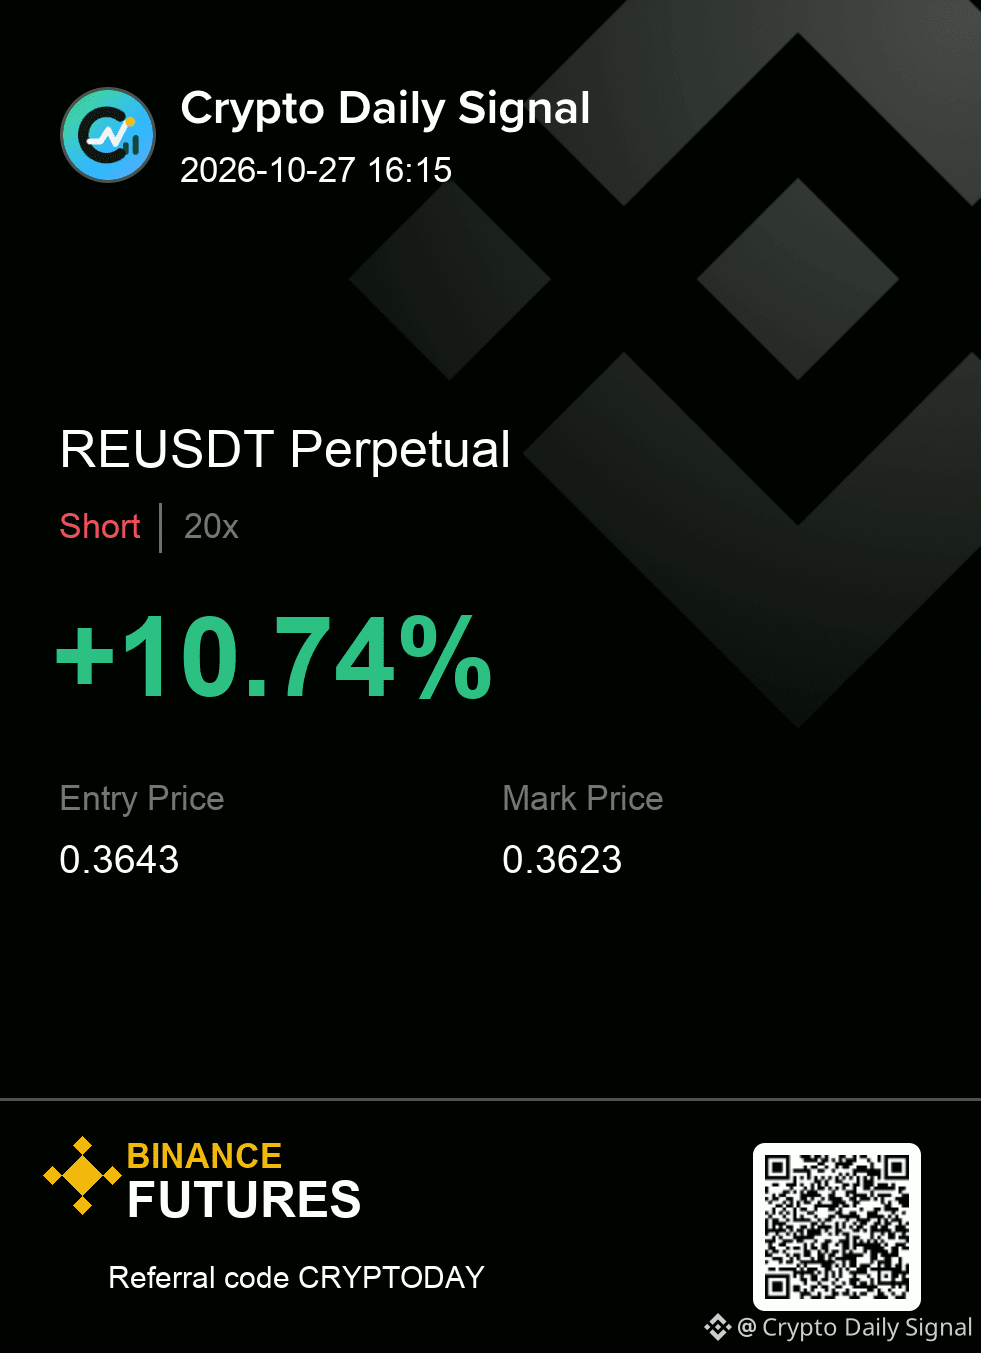
$RE — for me, the core read is that it has a short map worth monitoring. Broader price action remains bearish and the four-hour structure is bearish. I want confirmation from the zone before adding risk, because a move through the cut level would cancel the thesis immediately.
My levels for REUSDT — SHORT
Entry zone 0.3637 - 0.3649
Risk line 0.3667
Targets 0.3619 / 0.3600 / 0.3577
#TradingSignal
{future}(REUSDT)
$RE — for me, the core read is that it has a short map worth monitoring. Broader price action remains bearish and the four-hour structure is bearish. I want confirmation from the zone before adding risk, because a move through the cut level would cancel the thesis immediately.
My levels for REUSDT — SHORT
Entry zone 0.3637 - 0.3649
Risk line 0.3667
Targets 0.3619 / 0.3600 / 0.3577
#TradingSignal
My levels for REUSDT — SHORT
Entry zone 0.3637 - 0.3649
Risk line 0.3667
Targets 0.3619 / 0.3600 / 0.3577
#TradingSignal
8
Übersetzung ansehen
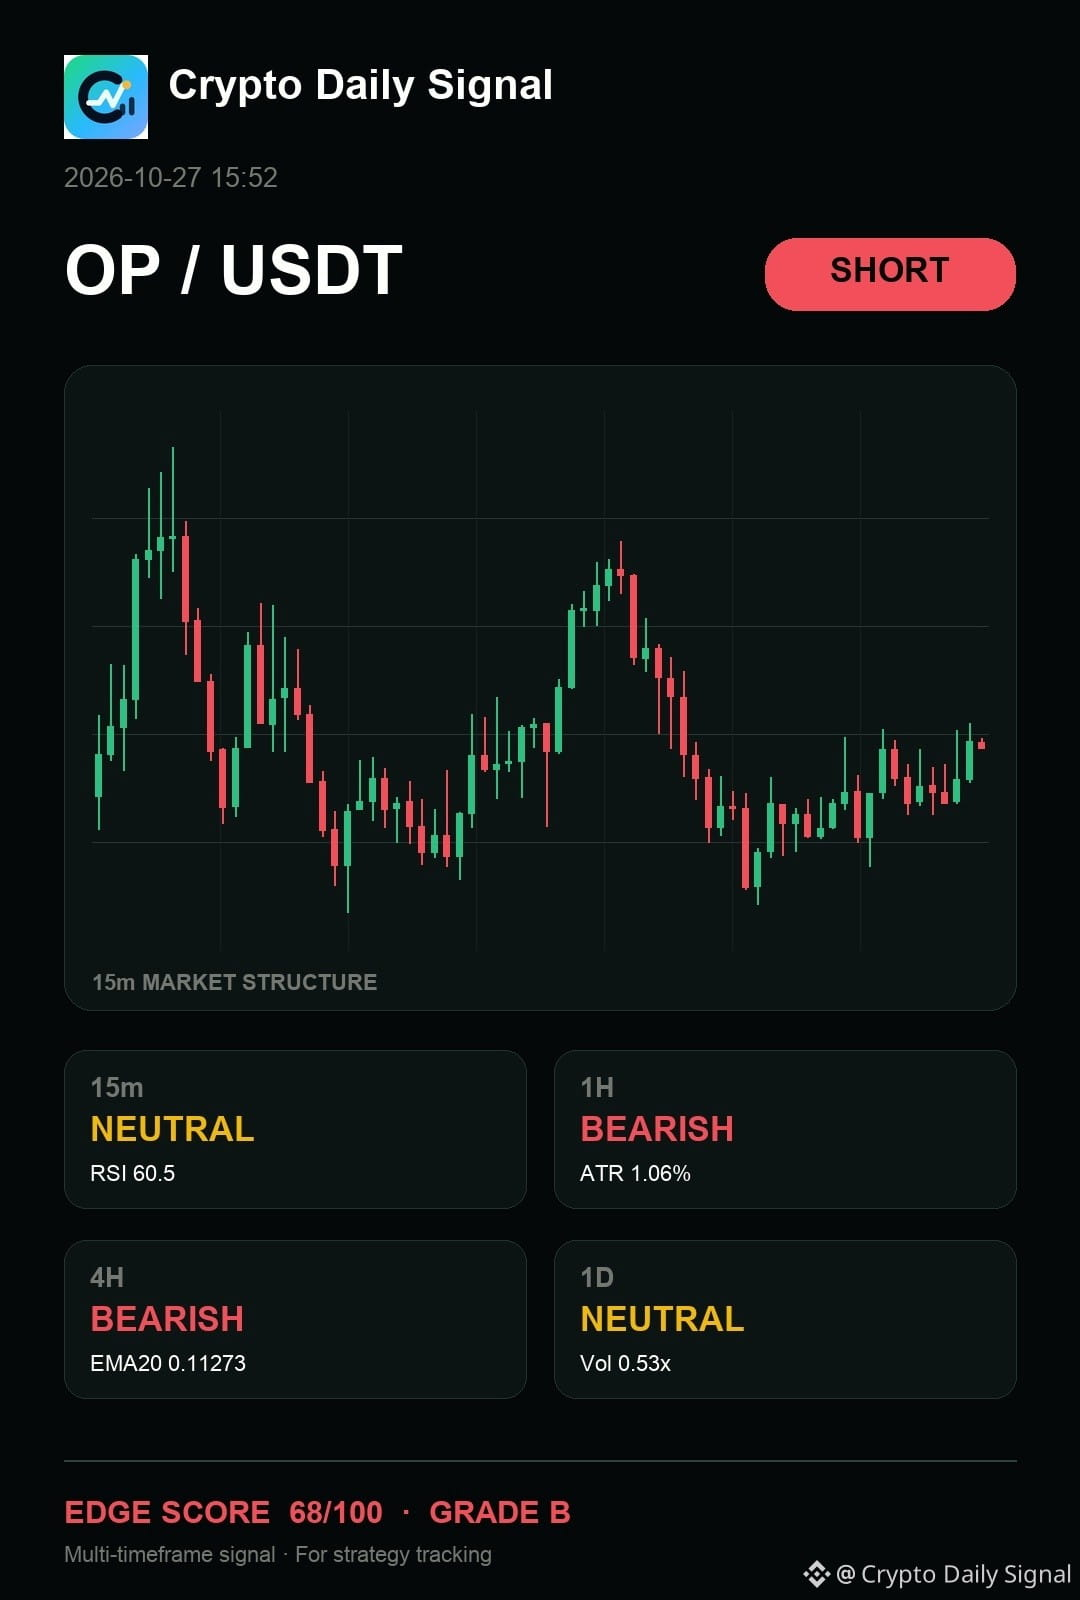
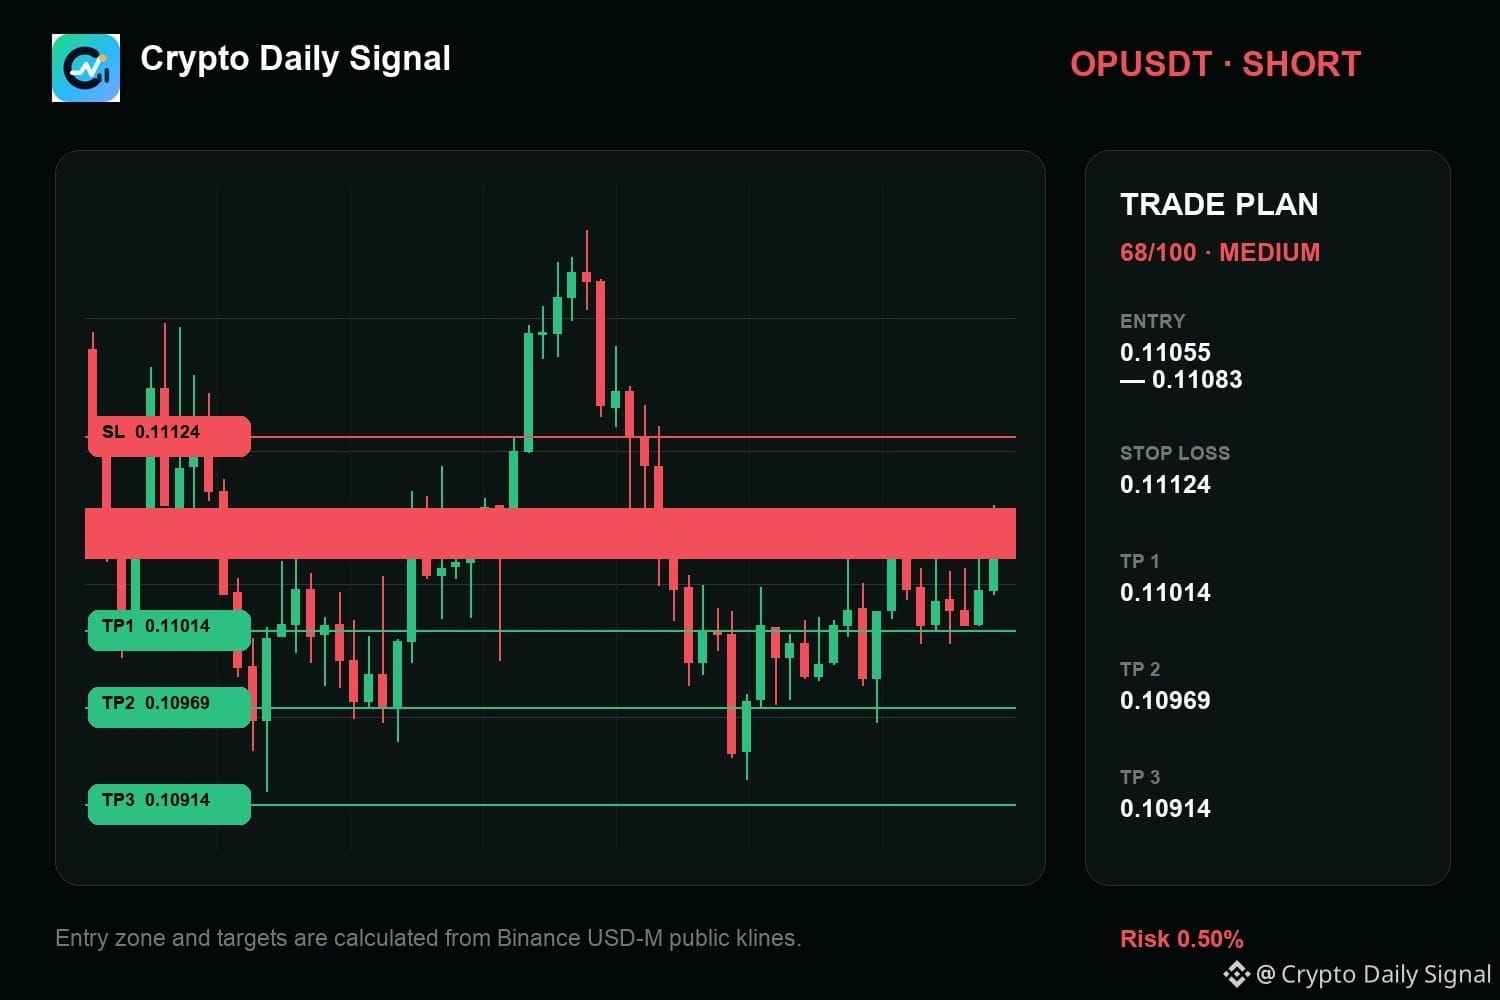
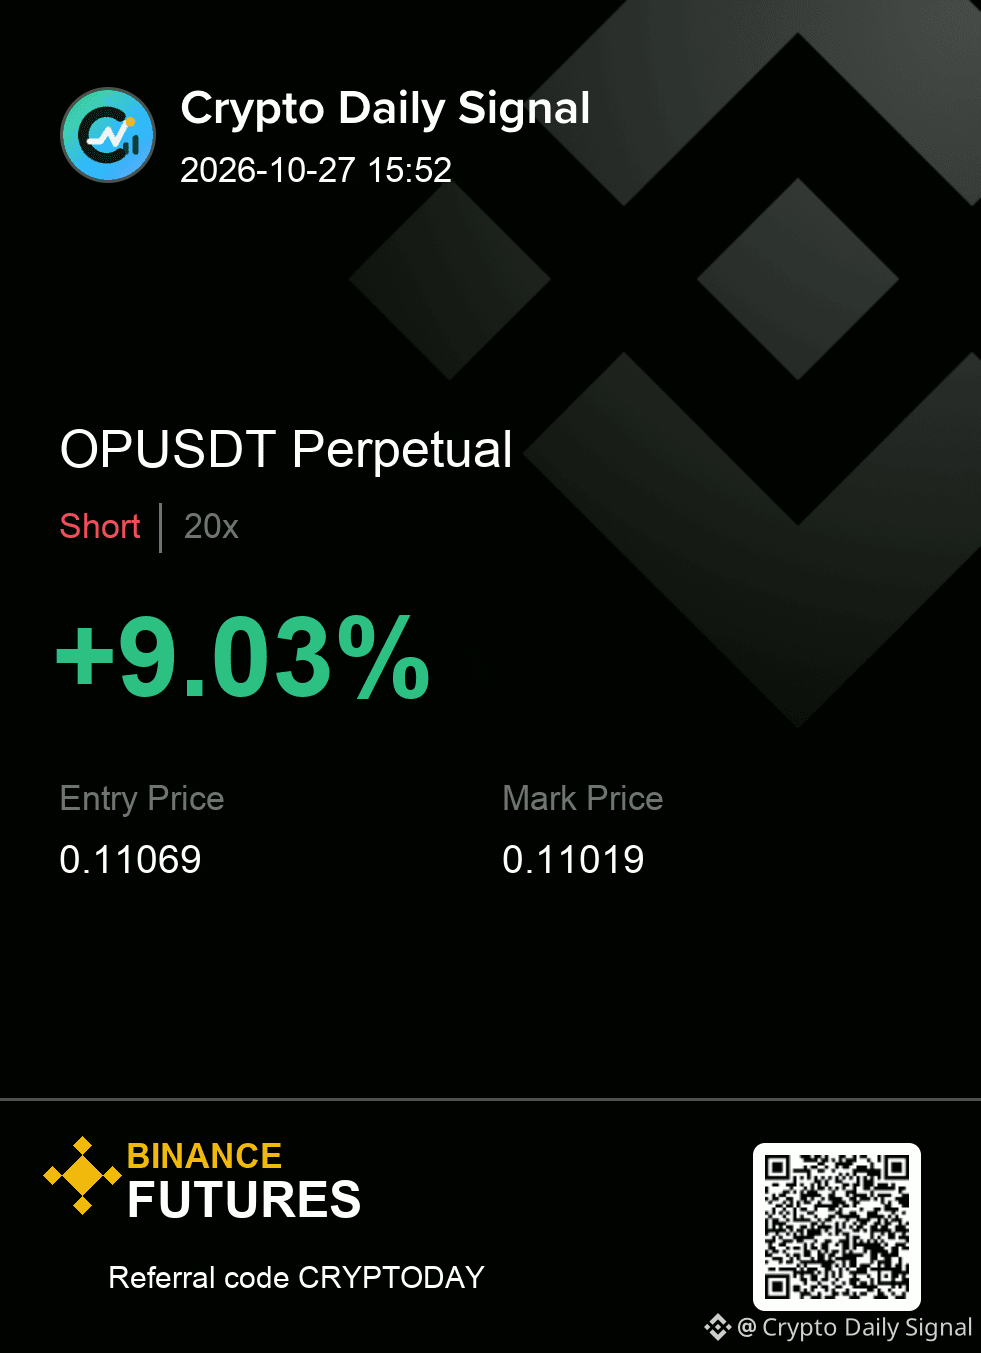
$OP — look, my read is simple: it needs the sell-side reaction to confirm the setup. The current price respecting the lower limit of its recent range works for the short view. A strong rejection from the immediate high on the short term chart would kill this idea.
Levels — OPUSDT
Zone: 0.11055 - 0.11083
Cut: 0.11124
Scale: 0.11014 | 0.10969 | 0.10914
#TradingSignal
{future}(OPUSDT)
$OP — look, my read is simple: it needs the sell-side reaction to confirm the setup. The current price respecting the lower limit of its recent range works for the short view. A strong rejection from the immediate high on the short term chart would kill this idea.
Levels — OPUSDT
Zone: 0.11055 - 0.11083
Cut: 0.11124
Scale: 0.11014 | 0.10969 | 0.10914
#TradingSignal
Levels — OPUSDT
Zone: 0.11055 - 0.11083
Cut: 0.11124
Scale: 0.11014 | 0.10969 | 0.10914
#TradingSignal
9
Übersetzung ansehen
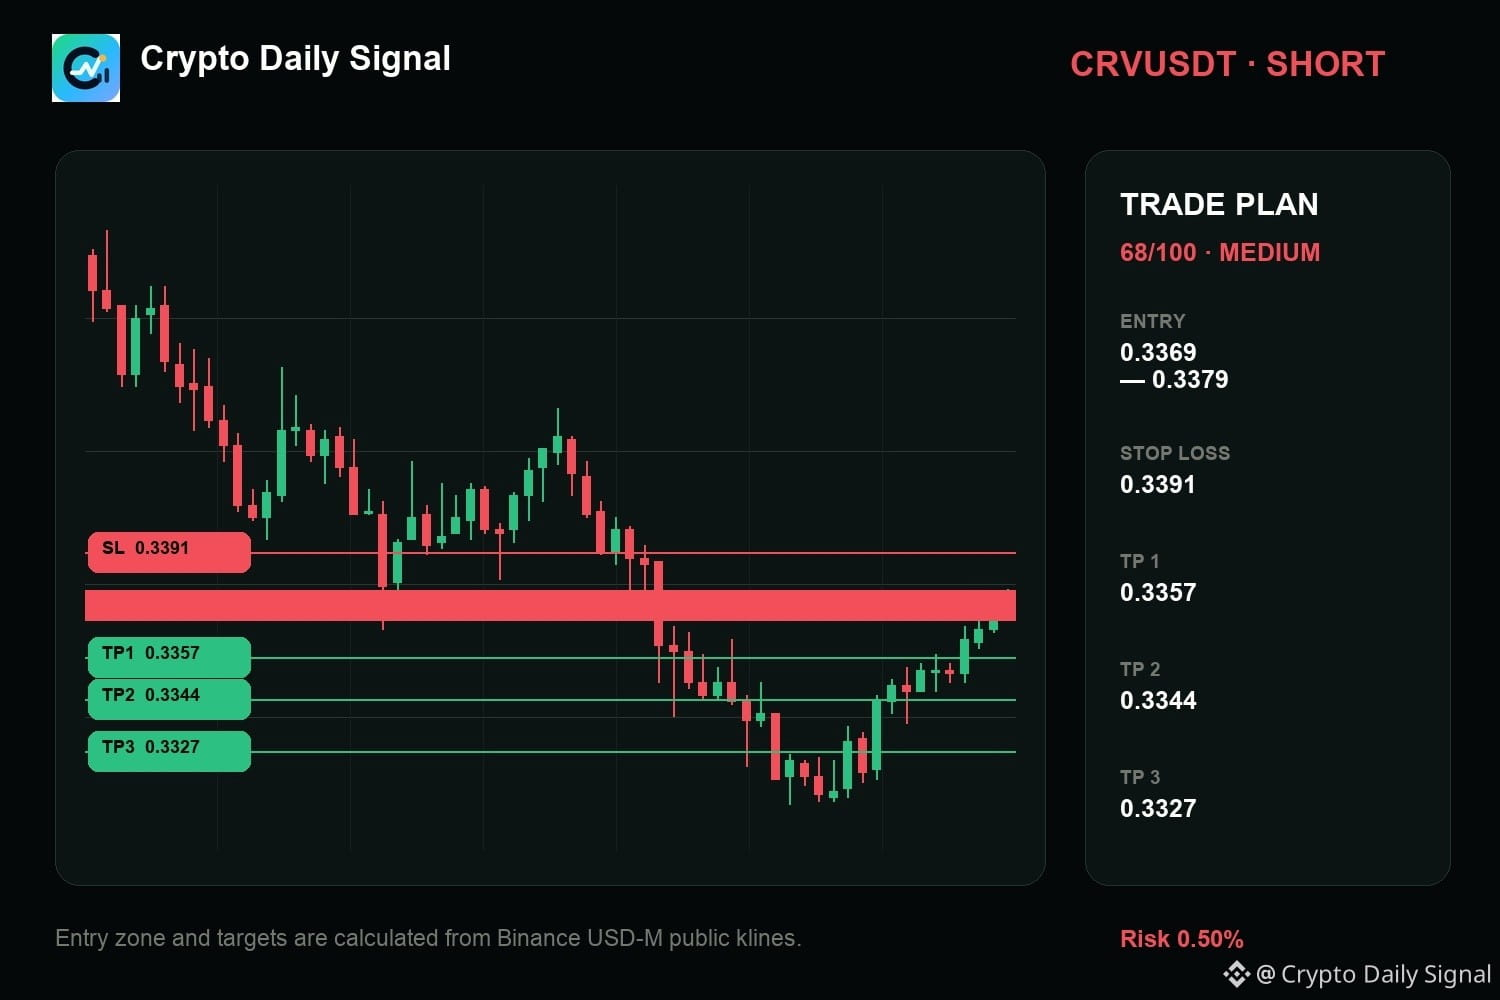
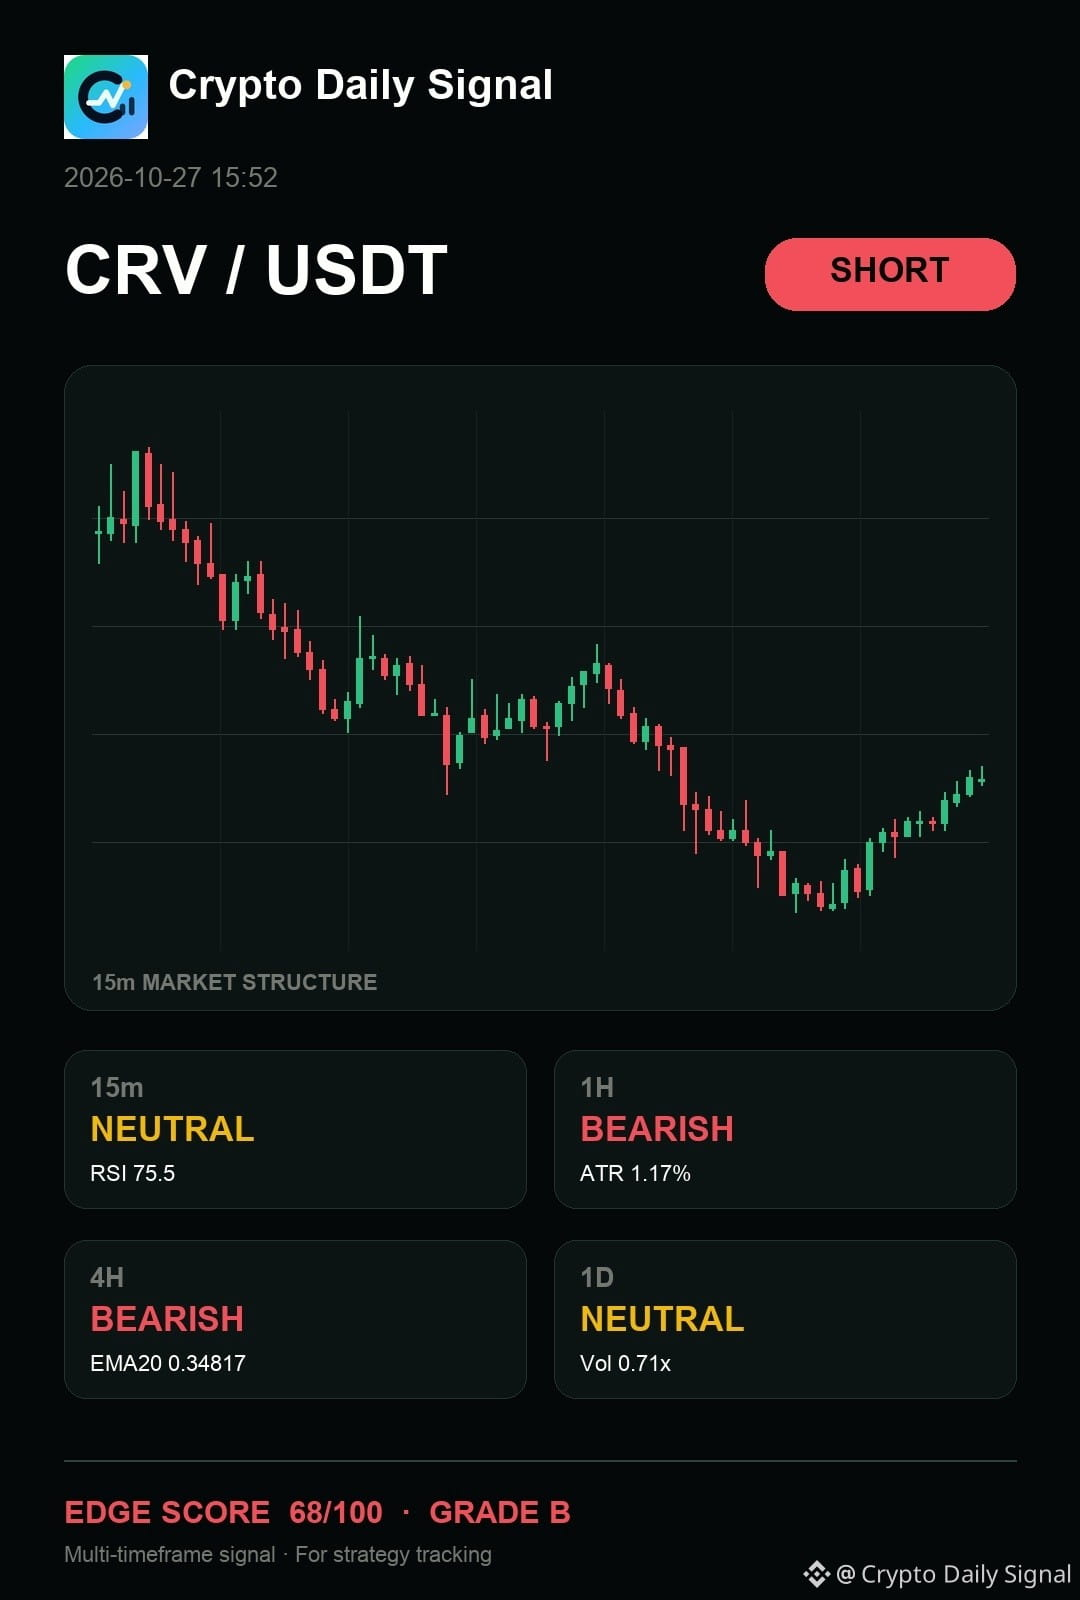
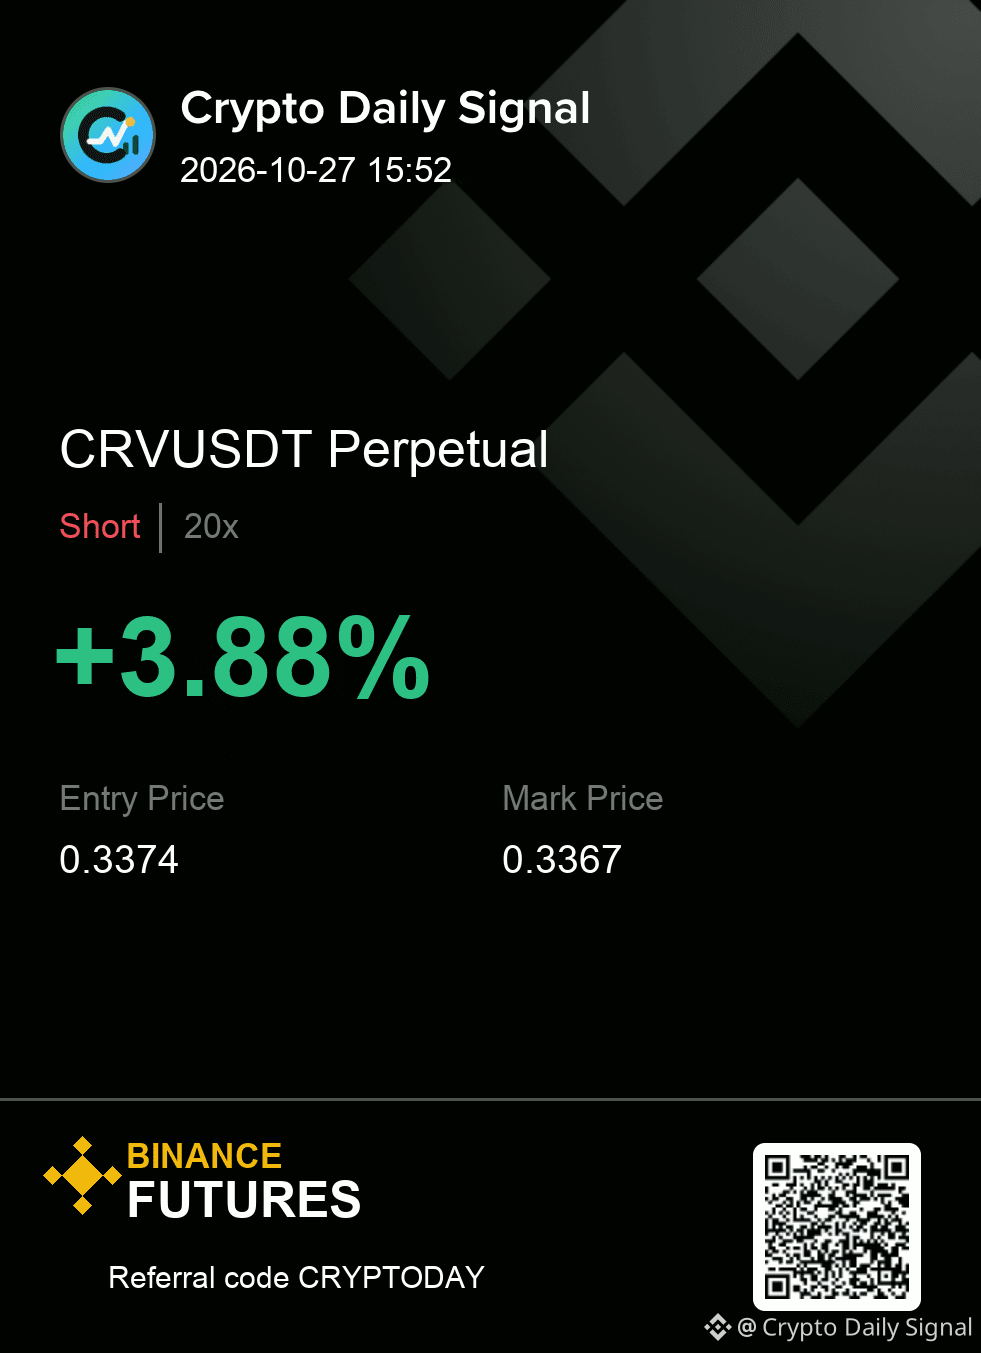
$CRV needs confirmation before I press the short. The immediate price action seems trapped in a downward-sloping range, even as the short-term momentum tries to push higher. A clear break below the bottom of this contained zone is what I need to see to play the downside against the bearish lean on the four-hour chart.
CRVUSDT SHORT
IN 0.3369 - 0.3379
OUT 0.3391
TP 0.3357 · 0.3344 · 0.3327
#TradingSignal
{future}(CRVUSDT)
$CRV needs confirmation before I press the short. The immediate price action seems trapped in a downward-sloping range, even as the short-term momentum tries to push higher. A clear break below the bottom of this contained zone is what I need to see to play the downside against the bearish lean on the four-hour chart.
CRVUSDT SHORT
IN 0.3369 - 0.3379
OUT 0.3391
TP 0.3357 · 0.3344 · 0.3327
#TradingSignal
CRVUSDT SHORT
IN 0.3369 - 0.3379
OUT 0.3391
TP 0.3357 · 0.3344 · 0.3327
#TradingSignal
7
Übersetzung ansehen
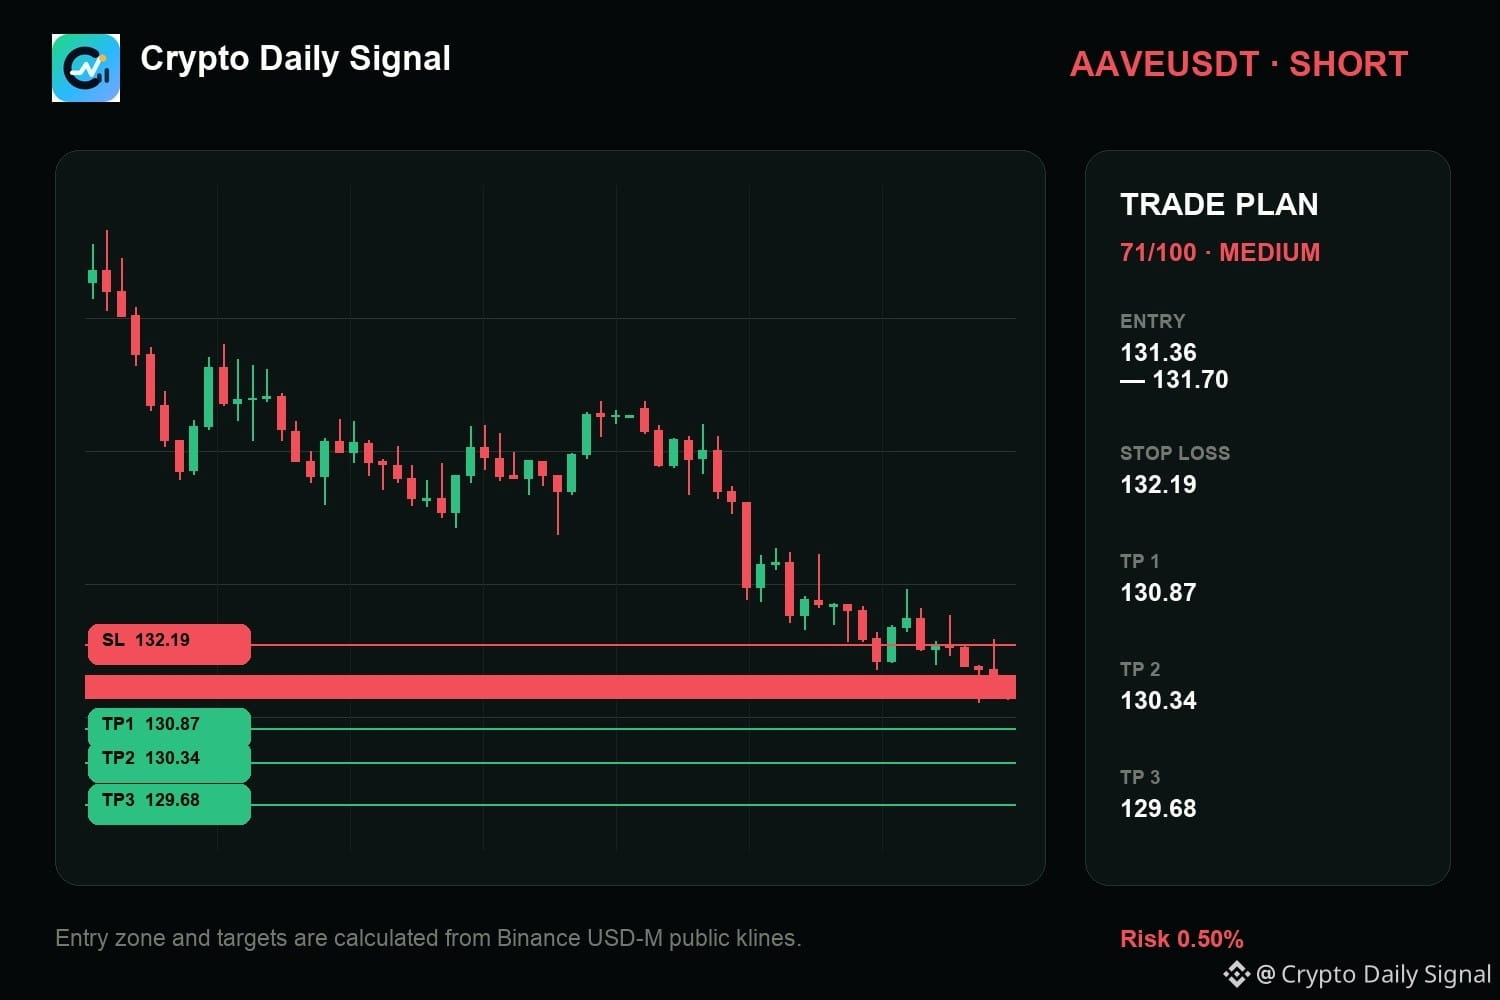
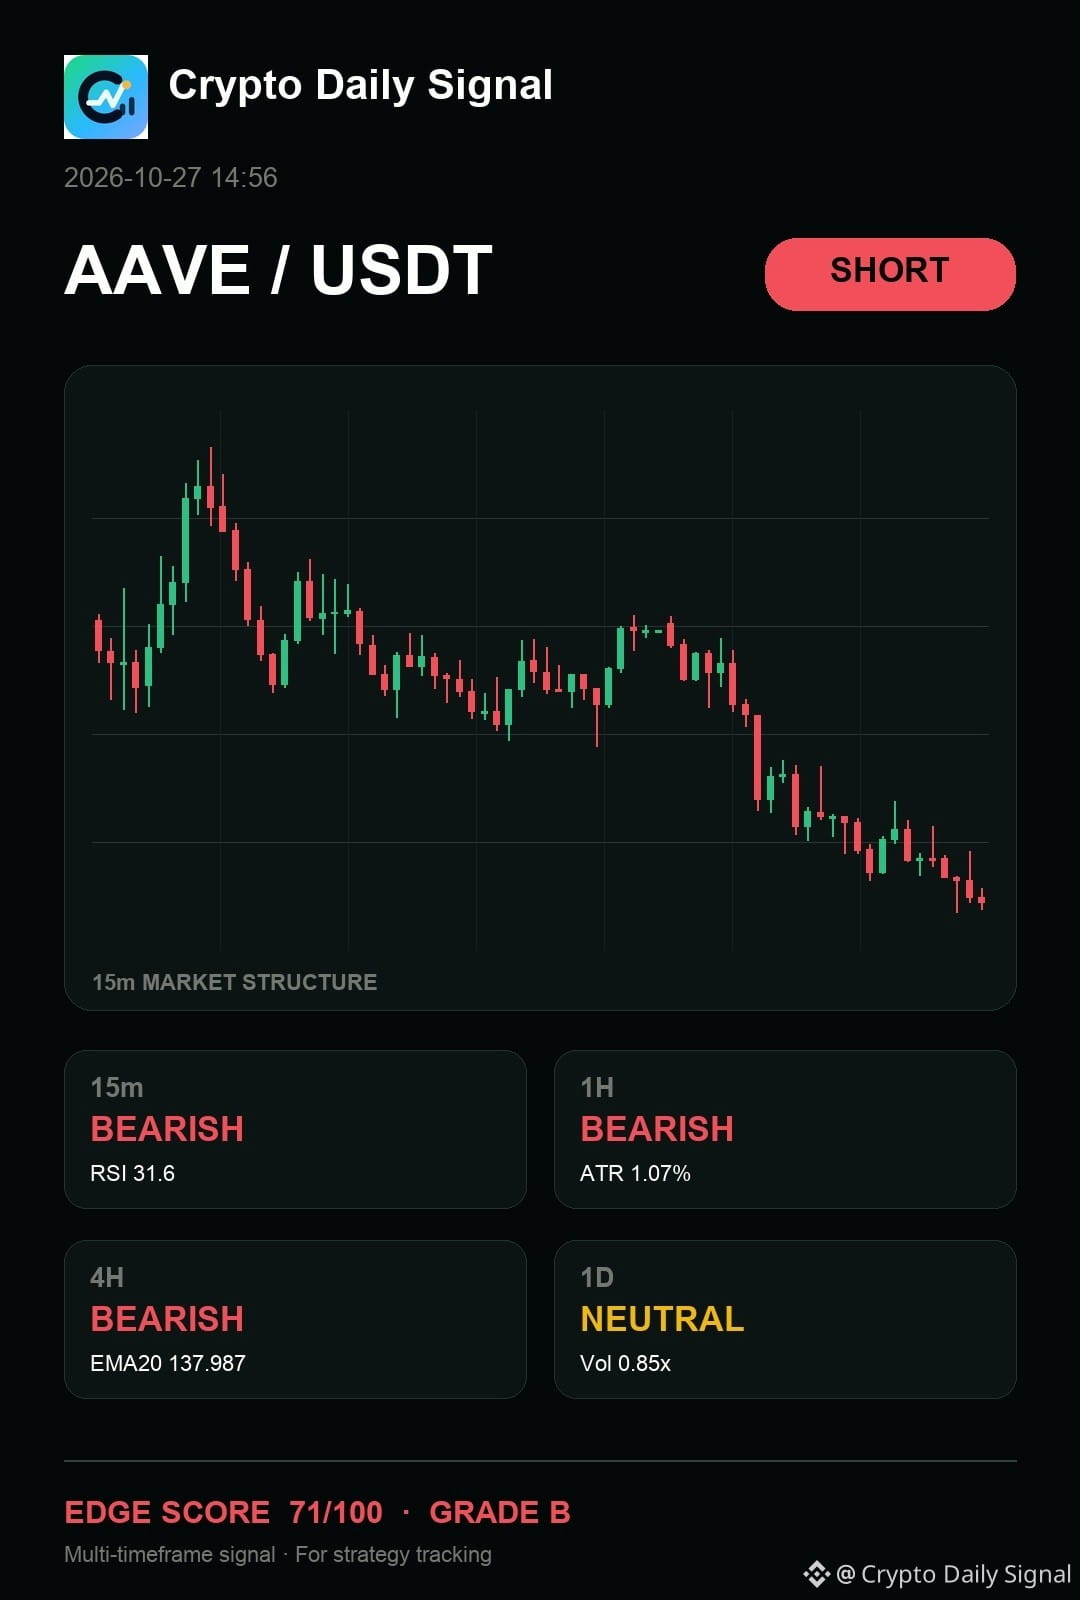
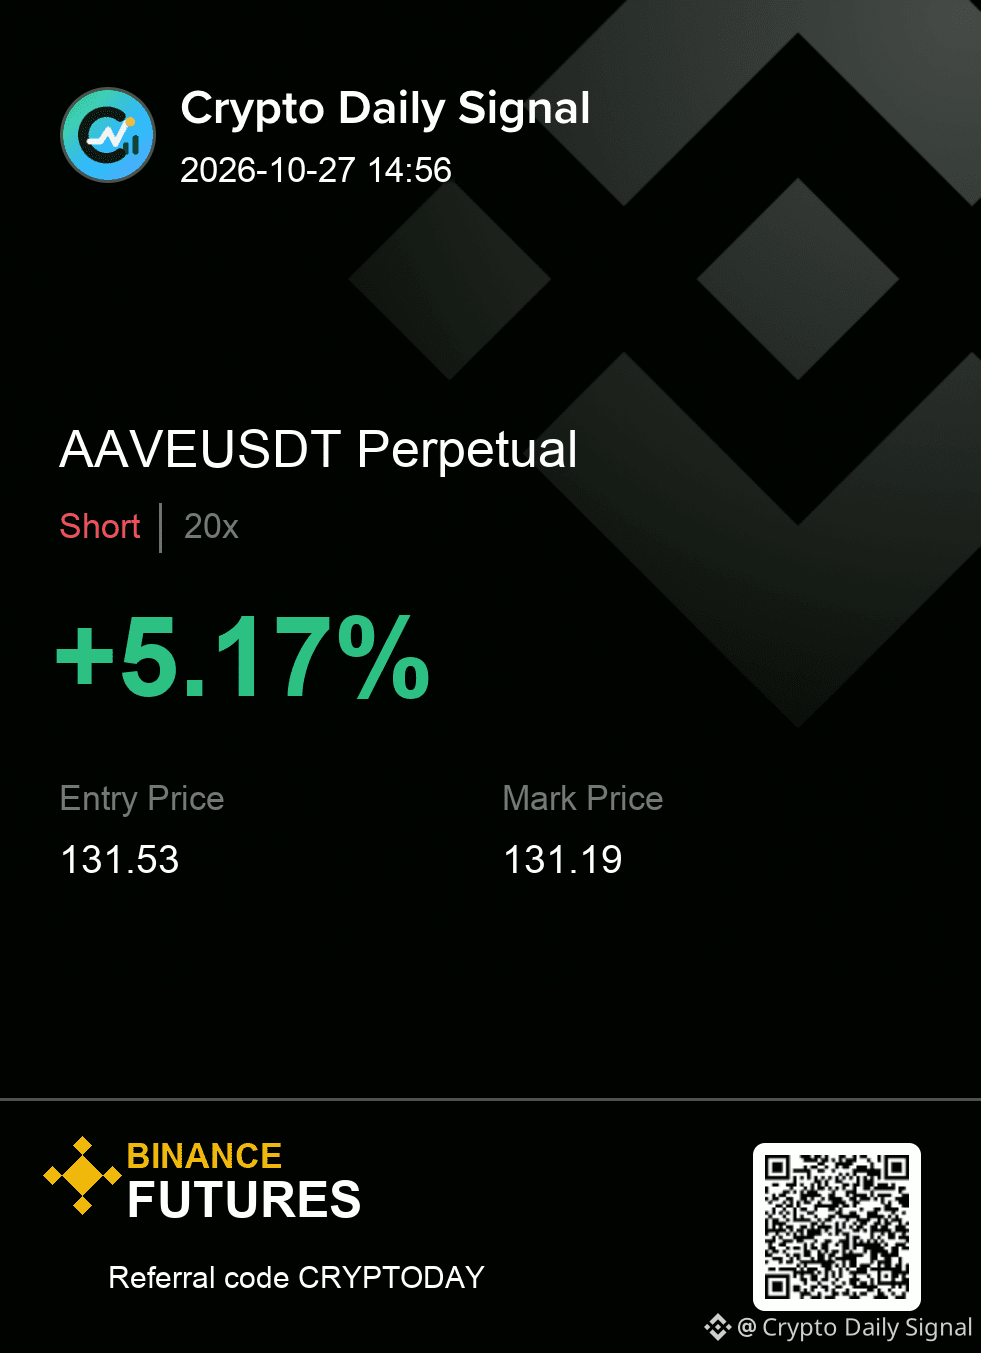
$AAVE — man, the part I care about is how it still gives sellers the cleaner argument. The price action shows clear lower highs and lower lows across the visible timeframes, with large red bodies taking charge recently. It is respecting a descending trendline from prior peaks. If it can decisively close below the immediate support zone, the short picture gets stronger.
SHORT plan for AAVEUSDT
131.36 - 131.70 entry | 132.19 stop
130.87 → 130.34 → 129.68
#TradingSignal
{future}(AAVEUSDT)
$AAVE — man, the part I care about is how it still gives sellers the cleaner argument. The price action shows clear lower highs and lower lows across the visible timeframes, with large red bodies taking charge recently. It is respecting a descending trendline from prior peaks. If it can decisively close below the immediate support zone, the short picture gets stronger.
SHORT plan for AAVEUSDT
131.36 - 131.70 entry | 132.19 stop
130.87 → 130.34 → 129.68
#TradingSignal
SHORT plan for AAVEUSDT
131.36 - 131.70 entry | 132.19 stop
130.87 → 130.34 → 129.68
#TradingSignal
10

·
--
Übersetzung ansehen
🟢 LONG $PARTI | 30m
📍 Vào lệnh: 0.0386
🛑 Cắt lỗ: 0.0379 (-1.81%)
🎯 Chốt lời: 0.0393 (+1.81%) | R:R 1:1
✅ RSI vừa hoàn thành điều chỉnh, cắt lại lên trên EMA9 & WMA45
✅ Khung 4H + 12H cùng xu hướng tăng
✅ Giá nằm trên Baseline
⏰ Tín hiệu lúc 14:00 27/10 (giờ VN)
⚠️ Rủi ro tối đa 1% tài khoản/lệnh. Không phải lời khuyên đầu tư.
#PARTI #Crypto #TradingSignal
54
Übersetzung ansehen
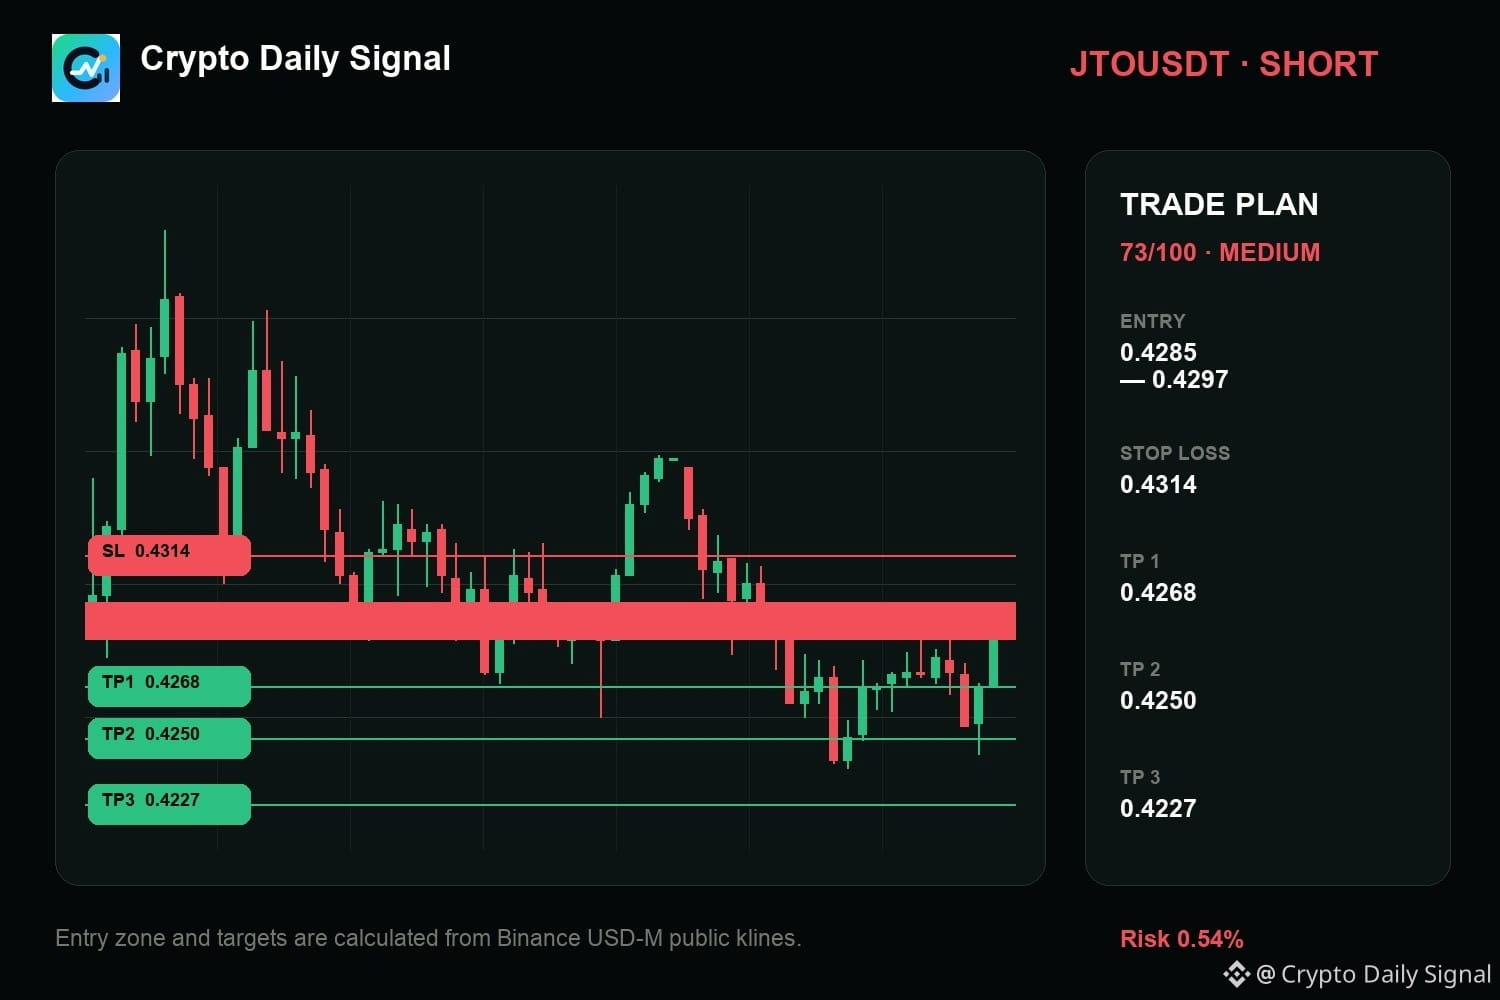
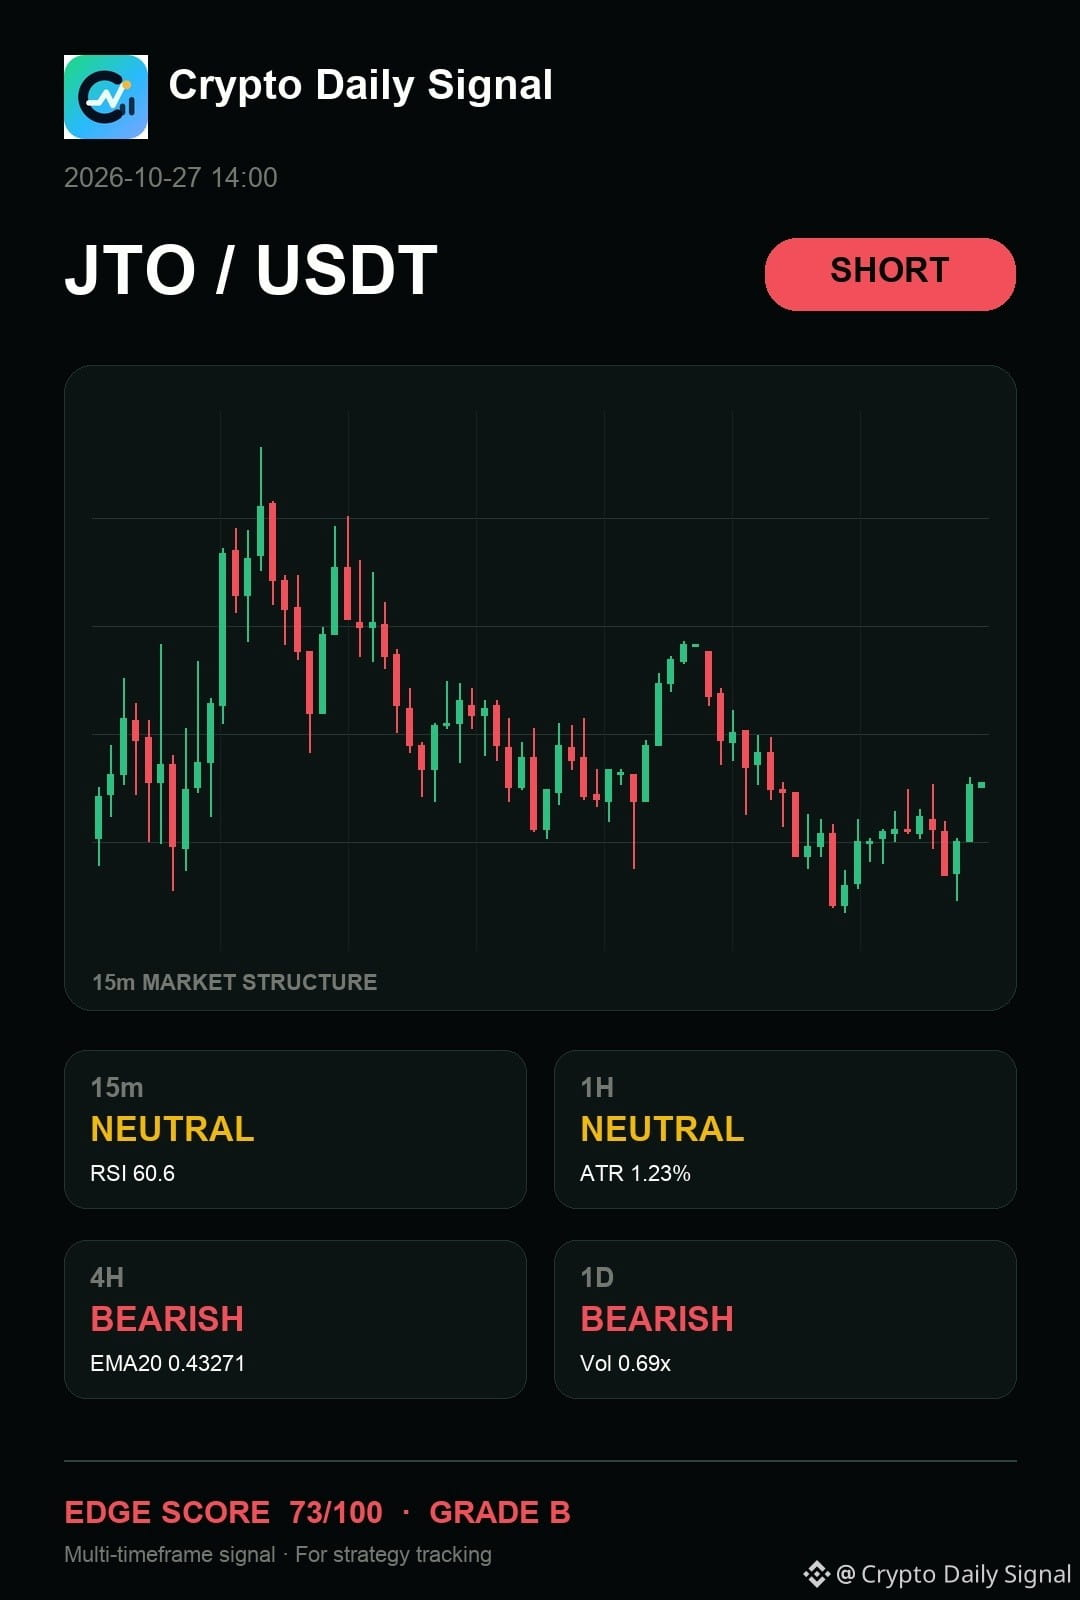
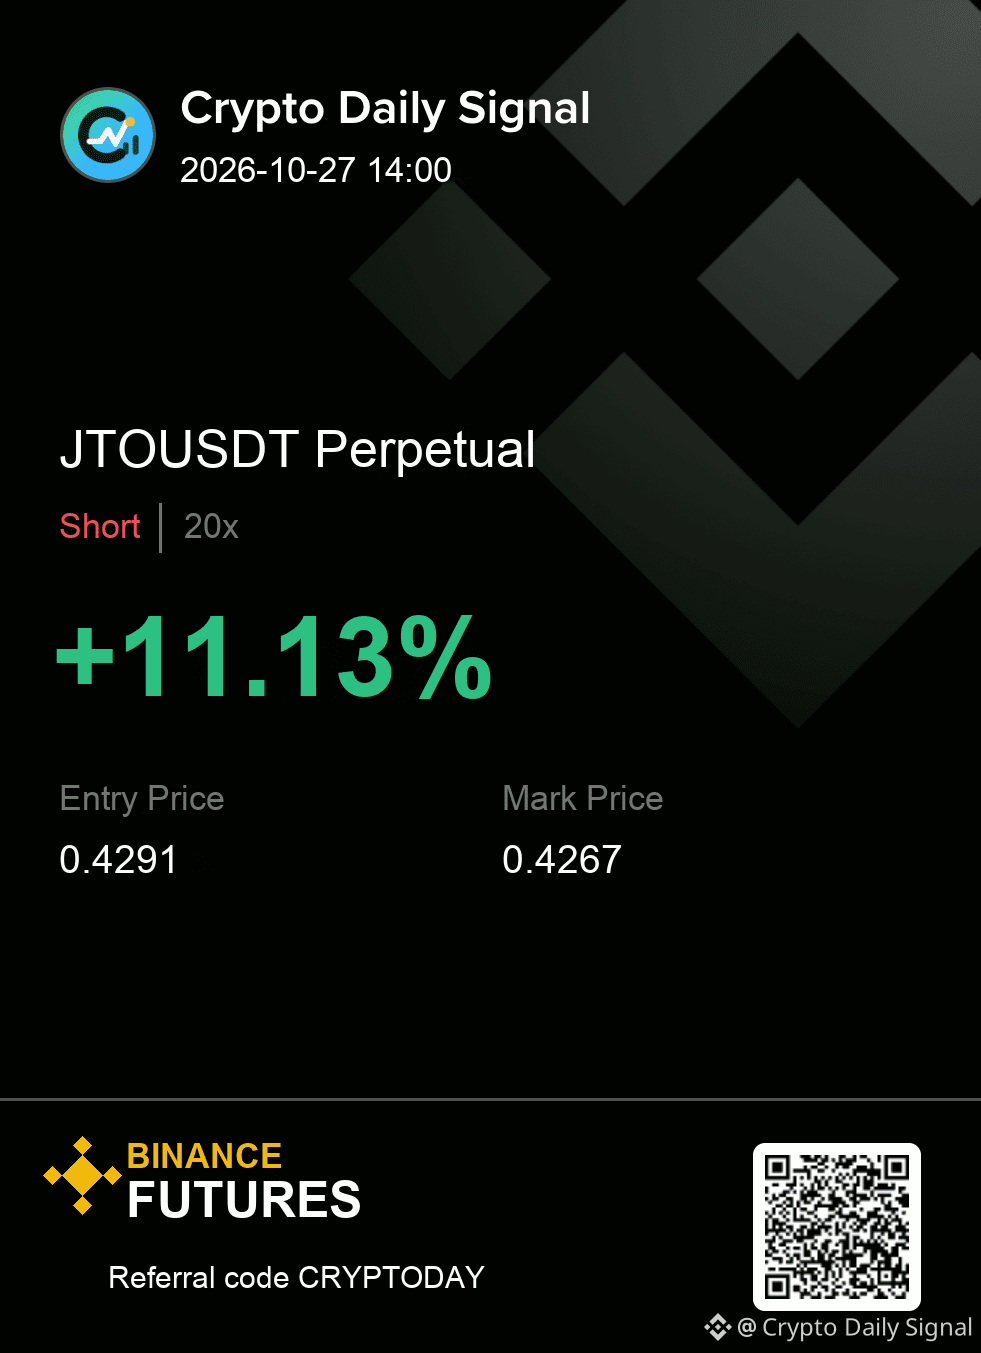
$JTO keeps the bearish thesis active as the price remains trapped within a descending channel structure on the daily chart. We are seeing repeated negative candles, which shows that bears are still in control of the overall trend. The idea remains stronger if the price decisively closes beneath the established range floor.
Levels — JTOUSDT
Zone: 0.4285 - 0.4297
Cut: 0.4314
Scale: 0.4268 | 0.4250 | 0.4227
#TradingSignal
{future}(JTOUSDT)
$JTO keeps the bearish thesis active as the price remains trapped within a descending channel structure on the daily chart. We are seeing repeated negative candles, which shows that bears are still in control of the overall trend. The idea remains stronger if the price decisively closes beneath the established range floor.
Levels — JTOUSDT
Zone: 0.4285 - 0.4297
Cut: 0.4314
Scale: 0.4268 | 0.4250 | 0.4227
#TradingSignal
Levels — JTOUSDT
Zone: 0.4285 - 0.4297
Cut: 0.4314
Scale: 0.4268 | 0.4250 | 0.4227
#TradingSignal
7
·
--
Übersetzung ansehen
🔥 BULLA SHORT SETUP ACTIVATED
Combined score: 76.93. Bias: SHORT.
✅ Entry: 0.10037
⚠️ SL: 0.109407
🎯 TP1: 0.086815
🎯 TP2: 0.077778
24h price +25.80% | Volume spikes confirmed.
⚠️ This is a trading setup, not a guaranteed result.
Question: Are you watching BULLAUSDT for a breakdown? #BULLAUSDT #CryptoSetup
$BULLA #TradingSignal #CryptoAnalysis

Anmelden und weiter Inhalte entdecken
Krypto-Nutzer weltweit auf Binance Square kennenlernen
⚡️ Bleib in Sachen Krypto stets am Puls.
💬 Die weltgrößte Kryptobörse vertraut darauf.
👍 Erhalte verlässliche Einblicke von verifizierten Creators.
E-Mail-Adresse/Telefonnummer
Trendthemen
1
#CanMicrosoftDeliverOnAI
598 Aufrufe
64 Kommentare
2
#CanGoogleDefindItsCore
619 Aufrufe
70 Kommentare
3
#FOMCWatch
9M Aufrufe
27,208 Kommentare
4
#EthereumDropsBelow$2300
5,229 Aufrufe
113 Kommentare
5
#BitcoinSlipsBelow$80KAgain
17,719 Aufrufe
82 Kommentare
6
#ThailandLaunchesWORPTStablecoinToQRPaymentApp
29,238 Aufrufe
511 Kommentare
7
#StrategySkipsBitcoinPurchasesSpends$205MOnSTRCBuybacks
7,885 Aufrufe
84 Kommentare
8
#BitmineAdds10452ETH
67,668 Aufrufe
910 Kommentare
9
#SouthKoreaConsidersEducationTaxOnCryptoExchanges
36,324 Aufrufe
666 Kommentare
10
#OCCUrgesCommunityBanksToEnterStablecoinPayments
28,430 Aufrufe
478 Kommentare