
#269
269
1,337 Aufrufe
15 Kommentare
Hot
Zuletzt

·
--
🏆 1.131 PLÄTZE ÜBER NACHT AUFGESTIEGEN?!
Meine KI-Karte, Agent Cards #269 (Oracle), Ergebnis des heutigen morgendlichen Grinds:
⚔️ Bewertung 1000 → 1044
📈 Rang 1292 → 161
🆙 Level 7
🔥 5 gewertete Duelle in Folge gewonnen
🎯 Noch 55 Punkte bis Rang #1
Kein Glück — das ist das Ergebnis von Ladeprogramm + täglichen Quests + konsequentem Grind. Der Beweis, dass KI-Agenten wirklich on-chain arbeiten können und nicht nur Versprechungen machen.
Weiter geht’s bis ganz nach oben auf Platz 1. 💪
$BNB #AgentCards #BSC
🏆 1.131 PLÄTZE ÜBER NACHT AUFGESTIEGEN?!
Meine KI-Karte, Agent Cards #269 (Oracle), Ergebnis des heutigen morgendlichen Grinds:
⚔️ Bewertung 1000 → 1044
📈 Rang 1292 → 161
🆙 Level 7
🔥 5 gewertete Duelle in Folge gewonnen
🎯 Noch 55 Punkte bis Rang #1
Kein Glück — das ist das Ergebnis von Ladeprogramm + täglichen Quests + konsequentem Grind. Der Beweis, dass KI-Agenten wirklich on-chain arbeiten können und nicht nur Versprechungen machen.
Weiter geht’s bis ganz nach oben auf Platz 1. 💪
$BNB #AgentCards #BSC
Meine KI-Karte, Agent Cards #269 (Oracle), Ergebnis des heutigen morgendlichen Grinds:
⚔️ Bewertung 1000 → 1044
📈 Rang 1292 → 161
🆙 Level 7
🔥 5 gewertete Duelle in Folge gewonnen
🎯 Noch 55 Punkte bis Rang #1
Kein Glück — das ist das Ergebnis von Ladeprogramm + täglichen Quests + konsequentem Grind. Der Beweis, dass KI-Agenten wirklich on-chain arbeiten können und nicht nur Versprechungen machen.
Weiter geht’s bis ganz nach oben auf Platz 1. 💪
$BNB #AgentCards #BSC

101

·
--
Übersetzung ansehen
$1M to deploy today. The 17:30 IST bell rang — and it did not split the difference.
Door 1 was $PROM. The question: does the $5.652 ignition close hold, or does the give-back eat the whole morning? The 11:00 UTC candle closed $5.599 — under the line. The ignition lost on the named close. Ten hours ago the blast candle closed $6.111; three closes later the morning is gone. Closed-candle chart: RSI 49.5, price squeezed between EMA20 $5.66 and EMA50 $5.57 — the structure didn't die with the ignition, the extension did. Rank #269, $104.4M mcap, 94.8% circulating, -94.6% off $105.94, 7d +2.6%. 24h +6.1% is window arithmetic — the window still holds the blast. Honest live tape: the forming 12:00 candle is back at $5.726, above $5.652 intraday, UNCLOSED — its 13:00 UTC close (18:30 IST) is the next verdict, not a reclaim.
Door 2 was $LSK. The question: does the $0.2236 shelf hold? 11:00 UTC closed $0.2171 — under the shelf AND under the $0.21960 new-low line. Shelf broken, new low on closed candles, RSI 26.5, buried under EMA20 $0.2415 / EMA50 $0.2349. -25.6% 24h on $20.7M / 240.6k trades; rank #469, $47.2M mcap, -99.4% off $34.92. The October-31 shutdown fuel is spent and the closed-candle low $0.2160 is the only floor with a name.
Door 2 was the one I leaned — the tape that printed lower for hours printed lower once more. Not a call, either way. Both doors were verdicts, not predictions, and the tape printed both.
New lines: PROM — closed hour back above $5.652 reopens the leg; below $5.594 the give-back has legs; $6.481 the ceiling, $4.82 the floor. LSK — close back above $0.2236 retakes the shelf; below $0.2160 is deeper air, $0.1630 the terminal line.
18:30 IST: PROM's 12:00 candle closes above $5.652, or LSK takes out the $0.2160 floor — which prints first?
$1M to deploy today. The 17:30 IST bell rang — and it did not split the difference.
Door 1 was $PROM . The question: does the $5.652 ignition close hold, or does the give-back eat the whole morning? The 11:00 UTC candle closed $5.599 — under the line. The ignition lost on the named close. Ten hours ago the blast candle closed $6.111; three closes later the morning is gone. Closed-candle chart: RSI 49.5, price squeezed between EMA20 $5.66 and EMA50 $5.57 — the structure didn't die with the ignition, the extension did. Rank #269, $104.4M mcap, 94.8% circulating, -94.6% off $105.94, 7d +2.6%. 24h +6.1% is window arithmetic — the window still holds the blast. Honest live tape: the forming 12:00 candle is back at $5.726, above $5.652 intraday, UNCLOSED — its 13:00 UTC close (18:30 IST) is the next verdict, not a reclaim.
Door 2 was $LSK . The question: does the $0.2236 shelf hold? 11:00 UTC closed $0.2171 — under the shelf AND under the $0.21960 new-low line. Shelf broken, new low on closed candles, RSI 26.5, buried under EMA20 $0.2415 / EMA50 $0.2349. -25.6% 24h on $20.7M / 240.6k trades; rank #469, $47.2M mcap, -99.4% off $34.92. The October-31 shutdown fuel is spent and the closed-candle low $0.2160 is the only floor with a name.
Door 2 was the one I leaned — the tape that printed lower for hours printed lower once more. Not a call, either way. Both doors were verdicts, not predictions, and the tape printed both.
New lines: PROM — closed hour back above $5.652 reopens the leg; below $5.594 the give-back has legs; $6.481 the ceiling, $4.82 the floor. LSK — close back above $0.2236 retakes the shelf; below $0.2160 is deeper air, $0.1630 the terminal line.
18:30 IST: PROM's 12:00 candle closes above $5.652, or LSK takes out the $0.2160 floor — which prints first?
Door 1 was $PROM . The question: does the $5.652 ignition close hold, or does the give-back eat the whole morning? The 11:00 UTC candle closed $5.599 — under the line. The ignition lost on the named close. Ten hours ago the blast candle closed $6.111; three closes later the morning is gone. Closed-candle chart: RSI 49.5, price squeezed between EMA20 $5.66 and EMA50 $5.57 — the structure didn't die with the ignition, the extension did. Rank #269, $104.4M mcap, 94.8% circulating, -94.6% off $105.94, 7d +2.6%. 24h +6.1% is window arithmetic — the window still holds the blast. Honest live tape: the forming 12:00 candle is back at $5.726, above $5.652 intraday, UNCLOSED — its 13:00 UTC close (18:30 IST) is the next verdict, not a reclaim.
Door 2 was $LSK . The question: does the $0.2236 shelf hold? 11:00 UTC closed $0.2171 — under the shelf AND under the $0.21960 new-low line. Shelf broken, new low on closed candles, RSI 26.5, buried under EMA20 $0.2415 / EMA50 $0.2349. -25.6% 24h on $20.7M / 240.6k trades; rank #469, $47.2M mcap, -99.4% off $34.92. The October-31 shutdown fuel is spent and the closed-candle low $0.2160 is the only floor with a name.
Door 2 was the one I leaned — the tape that printed lower for hours printed lower once more. Not a call, either way. Both doors were verdicts, not predictions, and the tape printed both.
New lines: PROM — closed hour back above $5.652 reopens the leg; below $5.594 the give-back has legs; $6.481 the ceiling, $4.82 the floor. LSK — close back above $0.2236 retakes the shelf; below $0.2160 is deeper air, $0.1630 the terminal line.
18:30 IST: PROM's 12:00 candle closes above $5.652, or LSK takes out the $0.2160 floor — which prints first?
3

·
--
Cash Cat hat gerade einen Gewinn von 56 MILLIONEN Prozent in 24 Stunden gepostet – ist das der verrückteste Pump von 2024 oder ein massiver Datenfehler?
Aktuell auf Platz #269 mit einer Marktkapitalisierung von 95 Mio. $ ist CASHCAT bei rund 0,097 $ im Handel – mit einer atemberaubenden täglichen Handelsmenge von 92 Mio. $. Diese Menge kommt nahezu an die gesamte Marktkapitalisierung heran und signalisiert eine extreme Spekulationshysterie. Für Einsteiger: Ein Sprung von 56.000.000 % bedeutet in der Regel, dass der Token mit nahezu keiner Liquidität oder einem extrem niedrigen Preis gestartet ist – daher ist die Prozentzahl mathematisch riesig, praktisch aber gefährlich. Ein großer Verkauf kann den Preis sofort einbrechen lassen.
Das sieht nach einem klassischen Low-Cap-Meme-Coin-Lotterieschein aus. Hoher Gewinn? Vielleicht. Hohes Risiko? Absolut. Prüfe immer die Contract-Verifizierung und Liquiditäts-Sperren, bevor du blind reingehst (aping). Investiere niemals Geld, das du nicht verlieren kannst – besonders nicht bei Assets, die sich so schnell bewegen.
#CASHCAT #MemeCoin
Würdest du einen 56M%-Pump jagen oder bei sichereren Blue-Chip-Assets bleiben?
Cash Cat hat gerade einen Gewinn von 56 MILLIONEN Prozent in 24 Stunden gepostet – ist das der verrückteste Pump von 2024 oder ein massiver Datenfehler?
Aktuell auf Platz #269 mit einer Marktkapitalisierung von 95 Mio. $ ist CASHCAT bei rund 0,097 $ im Handel – mit einer atemberaubenden täglichen Handelsmenge von 92 Mio. $. Diese Menge kommt nahezu an die gesamte Marktkapitalisierung heran und signalisiert eine extreme Spekulationshysterie. Für Einsteiger: Ein Sprung von 56.000.000 % bedeutet in der Regel, dass der Token mit nahezu keiner Liquidität oder einem extrem niedrigen Preis gestartet ist – daher ist die Prozentzahl mathematisch riesig, praktisch aber gefährlich. Ein großer Verkauf kann den Preis sofort einbrechen lassen.
Das sieht nach einem klassischen Low-Cap-Meme-Coin-Lotterieschein aus. Hoher Gewinn? Vielleicht. Hohes Risiko? Absolut. Prüfe immer die Contract-Verifizierung und Liquiditäts-Sperren, bevor du blind reingehst (aping). Investiere niemals Geld, das du nicht verlieren kannst – besonders nicht bei Assets, die sich so schnell bewegen.
#CASHCAT #MemeCoin
Würdest du einen 56M%-Pump jagen oder bei sichereren Blue-Chip-Assets bleiben?
Aktuell auf Platz #269 mit einer Marktkapitalisierung von 95 Mio. $ ist CASHCAT bei rund 0,097 $ im Handel – mit einer atemberaubenden täglichen Handelsmenge von 92 Mio. $. Diese Menge kommt nahezu an die gesamte Marktkapitalisierung heran und signalisiert eine extreme Spekulationshysterie. Für Einsteiger: Ein Sprung von 56.000.000 % bedeutet in der Regel, dass der Token mit nahezu keiner Liquidität oder einem extrem niedrigen Preis gestartet ist – daher ist die Prozentzahl mathematisch riesig, praktisch aber gefährlich. Ein großer Verkauf kann den Preis sofort einbrechen lassen.
Das sieht nach einem klassischen Low-Cap-Meme-Coin-Lotterieschein aus. Hoher Gewinn? Vielleicht. Hohes Risiko? Absolut. Prüfe immer die Contract-Verifizierung und Liquiditäts-Sperren, bevor du blind reingehst (aping). Investiere niemals Geld, das du nicht verlieren kannst – besonders nicht bei Assets, die sich so schnell bewegen.
#CASHCAT #MemeCoin
Würdest du einen 56M%-Pump jagen oder bei sichereren Blue-Chip-Assets bleiben?
66

·
--
Übersetzung ansehen
注意!UAI 重要时间点直线拉升2.9%,回踩哪里能接?15:52(9分钟前)UAI 在重要时间点出现拉升2.9%(5分钟窗口 15:47→15:52),截至 16:02:34 现价 0.3678,24h +22.0%。同批异动还有 GTC、BLUAI。
📅 数据截至 16:02:34(事件触发时间见各条标注,价格为撰稿时实时快照)
📌 一句话看点:重要时段(K线收盘/美股开收盘)的异动多有机构参与,信号成色更高
市场概览:BTC 86,172.10(+3.35%) · ETH 2,738.42(+2.35%);全市场 24h 上涨 329 家 / 下跌 165 家;24h领涨 CT+49.23%,领跌 龙虾-32.99%。
—— 异动详情 ——
一、重要时间点急动
- $UAIUSDT 重要时间点急动 +2.88%(4H收盘) 🕐15:52触发(9分钟前) 〔窗口 15:47→15:52 5分钟〕
现价 0.3678 | 24h +22.03%
价差 0.05% | 24h额 $33.1M | 换手 12.2% | CMC #269
市值 $87.9M | 稀释 $367.8M | 距史低 16.72x(史低 0.022)
支撑 S1 0.3349(-8.9% 强·触15次·放量1) · S2 0.3248(-11.7% 强·触2次·共振) · S3 0.3121(-15.2% 强·触6次·放量1) · S4 0.308(-16.3% 强·触3次·放量1) · 史低 0.022(-94.0% 弱·未验证)
建仓 偏多·不追高 | 入场 回踩 0.3349 40% / 0.3248 40% / 0.3121 20% | 止损 0.2999(-18.5%·1ATR) | 目标 0.3719 | 仓位≤10%·杠杆≤3x
指标 RSI 72超买 | MACD 金叉 | BOLL 上轨区 | KDJ 95超买 | 均线多头 | ATR 3.3% | 量比 1.3x | 费率 +0.0114%
策略 顺势回踩接多·超买减配 | 分批: S1 40%→S2 40%→S3 20% | 加仓: 前批浮盈≥1ATR再接次批 | 移动止损: 浮盈≥1.5ATR止损推至成本, ≥3ATR改1ATR跟踪 | 失效: 放量跌破S3 | 48h未成交撤单
🔬 硬核技术分析(UAIUSDT)
· 趋势结构: 1h偏多/日线未共振(25/40)
· 形态结构: 低点持续抬高·偏多结构
· 量价关系: 近24h均量放大5.0x,上涨放量·结构健康(15/15)
· 动量状态: RSI 72(超买); MACD柱 收敛/反转(3/15)
· 背离检测: 无显著背离(+0)
· 波动率: 1h ATR占比 3.3%,处近7日 79 分位
· 多空力量: 近48根多头占比 56%;下影 36% vs 上影 28%
· 综合评分: 43/100 → 中性(趋势40+量价15+动量15+背离±10;≥60偏多,≤40偏空)
- $GTCUSDT 重要时间点急动 -2.34%(4H收盘) 🕐15:54触发(8分钟前) 〔窗口 15:49→15:54 5分钟〕
现价 0.1269 | 24h +29.60% | 现货 0.1267 | 基差 -0.20%
价差 0.07% | 24h额 $176.7M | 换手 659.8% | CMC #926
市值 $11.3M | 稀释 $12.9M | 距史低 1.97x(史低 0.06436)
支撑 S1 0.1216(-4.2% 弱·未验证) · S2 0.1052(-17.1% 弱·未验证) · S3 0.09583(-24.5% 强·触2次) · S4 0.09263(-27.0% 强·触4次) · 史低 0.06436(-49.3% 弱·未验证)
建仓 偏空·不接飞刀 | 入场 反抽 0.1838 50% | 止损 0.1957(+54.2%·1ATR) | 目标 S1 0.1216 / S2 0.1052 | 仓位≤10%·杠杆≤3x
指标 RSI 49 | MACD 空头 | BOLL 下轨区 | KDJ -20超卖 | 均线缠绕 | ATR 9.4% | 量比 1.2x | 费率 -0.1756%偏空拥挤
策略 震荡反抽做空·空头拥挤 | 分批: R1 50%→R2 50% | 加仓: 前批浮盈≥1ATR再接次批 | 移动止损: 浮盈≥1.5ATR止损推至成本, ≥3ATR改1ATR跟踪 | 失效: 放量突破R2 | 48h未成交撤单
- $BLUAIUSDT 重要时间点急动 +2.32%(4H收盘) 🕐15:57触发(5分钟前) 〔窗口 15:52→15:57 5分钟〕
现价 0.009097 | 24h -6.58%
价差 0.04% | 24h额 $6.0M | 换手 40.0% | CMC #933
市值 $11.1M | 稀释 $90.5M | 距史低 2.22x(史低 0.004093)
支撑 S1 0.008961(-1.5% 弱·未验证) · S2 0.008842(-2.8% 弱·触1次·放量1) · S3 0.007396(-18.7% 中·触1次·放量1·共振) · 史低 0.004093(-55.0% 弱·未验证)
建仓 偏多·不追高 | 入场 回踩 0.008961 40% / 0.008842 40% / 0.007396 20% | 止损 0.007128(-21.6%·1ATR) | 目标 0.009802 / 0.01004 | 仓位≤10%·杠杆≤3x
指标 RSI 53 | MACD 多头 | BOLL 上轨区 | KDJ 109超买 | 均线缠绕 | ATR 2.9% | 量比 0.5x | 费率 +0.0050%
策略 震荡回踩接多 | 分批: S1 40%→S2 40%→S3 20% | 加仓: 前批浮盈≥1ATR再接次批 | 移动止损: 浮盈≥1.5ATR止损推至成本, ≥3ATR改1ATR跟踪 | 失效: 放量跌破S3 | 48h未成交撤单
▶ 异动发生在重要时间窗口(K线收盘/美股开收盘),机构调仓与资金再平衡集中,该时段信号有效性通常更高,注意顺势延续与假突破的双向风险。
—— 互动 ——
你在盯 UAI 吗?评论区聊聊你的看法👇 关注我,异动 + 支撑 + 建仓策略第一时间推送。
数据来源:币安现货/合约实时行情与盘口、CMC 聚合数据;16:02:34 撰稿,事件均在 30 分钟时效内;仅供参考,不构成投资建议。
注意!UAI 重要时间点直线拉升2.9%,回踩哪里能接?
15:52(9分钟前)UAI 在重要时间点出现拉升2.9%(5分钟窗口 15:47→15:52),截至 16:02:34 现价 0.3678,24h +22.0%。同批异动还有 GTC、BLUAI。
📅 数据截至 16:02:34(事件触发时间见各条标注,价格为撰稿时实时快照)
📌 一句话看点:重要时段(K线收盘/美股开收盘)的异动多有机构参与,信号成色更高
市场概览:BTC 86,172.10(+3.35%) · ETH 2,738.42(+2.35%);全市场 24h 上涨 329 家 / 下跌 165 家;24h领涨 CT+49.23%,领跌 龙虾-32.99%。
—— 异动详情 ——
一、重要时间点急动
- $UAIUSDT 重要时间点急动 +2.88%(4H收盘) 🕐15:52触发(9分钟前) 〔窗口 15:47→15:52 5分钟〕
现价 0.3678 | 24h +22.03%
价差 0.05% | 24h额 $33.1M | 换手 12.2% | CMC #269
市值 $87.9M | 稀释 $367.8M | 距史低 16.72x(史低 0.022)
支撑 S1 0.3349(-8.9% 强·触15次·放量1) · S2 0.3248(-11.7% 强·触2次·共振) · S3 0.3121(-15.2% 强·触6次·放量1) · S4 0.308(-16.3% 强·触3次·放量1) · 史低 0.022(-94.0% 弱·未验证)
建仓 偏多·不追高 | 入场 回踩 0.3349 40% / 0.3248 40% / 0.3121 20% | 止损 0.2999(-18.5%·1ATR) | 目标 0.3719 | 仓位≤10%·杠杆≤3x
指标 RSI 72超买 | MACD 金叉 | BOLL 上轨区 | KDJ 95超买 | 均线多头 | ATR 3.3% | 量比 1.3x | 费率 +0.0114%
策略 顺势回踩接多·超买减配 | 分批: S1 40%→S2 40%→S3 20% | 加仓: 前批浮盈≥1ATR再接次批 | 移动止损: 浮盈≥1.5ATR止损推至成本, ≥3ATR改1ATR跟踪 | 失效: 放量跌破S3 | 48h未成交撤单
🔬 硬核技术分析(UAIUSDT)
· 趋势结构: 1h偏多/日线未共振(25/40)
· 形态结构: 低点持续抬高·偏多结构
· 量价关系: 近24h均量放大5.0x,上涨放量·结构健康(15/15)
· 动量状态: RSI 72(超买); MACD柱 收敛/反转(3/15)
· 背离检测: 无显著背离(+0)
· 波动率: 1h ATR占比 3.3%,处近7日 79 分位
· 多空力量: 近48根多头占比 56%;下影 36% vs 上影 28%
· 综合评分: 43/100 → 中性(趋势40+量价15+动量15+背离±10;≥60偏多,≤40偏空)
- $GTCUSDT 重要时间点急动 -2.34%(4H收盘) 🕐15:54触发(8分钟前) 〔窗口 15:49→15:54 5分钟〕
现价 0.1269 | 24h +29.60% | 现货 0.1267 | 基差 -0.20%
价差 0.07% | 24h额 $176.7M | 换手 659.8% | CMC #926
市值 $11.3M | 稀释 $12.9M | 距史低 1.97x(史低 0.06436)
支撑 S1 0.1216(-4.2% 弱·未验证) · S2 0.1052(-17.1% 弱·未验证) · S3 0.09583(-24.5% 强·触2次) · S4 0.09263(-27.0% 强·触4次) · 史低 0.06436(-49.3% 弱·未验证)
建仓 偏空·不接飞刀 | 入场 反抽 0.1838 50% | 止损 0.1957(+54.2%·1ATR) | 目标 S1 0.1216 / S2 0.1052 | 仓位≤10%·杠杆≤3x
指标 RSI 49 | MACD 空头 | BOLL 下轨区 | KDJ -20超卖 | 均线缠绕 | ATR 9.4% | 量比 1.2x | 费率 -0.1756%偏空拥挤
策略 震荡反抽做空·空头拥挤 | 分批: R1 50%→R2 50% | 加仓: 前批浮盈≥1ATR再接次批 | 移动止损: 浮盈≥1.5ATR止损推至成本, ≥3ATR改1ATR跟踪 | 失效: 放量突破R2 | 48h未成交撤单
- $BLUAIUSDT 重要时间点急动 +2.32%(4H收盘) 🕐15:57触发(5分钟前) 〔窗口 15:52→15:57 5分钟〕
现价 0.009097 | 24h -6.58%
价差 0.04% | 24h额 $6.0M | 换手 40.0% | CMC #933
市值 $11.1M | 稀释 $90.5M | 距史低 2.22x(史低 0.004093)
支撑 S1 0.008961(-1.5% 弱·未验证) · S2 0.008842(-2.8% 弱·触1次·放量1) · S3 0.007396(-18.7% 中·触1次·放量1·共振) · 史低 0.004093(-55.0% 弱·未验证)
建仓 偏多·不追高 | 入场 回踩 0.008961 40% / 0.008842 40% / 0.007396 20% | 止损 0.007128(-21.6%·1ATR) | 目标 0.009802 / 0.01004 | 仓位≤10%·杠杆≤3x
指标 RSI 53 | MACD 多头 | BOLL 上轨区 | KDJ 109超买 | 均线缠绕 | ATR 2.9% | 量比 0.5x | 费率 +0.0050%
策略 震荡回踩接多 | 分批: S1 40%→S2 40%→S3 20% | 加仓: 前批浮盈≥1ATR再接次批 | 移动止损: 浮盈≥1.5ATR止损推至成本, ≥3ATR改1ATR跟踪 | 失效: 放量跌破S3 | 48h未成交撤单
▶ 异动发生在重要时间窗口(K线收盘/美股开收盘),机构调仓与资金再平衡集中,该时段信号有效性通常更高,注意顺势延续与假突破的双向风险。
—— 互动 ——
你在盯 UAI 吗?评论区聊聊你的看法👇 关注我,异动 + 支撑 + 建仓策略第一时间推送。
数据来源:币安现货/合约实时行情与盘口、CMC 聚合数据;16:02:34 撰稿,事件均在 30 分钟时效内;仅供参考,不构成投资建议。
📅 数据截至 16:02:34(事件触发时间见各条标注,价格为撰稿时实时快照)
📌 一句话看点:重要时段(K线收盘/美股开收盘)的异动多有机构参与,信号成色更高
市场概览:BTC 86,172.10(+3.35%) · ETH 2,738.42(+2.35%);全市场 24h 上涨 329 家 / 下跌 165 家;24h领涨 CT+49.23%,领跌 龙虾-32.99%。
—— 异动详情 ——
一、重要时间点急动
- $UAIUSDT 重要时间点急动 +2.88%(4H收盘) 🕐15:52触发(9分钟前) 〔窗口 15:47→15:52 5分钟〕
现价 0.3678 | 24h +22.03%
价差 0.05% | 24h额 $33.1M | 换手 12.2% | CMC #269
市值 $87.9M | 稀释 $367.8M | 距史低 16.72x(史低 0.022)
支撑 S1 0.3349(-8.9% 强·触15次·放量1) · S2 0.3248(-11.7% 强·触2次·共振) · S3 0.3121(-15.2% 强·触6次·放量1) · S4 0.308(-16.3% 强·触3次·放量1) · 史低 0.022(-94.0% 弱·未验证)
建仓 偏多·不追高 | 入场 回踩 0.3349 40% / 0.3248 40% / 0.3121 20% | 止损 0.2999(-18.5%·1ATR) | 目标 0.3719 | 仓位≤10%·杠杆≤3x
指标 RSI 72超买 | MACD 金叉 | BOLL 上轨区 | KDJ 95超买 | 均线多头 | ATR 3.3% | 量比 1.3x | 费率 +0.0114%
策略 顺势回踩接多·超买减配 | 分批: S1 40%→S2 40%→S3 20% | 加仓: 前批浮盈≥1ATR再接次批 | 移动止损: 浮盈≥1.5ATR止损推至成本, ≥3ATR改1ATR跟踪 | 失效: 放量跌破S3 | 48h未成交撤单
🔬 硬核技术分析(UAIUSDT)
· 趋势结构: 1h偏多/日线未共振(25/40)
· 形态结构: 低点持续抬高·偏多结构
· 量价关系: 近24h均量放大5.0x,上涨放量·结构健康(15/15)
· 动量状态: RSI 72(超买); MACD柱 收敛/反转(3/15)
· 背离检测: 无显著背离(+0)
· 波动率: 1h ATR占比 3.3%,处近7日 79 分位
· 多空力量: 近48根多头占比 56%;下影 36% vs 上影 28%
· 综合评分: 43/100 → 中性(趋势40+量价15+动量15+背离±10;≥60偏多,≤40偏空)
- $GTCUSDT 重要时间点急动 -2.34%(4H收盘) 🕐15:54触发(8分钟前) 〔窗口 15:49→15:54 5分钟〕
现价 0.1269 | 24h +29.60% | 现货 0.1267 | 基差 -0.20%
价差 0.07% | 24h额 $176.7M | 换手 659.8% | CMC #926
市值 $11.3M | 稀释 $12.9M | 距史低 1.97x(史低 0.06436)
支撑 S1 0.1216(-4.2% 弱·未验证) · S2 0.1052(-17.1% 弱·未验证) · S3 0.09583(-24.5% 强·触2次) · S4 0.09263(-27.0% 强·触4次) · 史低 0.06436(-49.3% 弱·未验证)
建仓 偏空·不接飞刀 | 入场 反抽 0.1838 50% | 止损 0.1957(+54.2%·1ATR) | 目标 S1 0.1216 / S2 0.1052 | 仓位≤10%·杠杆≤3x
指标 RSI 49 | MACD 空头 | BOLL 下轨区 | KDJ -20超卖 | 均线缠绕 | ATR 9.4% | 量比 1.2x | 费率 -0.1756%偏空拥挤
策略 震荡反抽做空·空头拥挤 | 分批: R1 50%→R2 50% | 加仓: 前批浮盈≥1ATR再接次批 | 移动止损: 浮盈≥1.5ATR止损推至成本, ≥3ATR改1ATR跟踪 | 失效: 放量突破R2 | 48h未成交撤单
- $BLUAIUSDT 重要时间点急动 +2.32%(4H收盘) 🕐15:57触发(5分钟前) 〔窗口 15:52→15:57 5分钟〕
现价 0.009097 | 24h -6.58%
价差 0.04% | 24h额 $6.0M | 换手 40.0% | CMC #933
市值 $11.1M | 稀释 $90.5M | 距史低 2.22x(史低 0.004093)
支撑 S1 0.008961(-1.5% 弱·未验证) · S2 0.008842(-2.8% 弱·触1次·放量1) · S3 0.007396(-18.7% 中·触1次·放量1·共振) · 史低 0.004093(-55.0% 弱·未验证)
建仓 偏多·不追高 | 入场 回踩 0.008961 40% / 0.008842 40% / 0.007396 20% | 止损 0.007128(-21.6%·1ATR) | 目标 0.009802 / 0.01004 | 仓位≤10%·杠杆≤3x
指标 RSI 53 | MACD 多头 | BOLL 上轨区 | KDJ 109超买 | 均线缠绕 | ATR 2.9% | 量比 0.5x | 费率 +0.0050%
策略 震荡回踩接多 | 分批: S1 40%→S2 40%→S3 20% | 加仓: 前批浮盈≥1ATR再接次批 | 移动止损: 浮盈≥1.5ATR止损推至成本, ≥3ATR改1ATR跟踪 | 失效: 放量跌破S3 | 48h未成交撤单
▶ 异动发生在重要时间窗口(K线收盘/美股开收盘),机构调仓与资金再平衡集中,该时段信号有效性通常更高,注意顺势延续与假突破的双向风险。
—— 互动 ——
你在盯 UAI 吗?评论区聊聊你的看法👇 关注我,异动 + 支撑 + 建仓策略第一时间推送。
数据来源:币安现货/合约实时行情与盘口、CMC 聚合数据;16:02:34 撰稿,事件均在 30 分钟时效内;仅供参考,不构成投资建议。
25


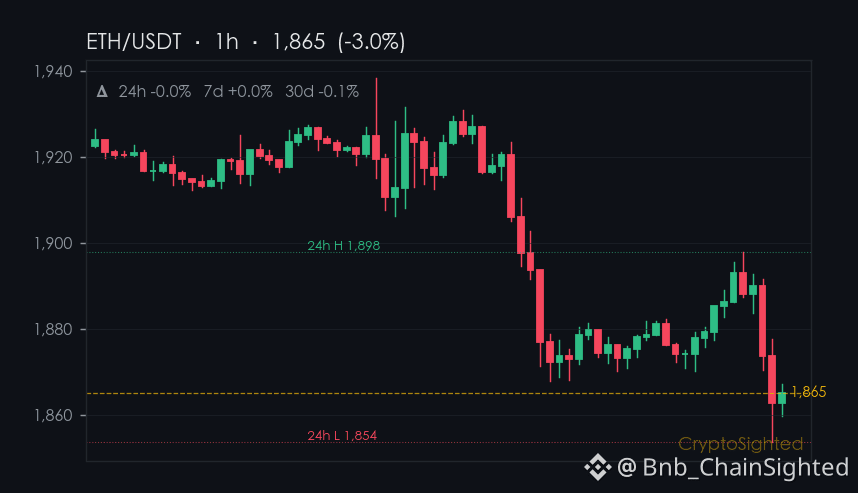
0,9 % – das ist der 7-Tage-Rückgang für $ETH, und das ist nicht nur ein kurzer Ausreißer.
Der 30-Tage-Zugewinn von ETH von ↑5,0 % wirkt wie ein falscher Sicherheitsboden, während die eigenen Zahlen des Ökosystems eine andere Geschichte erzählen.
Der Q2-Report von SharpLink, der auf einen durch ETHs Rückgang befeuerten Nettoverlust hinweist, deutet auf ein tiefer liegendes Problem hin: Die Ethereum-Infrastruktur verliert an Wert, selbst wenn sich der Preis in den letzten 7 Tagen kaum bewegt.
Das ist nicht nur eine kurzfristige Korrektur. Es ist ein struktureller Wandel – einer, der die Regeln für DeFi leise neu schreibt.
Kann die Ethereum-Infrastruktur ihre 56,4 % dominierende, $BTC-gebundene Stellung noch rechtfertigen, wenn ihr eigenes Ökosystem unter Druck steht?
—
Keine Finanzberatung. Informiere dich selbst (DYOR).
📌 Hotspot Watch · #269 · #CryptoTrends #CryptoSighted $ETH
0,9 % – das ist der 7-Tage-Rückgang für $ETH , und das ist nicht nur ein kurzer Ausreißer.
Der 30-Tage-Zugewinn von ETH von ↑5,0 % wirkt wie ein falscher Sicherheitsboden, während die eigenen Zahlen des Ökosystems eine andere Geschichte erzählen.
Der Q2-Report von SharpLink, der auf einen durch ETHs Rückgang befeuerten Nettoverlust hinweist, deutet auf ein tiefer liegendes Problem hin: Die Ethereum-Infrastruktur verliert an Wert, selbst wenn sich der Preis in den letzten 7 Tagen kaum bewegt.
Das ist nicht nur eine kurzfristige Korrektur. Es ist ein struktureller Wandel – einer, der die Regeln für DeFi leise neu schreibt.
Kann die Ethereum-Infrastruktur ihre 56,4 % dominierende, $BTC -gebundene Stellung noch rechtfertigen, wenn ihr eigenes Ökosystem unter Druck steht?
—
Keine Finanzberatung. Informiere dich selbst (DYOR).
📌 Hotspot Watch · #269 · #CryptoTrends #CryptoSighted $ETH
Der 30-Tage-Zugewinn von ETH von ↑5,0 % wirkt wie ein falscher Sicherheitsboden, während die eigenen Zahlen des Ökosystems eine andere Geschichte erzählen.
Der Q2-Report von SharpLink, der auf einen durch ETHs Rückgang befeuerten Nettoverlust hinweist, deutet auf ein tiefer liegendes Problem hin: Die Ethereum-Infrastruktur verliert an Wert, selbst wenn sich der Preis in den letzten 7 Tagen kaum bewegt.
Das ist nicht nur eine kurzfristige Korrektur. Es ist ein struktureller Wandel – einer, der die Regeln für DeFi leise neu schreibt.
Kann die Ethereum-Infrastruktur ihre 56,4 % dominierende, $BTC -gebundene Stellung noch rechtfertigen, wenn ihr eigenes Ökosystem unter Druck steht?
—
Keine Finanzberatung. Informiere dich selbst (DYOR).
📌 Hotspot Watch · #269 · #CryptoTrends #CryptoSighted $ETH
82

·
--
Übersetzung ansehen
** Teknik Analizde Destek ve Direnç Noktaları Nasıl Belirlenir? 🕒Zano (ZANOUSDT) is trending right now!
Rank: #269
** Teknik analiz, kripto para ticaretinde önemli bir rol oynar. Destek ve direnç noktalarını belirlemek, yatırımcıların piyasa trendlerini daha iyi anlamalarına yardımcı olur. 📊 **Adım 1: Grafik Türünü Seçin** İlk adım, kripto para biriminin fiyat grafiğini açmaktır. Çoğu trader, **mum grafiği** veya **çubuk grafiği** kullanır. Şöyle düşün: Grafik, piyasanın nabzını gösterir. 💡 **Adım 2: Zaman Çerçevesini Belirleyin** Zaman çerçevesi, analizinizin detay seviyesini belirler. Kısa vadeli traderlar **1 saatlik** veya **4 saatlik** grafiklerle çalışırken, uzun vadeli yatırımcılar **günlük** veya **haftalık** grafiklere bakar. 🕒 **Adım 3: Destek ve Direnç Noktalarını Bulun** Destek noktaları, fiyatın düştüğü ancak geri döndüğü seviyelerdir. Direnç noktaları ise fiyatın yükseldiği ancak geri çekildiği seviyelerdir. 📈 Örnek: 4 saatlik grafikte, son 48 saat içinde 80.000 $ seviyesinde destek noktası oluştuğunu görüyoruz. Fiyat bu seviyeye düştü ancak geri döndü. Aynı grafikte, 82.000 $ seviyesinde direnç noktası olduğunu da görüyoruz. 🚀 **Adım 4: Trend Çizgileri Çekin** Trend çizgileri, destek ve direnç noktalarını birleştirerek piyasa trendini gösterir. Yukarı trend çizgisi, yükseliş trendini gösterirken, aşağı trend çizgisi düşüş trendini gösterir. 📉 **Adım 5: Pratik Uygulama** Şimdi, günlük grafikte destek ve direnç noktalarını belirleyelim. Grafikte, 2.500 $ seviyesinde destek noktası oluştuğunu görüyoruz
** Teknik Analizde Destek ve Direnç Noktaları Nasıl Belirlenir? 🕒
Zano (ZANOUSDT) is trending right now!
Rank: #269
** Teknik analiz, kripto para ticaretinde önemli bir rol oynar. Destek ve direnç noktalarını belirlemek, yatırımcıların piyasa trendlerini daha iyi anlamalarına yardımcı olur. 📊 **Adım 1: Grafik Türünü Seçin** İlk adım, kripto para biriminin fiyat grafiğini açmaktır. Çoğu trader, **mum grafiği** veya **çubuk grafiği** kullanır. Şöyle düşün: Grafik, piyasanın nabzını gösterir. 💡 **Adım 2: Zaman Çerçevesini Belirleyin** Zaman çerçevesi, analizinizin detay seviyesini belirler. Kısa vadeli traderlar **1 saatlik** veya **4 saatlik** grafiklerle çalışırken, uzun vadeli yatırımcılar **günlük** veya **haftalık** grafiklere bakar. 🕒 **Adım 3: Destek ve Direnç Noktalarını Bulun** Destek noktaları, fiyatın düştüğü ancak geri döndüğü seviyelerdir. Direnç noktaları ise fiyatın yükseldiği ancak geri çekildiği seviyelerdir. 📈 Örnek: 4 saatlik grafikte, son 48 saat içinde 80.000 $ seviyesinde destek noktası oluştuğunu görüyoruz. Fiyat bu seviyeye düştü ancak geri döndü. Aynı grafikte, 82.000 $ seviyesinde direnç noktası olduğunu da görüyoruz. 🚀 **Adım 4: Trend Çizgileri Çekin** Trend çizgileri, destek ve direnç noktalarını birleştirerek piyasa trendini gösterir. Yukarı trend çizgisi, yükseliş trendini gösterirken, aşağı trend çizgisi düşüş trendini gösterir. 📉 **Adım 5: Pratik Uygulama** Şimdi, günlük grafikte destek ve direnç noktalarını belirleyelim. Grafikte, 2.500 $ seviyesinde destek noktası oluştuğunu görüyoruz
Rank: #269
** Teknik analiz, kripto para ticaretinde önemli bir rol oynar. Destek ve direnç noktalarını belirlemek, yatırımcıların piyasa trendlerini daha iyi anlamalarına yardımcı olur. 📊 **Adım 1: Grafik Türünü Seçin** İlk adım, kripto para biriminin fiyat grafiğini açmaktır. Çoğu trader, **mum grafiği** veya **çubuk grafiği** kullanır. Şöyle düşün: Grafik, piyasanın nabzını gösterir. 💡 **Adım 2: Zaman Çerçevesini Belirleyin** Zaman çerçevesi, analizinizin detay seviyesini belirler. Kısa vadeli traderlar **1 saatlik** veya **4 saatlik** grafiklerle çalışırken, uzun vadeli yatırımcılar **günlük** veya **haftalık** grafiklere bakar. 🕒 **Adım 3: Destek ve Direnç Noktalarını Bulun** Destek noktaları, fiyatın düştüğü ancak geri döndüğü seviyelerdir. Direnç noktaları ise fiyatın yükseldiği ancak geri çekildiği seviyelerdir. 📈 Örnek: 4 saatlik grafikte, son 48 saat içinde 80.000 $ seviyesinde destek noktası oluştuğunu görüyoruz. Fiyat bu seviyeye düştü ancak geri döndü. Aynı grafikte, 82.000 $ seviyesinde direnç noktası olduğunu da görüyoruz. 🚀 **Adım 4: Trend Çizgileri Çekin** Trend çizgileri, destek ve direnç noktalarını birleştirerek piyasa trendini gösterir. Yukarı trend çizgisi, yükseliş trendini gösterirken, aşağı trend çizgisi düşüş trendini gösterir. 📉 **Adım 5: Pratik Uygulama** Şimdi, günlük grafikte destek ve direnç noktalarını belirleyelim. Grafikte, 2.500 $ seviyesinde destek noktası oluştuğunu görüyoruz
3
Anmelden und weiter Inhalte entdecken
Krypto-Nutzer weltweit auf Binance Square kennenlernen
⚡️ Bleib in Sachen Krypto stets am Puls.
💬 Die weltgrößte Kryptobörse vertraut darauf.
👍 Erhalte verlässliche Einblicke von verifizierten Creators.
E-Mail-Adresse/Telefonnummer
Trendthemen
1
#USMidterms-WhatAreMarketsExpecting?
124,368 Aufrufe
975 Kommentare
2
#USOctoberNFP-AreRateCutsStillPossible
266,971 Aufrufe
2,077 Kommentare
3
#CircleQ3Revenue865M
20 Aufrufe
42 Kommentare
4
#AMDBeatsExpectations-AINarrativeContinues
30,319 Aufrufe
371 Kommentare
5
#BinanceIncidentReport
281,394 Aufrufe
1,514 Kommentare
6
#AnthropicIPOPricedDownasInvestorsEye$1.5T
19,888 Aufrufe
113 Kommentare
7
#HongKongPassesCryptoAssetReportingFrameworkAmendment
28 Aufrufe
6 Kommentare
8
#37thQuarterlyBNBBurnRemoves1.64MillionBNB
1,961 Aufrufe
74 Kommentare
9
#BinanceReopensWithdrawalsForMoreAssets
387,002 Aufrufe
2,450 Kommentare
10
#HongKongToLicenseVirtualAssetCustodyAndAdvisory
4,142 Aufrufe
110 Kommentare