
The Crypto Basic
7.7k Posts

The Crypto Basic
 Square Verified+
Report
Block User
Your Ultimate Crypto News Source
0 Following
36.3K+ Followers
165.9K+ Liked
Posts
Article
"Cardano Network Activity Rises Sharply as Daily Transactions Soar 33% Hit 32,841"#Cardano has recorded a sharp increase in network activity, with daily transactions climbing significantly over the past 24 hours.
According to data highlighted by blockchain fundamentals platform Chainspect, the network processed more than 24,000 transactions on Wednesday, marking its highest daily throughput of the previous week.
Cardano Transaction Volume Chart
The momentum has continued, with Cardano’s daily transaction count rising another 33% over 24 hours to 32,841 at press time. At press time, the network was processing 0.38 transactions per second, with an average block time of 20.2 seconds.
This surge adds to Cardano’s growing cumulative transaction count. Since its launch in September 2017, the blockchain has processed approximately 123.02 million transactions.
Cardano Maintains Strong Developer Activity
Beyond transaction growth, Cardano continues to demonstrate strong developer activity.
Chainspect currently records 303,143 commits for the network, placing Cardano among the leading blockchain ecosystems by development activity. However, the exact ranking can fluctuate as the underlying data changes.
Polkadot remains ahead with more than 701,000 commits, while Ethereum has recorded over 520,000. Nevertheless, Cardano ranks ahead of several major ecosystems, including Arbitrum and Optimism, which currently have roughly 200,000 and 182,000 commits, respectively. This comes as Cardano continues to work on major projects, including Ouroboros Leios, Hydra, and RealFi.
Cardano DeFi Activity Gains Momentum as ADA Nears $0.21
Meanwhile, Cardano’s DeFi sector has also shown signs of renewed activity, according to data from DeFiLlama.
The network’s total value locked (TVL) has increased 6.05% over the past 24 hours to $58.01 million. Additionally, decentralized exchange volume has climbed 22.42% over the past week to $9.15 million.
These gains come as ADA records a notable price recovery amid a broader market rally. Cardano is currently trading near the $0.21 level. Over the past 24 hours, ADA has surged 13.08% to $0.2082, extending its monthly gains to 21.35%.
Despite the strong recovery, Cardano remains the 15th-largest crypto by market cap, with a valuation of $7.6 billion. At the same time, its trading volume has jumped 52% over the past day to $804.78 million.
The combination of rising transaction activity, sustained developer engagement, stronger DeFi metrics, and ADA’s latest price gains highlights growing momentum across the Cardano ecosystem.
#CryptonewswithJack
"Cardano Network Activity Rises Sharply as Daily Transactions Soar 33% Hit 32,841"
#Cardano has recorded a sharp increase in network activity, with daily transactions climbing significantly over the past 24 hours.
According to data highlighted by blockchain fundamentals platform Chainspect, the network processed more than 24,000 transactions on Wednesday, marking its highest daily throughput of the previous week.
Cardano Transaction Volume Chart
The momentum has continued, with Cardano’s daily transaction count rising another 33% over 24 hours to 32,841 at press time. At press time, the network was processing 0.38 transactions per second, with an average block time of 20.2 seconds.
This surge adds to Cardano’s growing cumulative transaction count. Since its launch in September 2017, the blockchain has processed approximately 123.02 million transactions.
Cardano Maintains Strong Developer Activity
Beyond transaction growth, Cardano continues to demonstrate strong developer activity.
Chainspect currently records 303,143 commits for the network, placing Cardano among the leading blockchain ecosystems by development activity. However, the exact ranking can fluctuate as the underlying data changes.
Polkadot remains ahead with more than 701,000 commits, while Ethereum has recorded over 520,000. Nevertheless, Cardano ranks ahead of several major ecosystems, including Arbitrum and Optimism, which currently have roughly 200,000 and 182,000 commits, respectively. This comes as Cardano continues to work on major projects, including Ouroboros Leios, Hydra, and RealFi.
Cardano DeFi Activity Gains Momentum as ADA Nears $0.21
Meanwhile, Cardano’s DeFi sector has also shown signs of renewed activity, according to data from DeFiLlama.
The network’s total value locked (TVL) has increased 6.05% over the past 24 hours to $58.01 million. Additionally, decentralized exchange volume has climbed 22.42% over the past week to $9.15 million.
These gains come as ADA records a notable price recovery amid a broader market rally. Cardano is currently trading near the $0.21 level. Over the past 24 hours, ADA has surged 13.08% to $0.2082, extending its monthly gains to 21.35%.
Despite the strong recovery, Cardano remains the 15th-largest crypto by market cap, with a valuation of $7.6 billion. At the same time, its trading volume has jumped 52% over the past day to $804.78 million.
The combination of rising transaction activity, sustained developer engagement, stronger DeFi metrics, and ADA’s latest price gains highlights growing momentum across the Cardano ecosystem.
#CryptonewswithJack
According to data highlighted by blockchain fundamentals platform Chainspect, the network processed more than 24,000 transactions on Wednesday, marking its highest daily throughput of the previous week.
Cardano Transaction Volume Chart
The momentum has continued, with Cardano’s daily transaction count rising another 33% over 24 hours to 32,841 at press time. At press time, the network was processing 0.38 transactions per second, with an average block time of 20.2 seconds.
This surge adds to Cardano’s growing cumulative transaction count. Since its launch in September 2017, the blockchain has processed approximately 123.02 million transactions.
Cardano Maintains Strong Developer Activity
Beyond transaction growth, Cardano continues to demonstrate strong developer activity.
Chainspect currently records 303,143 commits for the network, placing Cardano among the leading blockchain ecosystems by development activity. However, the exact ranking can fluctuate as the underlying data changes.
Polkadot remains ahead with more than 701,000 commits, while Ethereum has recorded over 520,000. Nevertheless, Cardano ranks ahead of several major ecosystems, including Arbitrum and Optimism, which currently have roughly 200,000 and 182,000 commits, respectively. This comes as Cardano continues to work on major projects, including Ouroboros Leios, Hydra, and RealFi.
Cardano DeFi Activity Gains Momentum as ADA Nears $0.21
Meanwhile, Cardano’s DeFi sector has also shown signs of renewed activity, according to data from DeFiLlama.
The network’s total value locked (TVL) has increased 6.05% over the past 24 hours to $58.01 million. Additionally, decentralized exchange volume has climbed 22.42% over the past week to $9.15 million.
These gains come as ADA records a notable price recovery amid a broader market rally. Cardano is currently trading near the $0.21 level. Over the past 24 hours, ADA has surged 13.08% to $0.2082, extending its monthly gains to 21.35%.
Despite the strong recovery, Cardano remains the 15th-largest crypto by market cap, with a valuation of $7.6 billion. At the same time, its trading volume has jumped 52% over the past day to $804.78 million.
The combination of rising transaction activity, sustained developer engagement, stronger DeFi metrics, and ADA’s latest price gains highlights growing momentum across the Cardano ecosystem.
#CryptonewswithJack
1
287
Article
"Shiba Inu Team Member Teases Major Announcement From Shytoshi Kusama, Gives Timeline"#Shiba Inu ecosystem team member Vet Kusama has sparked fresh speculation in the SHIB community after hinting that August could bring a major announcement from two prominent figures in the ecosystem.
In a post on X today, Vet Kusama urged the community to stay alert, suggesting that Shytoshi Kusama and Kaal Dhairya could make an announcement before the month ends. He also encouraged Shiba Inu supporters to turn on their notifications so they do not miss the potential development, which he described as “Big News.”
Shytoshi Kusama and Kaal Dhairya Remain Relatively Quiet
Notably, both Shytoshi Kusama and Kaal Dhairya have maintained relatively low profiles on social media throughout much of 2026.
Shytoshi Kusama, the pseudonymous visionary leader associated with the Shiba Inu ecosystem, has largely remained silent on X. His most recent post came on May 13, when he expressed admiration for Dhairya.
Meanwhile, Dhairya has also maintained limited social media activity. His latest referenced X post came on July 25, when he highlighted SHIB’s price surge.
As a result, Vet Kusama’s suggestion that the two developers could soon make an announcement has renewed curiosity among SHIB holders.
R.OS Could Influence Shytoshi’s Next Move
One factor fueling the speculation is Shytoshi Kusama’s apparent shift in focus this year. Rather than remaining highly active in Shiba Inu-related discussions, Kusama has indicated that he has been concentrating on completing R.OS, an independent artificial intelligence project.
His reduced social media presence has consequently raised questions about whether he plans to return to a more prominent role in SHIB development.
However, there is currently no confirmation that the teased announcement will involve R.OS, Shibarium, SHIB, or any other component of the broader ecosystem.
Only 10 Days Remain for the Potential Announcement
Vet Kusama’s comments have also created a sense of urgency as August draws to a close. With just 10 days remaining in the month, members of the SHIB community are increasingly wondering what Kusama and Dhairya might reveal.
However, the nature of the potential announcement remains unclear. Vet Kusama did not provide specific details, while neither Shytoshi Kusama nor Kaal Dhairya has publicly confirmed what they may announce.
Therefore, this speculation should be treated cautiously until the developers provide additional information. For now, Vet Kusama’s comments represent a teaser rather than an official announcement.
#CryptoNewsCommunity
"Shiba Inu Team Member Teases Major Announcement From Shytoshi Kusama, Gives Timeline"
#Shiba Inu ecosystem team member Vet Kusama has sparked fresh speculation in the SHIB community after hinting that August could bring a major announcement from two prominent figures in the ecosystem.
In a post on X today, Vet Kusama urged the community to stay alert, suggesting that Shytoshi Kusama and Kaal Dhairya could make an announcement before the month ends. He also encouraged Shiba Inu supporters to turn on their notifications so they do not miss the potential development, which he described as “Big News.”
Shytoshi Kusama and Kaal Dhairya Remain Relatively Quiet
Notably, both Shytoshi Kusama and Kaal Dhairya have maintained relatively low profiles on social media throughout much of 2026.
Shytoshi Kusama, the pseudonymous visionary leader associated with the Shiba Inu ecosystem, has largely remained silent on X. His most recent post came on May 13, when he expressed admiration for Dhairya.
Meanwhile, Dhairya has also maintained limited social media activity. His latest referenced X post came on July 25, when he highlighted SHIB’s price surge.
As a result, Vet Kusama’s suggestion that the two developers could soon make an announcement has renewed curiosity among SHIB holders.
R.OS Could Influence Shytoshi’s Next Move
One factor fueling the speculation is Shytoshi Kusama’s apparent shift in focus this year. Rather than remaining highly active in Shiba Inu-related discussions, Kusama has indicated that he has been concentrating on completing R.OS, an independent artificial intelligence project.
His reduced social media presence has consequently raised questions about whether he plans to return to a more prominent role in SHIB development.
However, there is currently no confirmation that the teased announcement will involve R.OS, Shibarium, SHIB, or any other component of the broader ecosystem.
Only 10 Days Remain for the Potential Announcement
Vet Kusama’s comments have also created a sense of urgency as August draws to a close. With just 10 days remaining in the month, members of the SHIB community are increasingly wondering what Kusama and Dhairya might reveal.
However, the nature of the potential announcement remains unclear. Vet Kusama did not provide specific details, while neither Shytoshi Kusama nor Kaal Dhairya has publicly confirmed what they may announce.
Therefore, this speculation should be treated cautiously until the developers provide additional information. For now, Vet Kusama’s comments represent a teaser rather than an official announcement.
#CryptoNewsCommunity
In a post on X today, Vet Kusama urged the community to stay alert, suggesting that Shytoshi Kusama and Kaal Dhairya could make an announcement before the month ends. He also encouraged Shiba Inu supporters to turn on their notifications so they do not miss the potential development, which he described as “Big News.”
Shytoshi Kusama and Kaal Dhairya Remain Relatively Quiet
Notably, both Shytoshi Kusama and Kaal Dhairya have maintained relatively low profiles on social media throughout much of 2026.
Shytoshi Kusama, the pseudonymous visionary leader associated with the Shiba Inu ecosystem, has largely remained silent on X. His most recent post came on May 13, when he expressed admiration for Dhairya.
Meanwhile, Dhairya has also maintained limited social media activity. His latest referenced X post came on July 25, when he highlighted SHIB’s price surge.
As a result, Vet Kusama’s suggestion that the two developers could soon make an announcement has renewed curiosity among SHIB holders.
R.OS Could Influence Shytoshi’s Next Move
One factor fueling the speculation is Shytoshi Kusama’s apparent shift in focus this year. Rather than remaining highly active in Shiba Inu-related discussions, Kusama has indicated that he has been concentrating on completing R.OS, an independent artificial intelligence project.
His reduced social media presence has consequently raised questions about whether he plans to return to a more prominent role in SHIB development.
However, there is currently no confirmation that the teased announcement will involve R.OS, Shibarium, SHIB, or any other component of the broader ecosystem.
Only 10 Days Remain for the Potential Announcement
Vet Kusama’s comments have also created a sense of urgency as August draws to a close. With just 10 days remaining in the month, members of the SHIB community are increasingly wondering what Kusama and Dhairya might reveal.
However, the nature of the potential announcement remains unclear. Vet Kusama did not provide specific details, while neither Shytoshi Kusama nor Kaal Dhairya has publicly confirmed what they may announce.
Therefore, this speculation should be treated cautiously until the developers provide additional information. For now, Vet Kusama’s comments represent a teaser rather than an official announcement.
#CryptoNewsCommunity
626
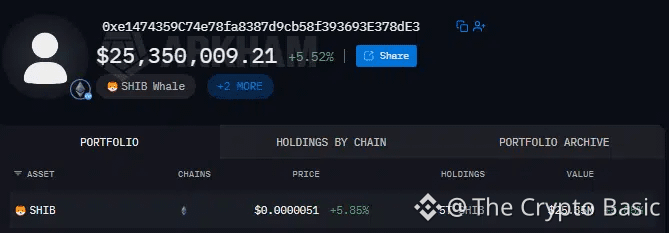
The #Shiba Inu community is highlighting the long-term conviction of a top-50 whale who has held 5 trillion SHIB tokens for over 4 years without a single outflow.
According to data from Arkham, the whale received 5,000,000,058,418 (5 trillion) SHIB from an unlabeled address on November 4, 2021. The transaction came only days after Shiba Inu reached its all-time high of $0.00008845 on October 28, 2021.
At the time, the whale’s SHIB holdings were worth $281.98 million. Today, however, the same holdings are valued at roughly $25.35 million, reflecting a staggering 91.01% decline in dollar value. Despite that dramatic reduction, the whale has apparently refused to sell.
#CryptoNews
Shiba Inu Top 50 Whale Shows Resilience in SHIB
The #Shiba Inu community is highlighting the long-term conviction of a top-50 whale who has held 5 trillion SHIB tokens for over 4 years without a single outflow.
According to data from Arkham, the whale received 5,000,000,058,418 (5 trillion) SHIB from an unlabeled address on November 4, 2021. The transaction came only days after Shiba Inu reached its all-time high of $0.00008845 on October 28, 2021.
At the time, the whale’s SHIB holdings were worth $281.98 million. Today, however, the same holdings are valued at roughly $25.35 million, reflecting a staggering 91.01% decline in dollar value. Despite that dramatic reduction, the whale has apparently refused to sell.
#CryptoNews
Shiba Inu Top 50 Whale Shows Resilience in SHIB
According to data from Arkham, the whale received 5,000,000,058,418 (5 trillion) SHIB from an unlabeled address on November 4, 2021. The transaction came only days after Shiba Inu reached its all-time high of $0.00008845 on October 28, 2021.
At the time, the whale’s SHIB holdings were worth $281.98 million. Today, however, the same holdings are valued at roughly $25.35 million, reflecting a staggering 91.01% decline in dollar value. Despite that dramatic reduction, the whale has apparently refused to sell.
#CryptoNews
Shiba Inu Top 50 Whale Shows Resilience in SHIB
2
695
Article
"XRP Shorts Suffer $33,000,000 Wipeout Amid Price Rebound"#XRP shorts have suffered over $33 million worth of liquidations over the past 24 hours amid the recent XRP price resurgence above $1.30.
As the crypto market rebounds on the back of favorable macroeconomic developments and proposed liquidity injections, XRP has leveraged the upward trend to stage its most impressive rally of the year, securing its spot among the top gainers.
Interestingly, data from Coinglass, a leading market analytics platform, confirms that this recovery push has resulted in increased liquidations for XRP shorts, as investors betting on sustained price declines continue to witness losses in the futures market.
XRP Reclaims $1.30
For context, XRP’s resurgence came later than the rest of the market. While the broader crypto market started seeing gains at the start of the week, XRP only began recovering on Wednesday, Aug. 19, when it posted a massive 10.40% gain.
So far, XRP has recorded some of the largest gains in the market, outperforming Bitcoin (BTC) and nearly every altcoin in the top 100 over the daily and weekly timeframes.
As the upsurge continued, XRP eventually reclaimed the $1.30 price level on Aug. 20 for the first time since early June. The asset has since maintained the rally, hitting a 3-month peak of $1.43 today before pulling back to settle at $1.35 as of press time.
XRP Shorts Record $33M Loss
While bullish investors have benefited from this rally, the upsurge has dealt a blow to XRP shorts. Notably, XRP’s initial upsurge led to increased interest among traders in the derivatives market, with most market participants anticipating a sudden drop and opening short positions.
However, XRP maintained its rally, resulting in massive losses for these short positions. According to Coinglass, XRP shorts have suffered nearly in liquidations over the last four hours. Notably, shorts accounted for over 68% of the total liquidations within this period.
In the 12-hour timeframe, total liquidations amounted to $23.39 million, with shorts recording $15.68 million or 67%. Meanwhile, over the past 24 hours, XRP shorts made up $33.25 million in liquidated value, representing a 60% share of the total $55.2 million.
However, longs have accounted for the greater share in the last hour, amounting to $824,560, a 71% share of the $1.16 million total. This turnaround is due to XRP’s resistance at the $1.43 level today and the recent pullback toward $1.35.
A Spike in Futures Interest
Further data from Coinglass also confirms the latest spike in futures interest. Notably, XRP’s futures volume has surged more than 130% to $14.40 billion at press time, marking a 6-month peak. The last time daily futures volume crossed the $10 billion mark was in February 2026.
In addition to this, open interest has also risen 15.8% to $3.42 billion. Data shows that Binance continues to lead in futures volume, with $4.35 billion. Meanwhile, Bybit comes second with $1.87 billion, while MEXC holds the third spot, having processed $1.81 billion worth of XRP futures volume in the last 24 hours.
#crypto
"XRP Shorts Suffer $33,000,000 Wipeout Amid Price Rebound"
#XRP shorts have suffered over $33 million worth of liquidations over the past 24 hours amid the recent XRP price resurgence above $1.30.
As the crypto market rebounds on the back of favorable macroeconomic developments and proposed liquidity injections, XRP has leveraged the upward trend to stage its most impressive rally of the year, securing its spot among the top gainers.
Interestingly, data from Coinglass, a leading market analytics platform, confirms that this recovery push has resulted in increased liquidations for XRP shorts, as investors betting on sustained price declines continue to witness losses in the futures market.
XRP Reclaims $1.30
For context, XRP’s resurgence came later than the rest of the market. While the broader crypto market started seeing gains at the start of the week, XRP only began recovering on Wednesday, Aug. 19, when it posted a massive 10.40% gain.
So far, XRP has recorded some of the largest gains in the market, outperforming Bitcoin (BTC) and nearly every altcoin in the top 100 over the daily and weekly timeframes.
As the upsurge continued, XRP eventually reclaimed the $1.30 price level on Aug. 20 for the first time since early June. The asset has since maintained the rally, hitting a 3-month peak of $1.43 today before pulling back to settle at $1.35 as of press time.
XRP Shorts Record $33M Loss
While bullish investors have benefited from this rally, the upsurge has dealt a blow to XRP shorts. Notably, XRP’s initial upsurge led to increased interest among traders in the derivatives market, with most market participants anticipating a sudden drop and opening short positions.
However, XRP maintained its rally, resulting in massive losses for these short positions. According to Coinglass, XRP shorts have suffered nearly in liquidations over the last four hours. Notably, shorts accounted for over 68% of the total liquidations within this period.
In the 12-hour timeframe, total liquidations amounted to $23.39 million, with shorts recording $15.68 million or 67%. Meanwhile, over the past 24 hours, XRP shorts made up $33.25 million in liquidated value, representing a 60% share of the total $55.2 million.
However, longs have accounted for the greater share in the last hour, amounting to $824,560, a 71% share of the $1.16 million total. This turnaround is due to XRP’s resistance at the $1.43 level today and the recent pullback toward $1.35.
A Spike in Futures Interest
Further data from Coinglass also confirms the latest spike in futures interest. Notably, XRP’s futures volume has surged more than 130% to $14.40 billion at press time, marking a 6-month peak. The last time daily futures volume crossed the $10 billion mark was in February 2026.
In addition to this, open interest has also risen 15.8% to $3.42 billion. Data shows that Binance continues to lead in futures volume, with $4.35 billion. Meanwhile, Bybit comes second with $1.87 billion, while MEXC holds the third spot, having processed $1.81 billion worth of XRP futures volume in the last 24 hours.
#crypto
As the crypto market rebounds on the back of favorable macroeconomic developments and proposed liquidity injections, XRP has leveraged the upward trend to stage its most impressive rally of the year, securing its spot among the top gainers.
Interestingly, data from Coinglass, a leading market analytics platform, confirms that this recovery push has resulted in increased liquidations for XRP shorts, as investors betting on sustained price declines continue to witness losses in the futures market.
XRP Reclaims $1.30
For context, XRP’s resurgence came later than the rest of the market. While the broader crypto market started seeing gains at the start of the week, XRP only began recovering on Wednesday, Aug. 19, when it posted a massive 10.40% gain.
So far, XRP has recorded some of the largest gains in the market, outperforming Bitcoin (BTC) and nearly every altcoin in the top 100 over the daily and weekly timeframes.
As the upsurge continued, XRP eventually reclaimed the $1.30 price level on Aug. 20 for the first time since early June. The asset has since maintained the rally, hitting a 3-month peak of $1.43 today before pulling back to settle at $1.35 as of press time.
XRP Shorts Record $33M Loss
While bullish investors have benefited from this rally, the upsurge has dealt a blow to XRP shorts. Notably, XRP’s initial upsurge led to increased interest among traders in the derivatives market, with most market participants anticipating a sudden drop and opening short positions.
However, XRP maintained its rally, resulting in massive losses for these short positions. According to Coinglass, XRP shorts have suffered nearly in liquidations over the last four hours. Notably, shorts accounted for over 68% of the total liquidations within this period.
In the 12-hour timeframe, total liquidations amounted to $23.39 million, with shorts recording $15.68 million or 67%. Meanwhile, over the past 24 hours, XRP shorts made up $33.25 million in liquidated value, representing a 60% share of the total $55.2 million.
However, longs have accounted for the greater share in the last hour, amounting to $824,560, a 71% share of the $1.16 million total. This turnaround is due to XRP’s resistance at the $1.43 level today and the recent pullback toward $1.35.
A Spike in Futures Interest
Further data from Coinglass also confirms the latest spike in futures interest. Notably, XRP’s futures volume has surged more than 130% to $14.40 billion at press time, marking a 6-month peak. The last time daily futures volume crossed the $10 billion mark was in February 2026.
In addition to this, open interest has also risen 15.8% to $3.42 billion. Data shows that Binance continues to lead in futures volume, with $4.35 billion. Meanwhile, Bybit comes second with $1.87 billion, while MEXC holds the third spot, having processed $1.81 billion worth of XRP futures volume in the last 24 hours.
#crypto
1
391
Article
The End of This XRP Wave 2 Correction Could Happen “Any Hour Now”#XRP is nearing a turning point after a long decline, with analysts Casi and ChartNerd pointing to key support levels and a possible long-term rise.
Casi: XRP Wave 2 Could End Soon
Analyst Casi believes XRP’s current correction, known as Wave 2, could be ending soon. She said the long decline may be hiding a bullish setup on the long-term chart.
“The end of this Wave 2 correction could quite literally happen any hour now,” she wrote on X.
In her post, Casi told XRP holders to “zoom out” and not let the recent drop make them forget why they were bullish in the first place. She believes that once Wave 2 ends, XRP could enter Wave 3, which could lead to a major rally and possibly new all-time highs.
Casi also said XRP could briefly rally from around $1 before falling again. However, she believes the $1 area has already been tested several times.
XRP chart by Casi
For those looking to buy, she highlighted $1.004 and $0.774 as important support levels, based on Fibonacci analysis. Another key level is around $0.867.
Her main message is that Casi believes the current correction may be close to ending, and XRP could be setting up for a major rally. For context, XRP has already dipped 73% from its $3.66 peak in 2025.
ChartNerd Sees a Final Flush
Another XRP analyst, ChartNerd, is also expecting further weakness before a larger reversal. He said XRP is currently moving through a historical “weakness window” that has appeared during previous midterm U.S. election years.
“August is playing out as expected,” ChartNerd wrote, adding that XRP is now “knees deep” into its weakness window.
The analyst compared the current market structure with the periods between June and September during the 2018 and 2022 cycles, both of which eventually produced major market bottoms.
ChartNerd believes the 2026 market could follow a similar pattern, warning that a final flush of weak hands remains highly likely.
The analysis suggests that XRP’s current weakness does not necessarily invalidate the longer-term bullish thesis. Instead, another decline could complete the corrective structure before the next major advance.
XRP’s Long-Term Targets Reach $27
Meanwhile, ChartNerd has also published a much more ambitious long-term projection for XRP. In a separate analysis, he argued that XRP reaching $8, $13 or even $27 by 2030 could be more realistic than some of the $15 targets that circulated when XRP traded above $1.50 earlier this year.
The accompanying chart uses historical Fibonacci extensions and a time-based fractal to project future XRP targets. It identifies extension zones around $4.85, $13.79 and $27.72, with the highest target corresponding to the 161.8% Fibonacci extension.
ChartNerd stressed that the projections are not certainties, describing them as a “data backed cyclical projection” rather than absolute predictions.
For now, the immediate question remains whether XRP can complete its current Wave 2 correction. If Casi’s analysis plays out, the $1.00 area could be a favorable entry for long-term holders.
#Crypto
The End of This XRP Wave 2 Correction Could Happen “Any Hour Now”
#XRP is nearing a turning point after a long decline, with analysts Casi and ChartNerd pointing to key support levels and a possible long-term rise.
Casi: XRP Wave 2 Could End Soon
Analyst Casi believes XRP’s current correction, known as Wave 2, could be ending soon. She said the long decline may be hiding a bullish setup on the long-term chart.
“The end of this Wave 2 correction could quite literally happen any hour now,” she wrote on X.
In her post, Casi told XRP holders to “zoom out” and not let the recent drop make them forget why they were bullish in the first place. She believes that once Wave 2 ends, XRP could enter Wave 3, which could lead to a major rally and possibly new all-time highs.
Casi also said XRP could briefly rally from around $1 before falling again. However, she believes the $1 area has already been tested several times.
XRP chart by Casi
For those looking to buy, she highlighted $1.004 and $0.774 as important support levels, based on Fibonacci analysis. Another key level is around $0.867.
Her main message is that Casi believes the current correction may be close to ending, and XRP could be setting up for a major rally. For context, XRP has already dipped 73% from its $3.66 peak in 2025.
ChartNerd Sees a Final Flush
Another XRP analyst, ChartNerd, is also expecting further weakness before a larger reversal. He said XRP is currently moving through a historical “weakness window” that has appeared during previous midterm U.S. election years.
“August is playing out as expected,” ChartNerd wrote, adding that XRP is now “knees deep” into its weakness window.
The analyst compared the current market structure with the periods between June and September during the 2018 and 2022 cycles, both of which eventually produced major market bottoms.
ChartNerd believes the 2026 market could follow a similar pattern, warning that a final flush of weak hands remains highly likely.
The analysis suggests that XRP’s current weakness does not necessarily invalidate the longer-term bullish thesis. Instead, another decline could complete the corrective structure before the next major advance.
XRP’s Long-Term Targets Reach $27
Meanwhile, ChartNerd has also published a much more ambitious long-term projection for XRP. In a separate analysis, he argued that XRP reaching $8, $13 or even $27 by 2030 could be more realistic than some of the $15 targets that circulated when XRP traded above $1.50 earlier this year.
The accompanying chart uses historical Fibonacci extensions and a time-based fractal to project future XRP targets. It identifies extension zones around $4.85, $13.79 and $27.72, with the highest target corresponding to the 161.8% Fibonacci extension.
ChartNerd stressed that the projections are not certainties, describing them as a “data backed cyclical projection” rather than absolute predictions.
For now, the immediate question remains whether XRP can complete its current Wave 2 correction. If Casi’s analysis plays out, the $1.00 area could be a favorable entry for long-term holders.
#Crypto
Casi: XRP Wave 2 Could End Soon
Analyst Casi believes XRP’s current correction, known as Wave 2, could be ending soon. She said the long decline may be hiding a bullish setup on the long-term chart.
“The end of this Wave 2 correction could quite literally happen any hour now,” she wrote on X.
In her post, Casi told XRP holders to “zoom out” and not let the recent drop make them forget why they were bullish in the first place. She believes that once Wave 2 ends, XRP could enter Wave 3, which could lead to a major rally and possibly new all-time highs.
Casi also said XRP could briefly rally from around $1 before falling again. However, she believes the $1 area has already been tested several times.
XRP chart by Casi
For those looking to buy, she highlighted $1.004 and $0.774 as important support levels, based on Fibonacci analysis. Another key level is around $0.867.
Her main message is that Casi believes the current correction may be close to ending, and XRP could be setting up for a major rally. For context, XRP has already dipped 73% from its $3.66 peak in 2025.
ChartNerd Sees a Final Flush
Another XRP analyst, ChartNerd, is also expecting further weakness before a larger reversal. He said XRP is currently moving through a historical “weakness window” that has appeared during previous midterm U.S. election years.
“August is playing out as expected,” ChartNerd wrote, adding that XRP is now “knees deep” into its weakness window.
The analyst compared the current market structure with the periods between June and September during the 2018 and 2022 cycles, both of which eventually produced major market bottoms.
ChartNerd believes the 2026 market could follow a similar pattern, warning that a final flush of weak hands remains highly likely.
The analysis suggests that XRP’s current weakness does not necessarily invalidate the longer-term bullish thesis. Instead, another decline could complete the corrective structure before the next major advance.
XRP’s Long-Term Targets Reach $27
Meanwhile, ChartNerd has also published a much more ambitious long-term projection for XRP. In a separate analysis, he argued that XRP reaching $8, $13 or even $27 by 2030 could be more realistic than some of the $15 targets that circulated when XRP traded above $1.50 earlier this year.
The accompanying chart uses historical Fibonacci extensions and a time-based fractal to project future XRP targets. It identifies extension zones around $4.85, $13.79 and $27.72, with the highest target corresponding to the 161.8% Fibonacci extension.
ChartNerd stressed that the projections are not certainties, describing them as a “data backed cyclical projection” rather than absolute predictions.
For now, the immediate question remains whether XRP can complete its current Wave 2 correction. If Casi’s analysis plays out, the $1.00 area could be a favorable entry for long-term holders.
#Crypto
1
2
1.4k
Verified
Shiba Inu’s burn activity has reversed sharply this week after recording one of its strongest performances in months.
Over the past 24 hours, Shiba Inu witnessed the incineration of just 7.10 million SHIB worth approximately $33 at current prices. This dramatic slowdown follows a period of intense burn activity that fueled optimism across the Shiba Inu community.
The latest figures represent a steep decline from the elevated burn levels recorded at the end of July, indicating that the recent momentum has cooled, at least for now.
#CryptoNewsCommunity
Shiba Inu Burn
Shiba Inu’s burn activity has reversed sharply this week after recording one of its strongest performances in months.
Over the past 24 hours, Shiba Inu witnessed the incineration of just 7.10 million SHIB worth approximately $33 at current prices. This dramatic slowdown follows a period of intense burn activity that fueled optimism across the Shiba Inu community.
The latest figures represent a steep decline from the elevated burn levels recorded at the end of July, indicating that the recent momentum has cooled, at least for now.
#CryptoNewsCommunity
Shiba Inu Burn
Over the past 24 hours, Shiba Inu witnessed the incineration of just 7.10 million SHIB worth approximately $33 at current prices. This dramatic slowdown follows a period of intense burn activity that fueled optimism across the Shiba Inu community.
The latest figures represent a steep decline from the elevated burn levels recorded at the end of July, indicating that the recent momentum has cooled, at least for now.
#CryptoNewsCommunity
Shiba Inu Burn

1
900
Article
"Cardano Explodes 12% to Break Above $0.20 After Two Months"#Cardano has reclaimed the psychologically important $0.20 level after spending more than two months trading below that mark.
Notably, Cardano last traded above $0.20 on June 4, 2026. After that, ADA entered a prolonged downtrend that eventually pushed it to a multi-year low of $0.1387. However, buying pressure gradually returned over the past few weeks, setting the stage for a strong breakout.
After weeks of gradual recovery, the token broke through the key level with a 12.13% intraday surge, climbing from $0.1879 to $0.2107. Although it later gave back part of its gains, it has continued to hold above the $0.20 threshold. At press time, ADA was trading around $0.2032, signaling renewed bullish momentum.
Cardano Tops Weekly Performance
The latest rally has pushed Cardano to the top of the weekly performance rankings among the 100 largest cryptocurrencies by market cap.
Over the past seven days, ADA has spiked 20.63%, outperforming several leading altcoins and emerging projects. MemeCore ranked second with a 17.44% increase, while Ethena, Pump.fun, Algorand, and LayerZero followed with gains of 14.38%, 13.81%, and 12.91%, respectively.
Cardano has also maintained strong momentum on the daily timeframe. The token has risen 8.42% over the past 24 hours, making it the second-best-performing cryptocurrency among the top 100 assets during that period.
Cardano Emerges as Top Gainer
Ecosystem Developments Fuel Investor Confidence
It is noteworthy that several developments in the ecosystem have reinforced Cardano’s bullish outlook.
Cardano has officially entered its Dijkstra development era, a new governance phase that allows core development to be funded directly through the community treasury following the successful implementation of the van Rossem hard fork.
Meanwhile, on-chain activity has continued to strengthen. Whale wallets accumulated 240 million ADA in recent days, highlighting growing confidence among large investors. At the same time, Cardano expanded its interoperability by launching a new IBC testnet bridge with Cosmos through Injective, further boosting optimism around the ecosystem’s long-term growth.
In the meantime, investor sentiment has also remained firmly positive despite ADA’s recent volatility. According to CoinMarketCap, Cardano currently ranks as the fifth most bullish cryptocurrency by community sentiment, with a bullish score of 79.4%. Combined with rising whale accumulation, expanding network capabilities, and renewed buying momentum, the positive sentiment has helped support ADA’s return above the critical $0.20 price level.
#CryptoNewss
"Cardano Explodes 12% to Break Above $0.20 After Two Months"
#Cardano has reclaimed the psychologically important $0.20 level after spending more than two months trading below that mark.
Notably, Cardano last traded above $0.20 on June 4, 2026. After that, ADA entered a prolonged downtrend that eventually pushed it to a multi-year low of $0.1387. However, buying pressure gradually returned over the past few weeks, setting the stage for a strong breakout.
After weeks of gradual recovery, the token broke through the key level with a 12.13% intraday surge, climbing from $0.1879 to $0.2107. Although it later gave back part of its gains, it has continued to hold above the $0.20 threshold. At press time, ADA was trading around $0.2032, signaling renewed bullish momentum.
Cardano Tops Weekly Performance
The latest rally has pushed Cardano to the top of the weekly performance rankings among the 100 largest cryptocurrencies by market cap.
Over the past seven days, ADA has spiked 20.63%, outperforming several leading altcoins and emerging projects. MemeCore ranked second with a 17.44% increase, while Ethena, Pump.fun, Algorand, and LayerZero followed with gains of 14.38%, 13.81%, and 12.91%, respectively.
Cardano has also maintained strong momentum on the daily timeframe. The token has risen 8.42% over the past 24 hours, making it the second-best-performing cryptocurrency among the top 100 assets during that period.
Cardano Emerges as Top Gainer
Ecosystem Developments Fuel Investor Confidence
It is noteworthy that several developments in the ecosystem have reinforced Cardano’s bullish outlook.
Cardano has officially entered its Dijkstra development era, a new governance phase that allows core development to be funded directly through the community treasury following the successful implementation of the van Rossem hard fork.
Meanwhile, on-chain activity has continued to strengthen. Whale wallets accumulated 240 million ADA in recent days, highlighting growing confidence among large investors. At the same time, Cardano expanded its interoperability by launching a new IBC testnet bridge with Cosmos through Injective, further boosting optimism around the ecosystem’s long-term growth.
In the meantime, investor sentiment has also remained firmly positive despite ADA’s recent volatility. According to CoinMarketCap, Cardano currently ranks as the fifth most bullish cryptocurrency by community sentiment, with a bullish score of 79.4%. Combined with rising whale accumulation, expanding network capabilities, and renewed buying momentum, the positive sentiment has helped support ADA’s return above the critical $0.20 price level.
#CryptoNewss
Notably, Cardano last traded above $0.20 on June 4, 2026. After that, ADA entered a prolonged downtrend that eventually pushed it to a multi-year low of $0.1387. However, buying pressure gradually returned over the past few weeks, setting the stage for a strong breakout.
After weeks of gradual recovery, the token broke through the key level with a 12.13% intraday surge, climbing from $0.1879 to $0.2107. Although it later gave back part of its gains, it has continued to hold above the $0.20 threshold. At press time, ADA was trading around $0.2032, signaling renewed bullish momentum.
Cardano Tops Weekly Performance
The latest rally has pushed Cardano to the top of the weekly performance rankings among the 100 largest cryptocurrencies by market cap.
Over the past seven days, ADA has spiked 20.63%, outperforming several leading altcoins and emerging projects. MemeCore ranked second with a 17.44% increase, while Ethena, Pump.fun, Algorand, and LayerZero followed with gains of 14.38%, 13.81%, and 12.91%, respectively.
Cardano has also maintained strong momentum on the daily timeframe. The token has risen 8.42% over the past 24 hours, making it the second-best-performing cryptocurrency among the top 100 assets during that period.
Cardano Emerges as Top Gainer
Ecosystem Developments Fuel Investor Confidence
It is noteworthy that several developments in the ecosystem have reinforced Cardano’s bullish outlook.
Cardano has officially entered its Dijkstra development era, a new governance phase that allows core development to be funded directly through the community treasury following the successful implementation of the van Rossem hard fork.
Meanwhile, on-chain activity has continued to strengthen. Whale wallets accumulated 240 million ADA in recent days, highlighting growing confidence among large investors. At the same time, Cardano expanded its interoperability by launching a new IBC testnet bridge with Cosmos through Injective, further boosting optimism around the ecosystem’s long-term growth.
In the meantime, investor sentiment has also remained firmly positive despite ADA’s recent volatility. According to CoinMarketCap, Cardano currently ranks as the fifth most bullish cryptocurrency by community sentiment, with a bullish score of 79.4%. Combined with rising whale accumulation, expanding network capabilities, and renewed buying momentum, the positive sentiment has helped support ADA’s return above the critical $0.20 price level.
#CryptoNewss
218
Article
"XRP Whales Holding 10M to 100M Tokens Add 1.23B XRP in 2026 Despite 43% Price Crash"#XRP has had a difficult 2026, with its price falling 43%. However, whales holding between 10 million and 100 million XRP have continued to build their holdings.
Santiment data shows that this group has added 1.23 billion XRP to its combined balance since the start of the year.
For context, these whales held 10.97 billion XRP at the beginning of 2026. Their combined balance now stands at 12.2 billion XRP, giving them an exact increase of 1.23 billion tokens.
At XRP’s current price of $1.04, the newly added tokens have a value of about $1.2792 billion. At XRP’s all-time high of $3.66, attained in July 2025, these 1.23 billion tokens would be worth $4.5 billion.
XRP Whales Show Erratic Accumulation Trend
The group’s accumulation has followed an uneven pattern since the start of the year. The buying began well before 2026, as these XRP whales added more than 2.4 billion tokens in November 2025 alone despite the price struggles. Their combined balance rose from 8.4 billion XRP to more than 10.8 billion during that month.
The pace then slowed as XRP remained under pressure. Notably, their holdings moved above 11 billion XRP in December 2025 but later slipped slightly to 10.97 billion XRP by the start of 2026. The group stayed mostly quiet until March 2026, when it began a mild but steady accumulation campaign.
This buying continued through the following months. By July 8, 2026, the whales had pushed their combined holdings to a new all-time high of 12.27 billion XRP.
Notably, they have distributed some tokens since then, bringing the balance down gradually to 12.2 billion XRP. Despite the recent decline, their current holdings remain far above the 10.97 billion XRP they held at the start of the year.
More Large Holders Enter the Group
The increase in holdings has not come only from existing whales buying more XRP. On-chain data also shows that more addresses have entered the 10 million-to-100 million XRP range.
Specifically, the group had 301 addresses at the start of 2026. Today, it has 313. The number initially fell to 285 in mid-February before recovering. It then climbed steadily to 322 addresses in early July and later dropped to the current 313.
Despite this year’s increase, the number of addresses remains below the group’s all-time high of 351, which it reached in October 2025. Still, the rise from 301 to 313 addresses shows that the group has expanded since the beginning of the year.
Other XRP Whales Show Different Behavior
Other major XRP holders have behaved differently during the same period. Whales holding between 100 million and 1 billion XRP have cut their combined balance from 8.43 billion XRP at the start of the year to 8.13 billion XRP today. This amounts to a distribution of 300 million XRP in 2026.
Other Major XRP Holders
Meanwhile, whales holding between 1 million and 10 million XRP have moved in the other direction, but their increase has been much smaller. This group has added 260 million XRP to its holdings, taking its combined balance to 3.83 billion XRP today.
The 100,000-to-1-million XRP shark group has also reduced its holdings. Specifically, its combined balance has fallen from 6.43 billion XRP at the beginning of 2026 to 6.37 billion XRP today.
#Crypto
"XRP Whales Holding 10M to 100M Tokens Add 1.23B XRP in 2026 Despite 43% Price Crash"
#XRP has had a difficult 2026, with its price falling 43%. However, whales holding between 10 million and 100 million XRP have continued to build their holdings.
Santiment data shows that this group has added 1.23 billion XRP to its combined balance since the start of the year.
For context, these whales held 10.97 billion XRP at the beginning of 2026. Their combined balance now stands at 12.2 billion XRP, giving them an exact increase of 1.23 billion tokens.
At XRP’s current price of $1.04, the newly added tokens have a value of about $1.2792 billion. At XRP’s all-time high of $3.66, attained in July 2025, these 1.23 billion tokens would be worth $4.5 billion.
XRP Whales Show Erratic Accumulation Trend
The group’s accumulation has followed an uneven pattern since the start of the year. The buying began well before 2026, as these XRP whales added more than 2.4 billion tokens in November 2025 alone despite the price struggles. Their combined balance rose from 8.4 billion XRP to more than 10.8 billion during that month.
The pace then slowed as XRP remained under pressure. Notably, their holdings moved above 11 billion XRP in December 2025 but later slipped slightly to 10.97 billion XRP by the start of 2026. The group stayed mostly quiet until March 2026, when it began a mild but steady accumulation campaign.
This buying continued through the following months. By July 8, 2026, the whales had pushed their combined holdings to a new all-time high of 12.27 billion XRP.
Notably, they have distributed some tokens since then, bringing the balance down gradually to 12.2 billion XRP. Despite the recent decline, their current holdings remain far above the 10.97 billion XRP they held at the start of the year.
More Large Holders Enter the Group
The increase in holdings has not come only from existing whales buying more XRP. On-chain data also shows that more addresses have entered the 10 million-to-100 million XRP range.
Specifically, the group had 301 addresses at the start of 2026. Today, it has 313. The number initially fell to 285 in mid-February before recovering. It then climbed steadily to 322 addresses in early July and later dropped to the current 313.
Despite this year’s increase, the number of addresses remains below the group’s all-time high of 351, which it reached in October 2025. Still, the rise from 301 to 313 addresses shows that the group has expanded since the beginning of the year.
Other XRP Whales Show Different Behavior
Other major XRP holders have behaved differently during the same period. Whales holding between 100 million and 1 billion XRP have cut their combined balance from 8.43 billion XRP at the start of the year to 8.13 billion XRP today. This amounts to a distribution of 300 million XRP in 2026.
Other Major XRP Holders
Meanwhile, whales holding between 1 million and 10 million XRP have moved in the other direction, but their increase has been much smaller. This group has added 260 million XRP to its holdings, taking its combined balance to 3.83 billion XRP today.
The 100,000-to-1-million XRP shark group has also reduced its holdings. Specifically, its combined balance has fallen from 6.43 billion XRP at the beginning of 2026 to 6.37 billion XRP today.
#Crypto
Santiment data shows that this group has added 1.23 billion XRP to its combined balance since the start of the year.
For context, these whales held 10.97 billion XRP at the beginning of 2026. Their combined balance now stands at 12.2 billion XRP, giving them an exact increase of 1.23 billion tokens.
At XRP’s current price of $1.04, the newly added tokens have a value of about $1.2792 billion. At XRP’s all-time high of $3.66, attained in July 2025, these 1.23 billion tokens would be worth $4.5 billion.
XRP Whales Show Erratic Accumulation Trend
The group’s accumulation has followed an uneven pattern since the start of the year. The buying began well before 2026, as these XRP whales added more than 2.4 billion tokens in November 2025 alone despite the price struggles. Their combined balance rose from 8.4 billion XRP to more than 10.8 billion during that month.
The pace then slowed as XRP remained under pressure. Notably, their holdings moved above 11 billion XRP in December 2025 but later slipped slightly to 10.97 billion XRP by the start of 2026. The group stayed mostly quiet until March 2026, when it began a mild but steady accumulation campaign.
This buying continued through the following months. By July 8, 2026, the whales had pushed their combined holdings to a new all-time high of 12.27 billion XRP.
Notably, they have distributed some tokens since then, bringing the balance down gradually to 12.2 billion XRP. Despite the recent decline, their current holdings remain far above the 10.97 billion XRP they held at the start of the year.
More Large Holders Enter the Group
The increase in holdings has not come only from existing whales buying more XRP. On-chain data also shows that more addresses have entered the 10 million-to-100 million XRP range.
Specifically, the group had 301 addresses at the start of 2026. Today, it has 313. The number initially fell to 285 in mid-February before recovering. It then climbed steadily to 322 addresses in early July and later dropped to the current 313.
Despite this year’s increase, the number of addresses remains below the group’s all-time high of 351, which it reached in October 2025. Still, the rise from 301 to 313 addresses shows that the group has expanded since the beginning of the year.
Other XRP Whales Show Different Behavior
Other major XRP holders have behaved differently during the same period. Whales holding between 100 million and 1 billion XRP have cut their combined balance from 8.43 billion XRP at the start of the year to 8.13 billion XRP today. This amounts to a distribution of 300 million XRP in 2026.
Other Major XRP Holders
Meanwhile, whales holding between 1 million and 10 million XRP have moved in the other direction, but their increase has been much smaller. This group has added 260 million XRP to its holdings, taking its combined balance to 3.83 billion XRP today.
The 100,000-to-1-million XRP shark group has also reduced its holdings. Specifically, its combined balance has fallen from 6.43 billion XRP at the beginning of 2026 to 6.37 billion XRP today.
#Crypto
3
420
Article
Bitcoin Recovery Strengthens as 57.5% of Supply Returns to Profit: Is the Bear Market Finally Over?#Bitcoin has recovered sharply over the past three weeks, and the share of coins back in profit has risen significantly.
Meanwhile, new CryptoQuant analysis suggests the market still has not reached the conditions that historically marked the end of bear markets.
Bitcoin Supply in Profit Rises to 57.5%
According to CryptoQuant author thechessONCHAIN, Bitcoin’s Supply in Profit—the percentage of BTC worth more than its acquisition price—rose to 57.5% as of July 22. That is up from 46.2% on June 30, the cycle low.
The increase means more than one in every 10 BTCs moved from a loss to a profit in about three weeks. Over the same period, Bitcoin’s price gained roughly 7% and traded near $65,100.
Meanwhile, the Short-Term Holder Spent Output Profit Ratio (SOPR) stood at 0.9997. This suggests recent buyers are mostly selling at break-even instead of taking meaningful profits or losses.
Historical Bear Market Exits Required Higher Profit Levels
Despite the improvement, the analyst said Bitcoin has not yet reached the levels that historically confirmed the end of bear markets.
Using the 30-day average Long-Term Holder SOPR reclaiming 1.0 as the regime-change signal, previous bear markets ended only after a much larger share of Bitcoin’s supply returned to profit:
April 2012: 69% of supply in profitNovember 2015: 64%May 2019: 83%April 2023: 77%
In each case, at least 64% of Bitcoin’s supply was back in profit. The current reading is 57.5%.
The analyst also pointed to a failed recovery earlier in the current cycle. Between April 28 and June 1, the Long-Term Holder SOPR stayed above 1.0 for 35 consecutive days. During that period, Supply in Profit climbed to 67%. Both metrics later reversed lower.
The 30-day average Long-Term Holder SOPR has now fallen to 0.86. It has remained below 1.0 for 51 consecutive days, suggesting long-term holders are still not consistently realizing profits.
Selling Pressure Shifts to Newer Holders
The report also examined the source of current selling pressure. Bitcoin held for more than six months accounted for 12% to 16% of exchange inflows in early July as prices rebounded.
This suggested long-term holders were taking advantage of the rally to sell. That share has since dropped sharply to 0.8%, down from 5.6% a month earlier. The decline suggests selling by older holders has largely faded.
Instead, the remaining overhead supply comes from investors who accumulated Bitcoin between one month and two years ago. According to the analysis, their average acquisition prices range from about $72,000 to $101,000. That leaves many of these holders still underwater at current prices.
The analyst concluded that Bitcoin’s Supply in Profit would likely need to climb into the mid-60% range and remain there for longer than the failed 35-day recovery earlier this year.
Until then, the current rally is more likely to be a recovery within an ongoing bear market than confirmation of a market-cycle bottom.
#CryptoNews🚀🔥V
Bitcoin Recovery Strengthens as 57.5% of Supply Returns to Profit: Is the Bear Market Finally Over?
#Bitcoin has recovered sharply over the past three weeks, and the share of coins back in profit has risen significantly.
Meanwhile, new CryptoQuant analysis suggests the market still has not reached the conditions that historically marked the end of bear markets.
Bitcoin Supply in Profit Rises to 57.5%
According to CryptoQuant author thechessONCHAIN, Bitcoin’s Supply in Profit—the percentage of BTC worth more than its acquisition price—rose to 57.5% as of July 22. That is up from 46.2% on June 30, the cycle low.
The increase means more than one in every 10 BTCs moved from a loss to a profit in about three weeks. Over the same period, Bitcoin’s price gained roughly 7% and traded near $65,100.
Meanwhile, the Short-Term Holder Spent Output Profit Ratio (SOPR) stood at 0.9997. This suggests recent buyers are mostly selling at break-even instead of taking meaningful profits or losses.
Historical Bear Market Exits Required Higher Profit Levels
Despite the improvement, the analyst said Bitcoin has not yet reached the levels that historically confirmed the end of bear markets.
Using the 30-day average Long-Term Holder SOPR reclaiming 1.0 as the regime-change signal, previous bear markets ended only after a much larger share of Bitcoin’s supply returned to profit:
April 2012: 69% of supply in profitNovember 2015: 64%May 2019: 83%April 2023: 77%
In each case, at least 64% of Bitcoin’s supply was back in profit. The current reading is 57.5%.
The analyst also pointed to a failed recovery earlier in the current cycle. Between April 28 and June 1, the Long-Term Holder SOPR stayed above 1.0 for 35 consecutive days. During that period, Supply in Profit climbed to 67%. Both metrics later reversed lower.
The 30-day average Long-Term Holder SOPR has now fallen to 0.86. It has remained below 1.0 for 51 consecutive days, suggesting long-term holders are still not consistently realizing profits.
Selling Pressure Shifts to Newer Holders
The report also examined the source of current selling pressure. Bitcoin held for more than six months accounted for 12% to 16% of exchange inflows in early July as prices rebounded.
This suggested long-term holders were taking advantage of the rally to sell. That share has since dropped sharply to 0.8%, down from 5.6% a month earlier. The decline suggests selling by older holders has largely faded.
Instead, the remaining overhead supply comes from investors who accumulated Bitcoin between one month and two years ago. According to the analysis, their average acquisition prices range from about $72,000 to $101,000. That leaves many of these holders still underwater at current prices.
The analyst concluded that Bitcoin’s Supply in Profit would likely need to climb into the mid-60% range and remain there for longer than the failed 35-day recovery earlier this year.
Until then, the current rally is more likely to be a recovery within an ongoing bear market than confirmation of a market-cycle bottom.
#CryptoNews🚀🔥V
Meanwhile, new CryptoQuant analysis suggests the market still has not reached the conditions that historically marked the end of bear markets.
Bitcoin Supply in Profit Rises to 57.5%
According to CryptoQuant author thechessONCHAIN, Bitcoin’s Supply in Profit—the percentage of BTC worth more than its acquisition price—rose to 57.5% as of July 22. That is up from 46.2% on June 30, the cycle low.
The increase means more than one in every 10 BTCs moved from a loss to a profit in about three weeks. Over the same period, Bitcoin’s price gained roughly 7% and traded near $65,100.
Meanwhile, the Short-Term Holder Spent Output Profit Ratio (SOPR) stood at 0.9997. This suggests recent buyers are mostly selling at break-even instead of taking meaningful profits or losses.
Historical Bear Market Exits Required Higher Profit Levels
Despite the improvement, the analyst said Bitcoin has not yet reached the levels that historically confirmed the end of bear markets.
Using the 30-day average Long-Term Holder SOPR reclaiming 1.0 as the regime-change signal, previous bear markets ended only after a much larger share of Bitcoin’s supply returned to profit:
April 2012: 69% of supply in profitNovember 2015: 64%May 2019: 83%April 2023: 77%
In each case, at least 64% of Bitcoin’s supply was back in profit. The current reading is 57.5%.
The analyst also pointed to a failed recovery earlier in the current cycle. Between April 28 and June 1, the Long-Term Holder SOPR stayed above 1.0 for 35 consecutive days. During that period, Supply in Profit climbed to 67%. Both metrics later reversed lower.
The 30-day average Long-Term Holder SOPR has now fallen to 0.86. It has remained below 1.0 for 51 consecutive days, suggesting long-term holders are still not consistently realizing profits.
Selling Pressure Shifts to Newer Holders
The report also examined the source of current selling pressure. Bitcoin held for more than six months accounted for 12% to 16% of exchange inflows in early July as prices rebounded.
This suggested long-term holders were taking advantage of the rally to sell. That share has since dropped sharply to 0.8%, down from 5.6% a month earlier. The decline suggests selling by older holders has largely faded.
Instead, the remaining overhead supply comes from investors who accumulated Bitcoin between one month and two years ago. According to the analysis, their average acquisition prices range from about $72,000 to $101,000. That leaves many of these holders still underwater at current prices.
The analyst concluded that Bitcoin’s Supply in Profit would likely need to climb into the mid-60% range and remain there for longer than the failed 35-day recovery earlier this year.
Until then, the current rally is more likely to be a recovery within an ongoing bear market than confirmation of a market-cycle bottom.
#CryptoNews🚀🔥V
2
295
Article
"658,600 ETH Worth $1.24B Leaves Exchanges as Ethereum Supply Tightens and Bullish Sentiment Builds"#Ethereum (ETH) reserves are moving in different directions across major cryptocurrency exchanges.
Gemini and Bitfinex have recorded significant outflows, while Binance’s holdings have remained mostly stable, according to CryptoQuant analyst Amr Taha.
658,600 Fewer ETH on Exchanges
Data shared by Taha shows Gemini’s Ethereum reserve fell to 384,400 ETH on July 24. This marks its lowest level since March 2024.
Notably, the exchange has lost about 188,600 ETH, or 32.9%, since holding 573,000 ETH on April 23.
Meanwhile, Bitfinex has also seen a major decline. Its Ethereum reserve dropped from 2.71 million ETH on May 11 to 2.24 million ETH. That represents a reduction of roughly 470,000 ETH, or 17.3%.
Meanwhile, Binance’s Ethereum reserves have remained largely unchanged at around 3.8 million ETH during the same period.
Together, Gemini and Bitfinex now hold about 658,600 fewer ETH than before. At Ethereum’s current price of around $1,880, the reduction is worth approximately $1.24 billion.
Taha said that falling exchange balances reduce the amount of ETH immediately available for trading. However, reserve movements alone do not show investor intent or predict Ethereum’s future price direction.
Binance Ethereum Funding Rates Reach Six-Month High as Market Sentiment Improves
In a separate market update, Arab Chain highlighted improving sentiment in Ethereum’s derivatives market.
The 30-day simple moving average (SMA) of funding rates for Ethereum perpetual contracts on Binance has risen to approximately 0.00339. This is the highest level in six months, with ETH trading near $1,920.
Funding rates represent the cost traders pay to maintain leveraged positions. A rising positive funding rate usually signals stronger demand for long positions and growing bullish sentiment.
According to Arab Chain, the indicator has reversed after declining for several months. The shift comes as Ethereum has recently recovered in price.
ETH is trading at $1,885, down 2.3% over the past day but remains up 2.56% over the past week. Moreover, the monthly chart shows ETH is up 13%.
Essentially, the move in the derivative markets suggests traders are willing to pay to hold long positions, reflecting expectations that ETH could continue moving higher.
However, Arab Chain noted that funding rates are still below the elevated levels that have historically appeared before major market corrections.
He added that continued increases could signal rising leverage in the market. This may increase the risk of widespread liquidations if Ethereum faces a sharp price decline.
#CryptonewswithJack
"658,600 ETH Worth $1.24B Leaves Exchanges as Ethereum Supply Tightens and Bullish Sentiment Builds"
#Ethereum (ETH) reserves are moving in different directions across major cryptocurrency exchanges.
Gemini and Bitfinex have recorded significant outflows, while Binance’s holdings have remained mostly stable, according to CryptoQuant analyst Amr Taha.
658,600 Fewer ETH on Exchanges
Data shared by Taha shows Gemini’s Ethereum reserve fell to 384,400 ETH on July 24. This marks its lowest level since March 2024.
Notably, the exchange has lost about 188,600 ETH, or 32.9%, since holding 573,000 ETH on April 23.
Meanwhile, Bitfinex has also seen a major decline. Its Ethereum reserve dropped from 2.71 million ETH on May 11 to 2.24 million ETH. That represents a reduction of roughly 470,000 ETH, or 17.3%.
Meanwhile, Binance’s Ethereum reserves have remained largely unchanged at around 3.8 million ETH during the same period.
Together, Gemini and Bitfinex now hold about 658,600 fewer ETH than before. At Ethereum’s current price of around $1,880, the reduction is worth approximately $1.24 billion.
Taha said that falling exchange balances reduce the amount of ETH immediately available for trading. However, reserve movements alone do not show investor intent or predict Ethereum’s future price direction.
Binance Ethereum Funding Rates Reach Six-Month High as Market Sentiment Improves
In a separate market update, Arab Chain highlighted improving sentiment in Ethereum’s derivatives market.
The 30-day simple moving average (SMA) of funding rates for Ethereum perpetual contracts on Binance has risen to approximately 0.00339. This is the highest level in six months, with ETH trading near $1,920.
Funding rates represent the cost traders pay to maintain leveraged positions. A rising positive funding rate usually signals stronger demand for long positions and growing bullish sentiment.
According to Arab Chain, the indicator has reversed after declining for several months. The shift comes as Ethereum has recently recovered in price.
ETH is trading at $1,885, down 2.3% over the past day but remains up 2.56% over the past week. Moreover, the monthly chart shows ETH is up 13%.
Essentially, the move in the derivative markets suggests traders are willing to pay to hold long positions, reflecting expectations that ETH could continue moving higher.
However, Arab Chain noted that funding rates are still below the elevated levels that have historically appeared before major market corrections.
He added that continued increases could signal rising leverage in the market. This may increase the risk of widespread liquidations if Ethereum faces a sharp price decline.
#CryptonewswithJack
Gemini and Bitfinex have recorded significant outflows, while Binance’s holdings have remained mostly stable, according to CryptoQuant analyst Amr Taha.
658,600 Fewer ETH on Exchanges
Data shared by Taha shows Gemini’s Ethereum reserve fell to 384,400 ETH on July 24. This marks its lowest level since March 2024.
Notably, the exchange has lost about 188,600 ETH, or 32.9%, since holding 573,000 ETH on April 23.
Meanwhile, Bitfinex has also seen a major decline. Its Ethereum reserve dropped from 2.71 million ETH on May 11 to 2.24 million ETH. That represents a reduction of roughly 470,000 ETH, or 17.3%.
Meanwhile, Binance’s Ethereum reserves have remained largely unchanged at around 3.8 million ETH during the same period.
Together, Gemini and Bitfinex now hold about 658,600 fewer ETH than before. At Ethereum’s current price of around $1,880, the reduction is worth approximately $1.24 billion.
Taha said that falling exchange balances reduce the amount of ETH immediately available for trading. However, reserve movements alone do not show investor intent or predict Ethereum’s future price direction.
Binance Ethereum Funding Rates Reach Six-Month High as Market Sentiment Improves
In a separate market update, Arab Chain highlighted improving sentiment in Ethereum’s derivatives market.
The 30-day simple moving average (SMA) of funding rates for Ethereum perpetual contracts on Binance has risen to approximately 0.00339. This is the highest level in six months, with ETH trading near $1,920.
Funding rates represent the cost traders pay to maintain leveraged positions. A rising positive funding rate usually signals stronger demand for long positions and growing bullish sentiment.
According to Arab Chain, the indicator has reversed after declining for several months. The shift comes as Ethereum has recently recovered in price.
ETH is trading at $1,885, down 2.3% over the past day but remains up 2.56% over the past week. Moreover, the monthly chart shows ETH is up 13%.
Essentially, the move in the derivative markets suggests traders are willing to pay to hold long positions, reflecting expectations that ETH could continue moving higher.
However, Arab Chain noted that funding rates are still below the elevated levels that have historically appeared before major market corrections.
He added that continued increases could signal rising leverage in the market. This may increase the risk of widespread liquidations if Ethereum faces a sharp price decline.
#CryptonewswithJack
229
Article
"Shiba Inu: Shibarium Activity Jump 78%, but SHIB Price Remains Under Pressure"Activity on Shibarium, #Shiba Inu’s official Layer-2 blockchain, surged sharply over the past day, but SHIB’s price has yet to respond.
According to the latest data from Shibariumscan, Shibarium processed 1,180 daily transactions yesterday. This marks a notable recovery from 661 transactions recorded on July 21, the second-lowest daily transaction count for July.
As a result, daily transactions climbed 78.51% within just a few days, signaling renewed activity on the network after a period of sluggish usage.
Although the latest transaction count remains far below the millions of daily transactions Shibarium recorded during its peak periods, many market observers view the rebound as an encouraging sign.
The increase comes at a time when investors continue to search for a bullish catalyst capable of reversing SHIB’s prolonged price weakness. Even a modest improvement in network activity has sparked optimism that user engagement on Shibarium could gradually recover if the trend continues.
SHIB Price Fails to Respond to Network Improvement
Despite the jump in Shibarium transactions, Shiba Inu has not benefited from the renewed activity on the blockchain.
The broader cryptocurrency market experienced another sharp sell-off yesterday, dragging down several major assets, including SHIB. The token fell from an intraday high of $0.000004243 to a low of $0.000004102 before recovering slightly.
At press time, SHIB is trading at $0.000004189. Even with the rebound, the token remains down 1.28% over the past 24 hours, 8.21% over the past week, and 0.34% month-to-date.
Ecosystem Challenges Continue to Weigh on Sentiment
Meanwhile, the Shiba Inu ecosystem continues to face several challenges that have dampened investor confidence.
The ongoing bearish market has produced few positive developments for the project. Community members have also expressed concerns over the disappearance of several key team members from X, multiple ecosystem initiatives that remain unfinished, and persistently low SHIB burn activity.
Against this backdrop, Shibarium’s recent transaction rebound has fueled speculation that long-awaited positive catalysts could finally be emerging. However, the increase in network activity alone has not been enough to translate into higher SHIB prices.
Over 113B Shiba Inu Tokens Leave Exchange
Despite the weak price performance, investors continue to move SHIB off centralized exchanges.
Notably, more than 113 billion SHIB tokens have recently been withdrawn from exchanges, reducing the total exchange reserve to approximately 86.13 trillion SHIB.
Large exchange outflows are often interpreted as a sign that investors are transferring tokens into private wallets for longer-term holding rather than preparing to sell. While this trend has yet to trigger a price recovery, it suggests that some market participants remain confident in SHIB’s longer-term prospects even as the token continues to trade under bearish pressure.
#CryptoNewsCommunity
"Shiba Inu: Shibarium Activity Jump 78%, but SHIB Price Remains Under Pressure"
Activity on Shibarium, #Shiba Inu’s official Layer-2 blockchain, surged sharply over the past day, but SHIB’s price has yet to respond.
According to the latest data from Shibariumscan, Shibarium processed 1,180 daily transactions yesterday. This marks a notable recovery from 661 transactions recorded on July 21, the second-lowest daily transaction count for July.
As a result, daily transactions climbed 78.51% within just a few days, signaling renewed activity on the network after a period of sluggish usage.
Although the latest transaction count remains far below the millions of daily transactions Shibarium recorded during its peak periods, many market observers view the rebound as an encouraging sign.
The increase comes at a time when investors continue to search for a bullish catalyst capable of reversing SHIB’s prolonged price weakness. Even a modest improvement in network activity has sparked optimism that user engagement on Shibarium could gradually recover if the trend continues.
SHIB Price Fails to Respond to Network Improvement
Despite the jump in Shibarium transactions, Shiba Inu has not benefited from the renewed activity on the blockchain.
The broader cryptocurrency market experienced another sharp sell-off yesterday, dragging down several major assets, including SHIB. The token fell from an intraday high of $0.000004243 to a low of $0.000004102 before recovering slightly.
At press time, SHIB is trading at $0.000004189. Even with the rebound, the token remains down 1.28% over the past 24 hours, 8.21% over the past week, and 0.34% month-to-date.
Ecosystem Challenges Continue to Weigh on Sentiment
Meanwhile, the Shiba Inu ecosystem continues to face several challenges that have dampened investor confidence.
The ongoing bearish market has produced few positive developments for the project. Community members have also expressed concerns over the disappearance of several key team members from X, multiple ecosystem initiatives that remain unfinished, and persistently low SHIB burn activity.
Against this backdrop, Shibarium’s recent transaction rebound has fueled speculation that long-awaited positive catalysts could finally be emerging. However, the increase in network activity alone has not been enough to translate into higher SHIB prices.
Over 113B Shiba Inu Tokens Leave Exchange
Despite the weak price performance, investors continue to move SHIB off centralized exchanges.
Notably, more than 113 billion SHIB tokens have recently been withdrawn from exchanges, reducing the total exchange reserve to approximately 86.13 trillion SHIB.
Large exchange outflows are often interpreted as a sign that investors are transferring tokens into private wallets for longer-term holding rather than preparing to sell. While this trend has yet to trigger a price recovery, it suggests that some market participants remain confident in SHIB’s longer-term prospects even as the token continues to trade under bearish pressure.
#CryptoNewsCommunity
According to the latest data from Shibariumscan, Shibarium processed 1,180 daily transactions yesterday. This marks a notable recovery from 661 transactions recorded on July 21, the second-lowest daily transaction count for July.
As a result, daily transactions climbed 78.51% within just a few days, signaling renewed activity on the network after a period of sluggish usage.
Although the latest transaction count remains far below the millions of daily transactions Shibarium recorded during its peak periods, many market observers view the rebound as an encouraging sign.
The increase comes at a time when investors continue to search for a bullish catalyst capable of reversing SHIB’s prolonged price weakness. Even a modest improvement in network activity has sparked optimism that user engagement on Shibarium could gradually recover if the trend continues.
SHIB Price Fails to Respond to Network Improvement
Despite the jump in Shibarium transactions, Shiba Inu has not benefited from the renewed activity on the blockchain.
The broader cryptocurrency market experienced another sharp sell-off yesterday, dragging down several major assets, including SHIB. The token fell from an intraday high of $0.000004243 to a low of $0.000004102 before recovering slightly.
At press time, SHIB is trading at $0.000004189. Even with the rebound, the token remains down 1.28% over the past 24 hours, 8.21% over the past week, and 0.34% month-to-date.
Ecosystem Challenges Continue to Weigh on Sentiment
Meanwhile, the Shiba Inu ecosystem continues to face several challenges that have dampened investor confidence.
The ongoing bearish market has produced few positive developments for the project. Community members have also expressed concerns over the disappearance of several key team members from X, multiple ecosystem initiatives that remain unfinished, and persistently low SHIB burn activity.
Against this backdrop, Shibarium’s recent transaction rebound has fueled speculation that long-awaited positive catalysts could finally be emerging. However, the increase in network activity alone has not been enough to translate into higher SHIB prices.
Over 113B Shiba Inu Tokens Leave Exchange
Despite the weak price performance, investors continue to move SHIB off centralized exchanges.
Notably, more than 113 billion SHIB tokens have recently been withdrawn from exchanges, reducing the total exchange reserve to approximately 86.13 trillion SHIB.
Large exchange outflows are often interpreted as a sign that investors are transferring tokens into private wallets for longer-term holding rather than preparing to sell. While this trend has yet to trigger a price recovery, it suggests that some market participants remain confident in SHIB’s longer-term prospects even as the token continues to trade under bearish pressure.
#CryptoNewsCommunity
571
Article
"Current XRP Downtrend Resembles Triangle Setup That Led to 66,000% Surge in 2017"#XRP could be repeating the same price pattern that came before its massive rally in the 2017/2018 market cycle.
Latest market data suggests the asset is again moving within a symmetrical triangle, similar to the structure that eventually led to a remarkable 66,000% gain and pushed XRP to $3.31 nine years ago.
The first version of this symmetrical triangle played out over several years. Specifically, it started after XRP fell from its $0.0614 high in December 2013 and continued until the breakout in March 2017.
Once XRP broke above the pattern, an impressive rally ensued. The token climbed more than 66,000%, rising from around $0.005 in March 2017 to a peak of $3.31 in January 2018.
XRP Has Formed A Bigger Triangle
The current symmetrical triangle is larger and took much longer to develop than the previous one. Unlike the first pattern, this one has formed over an entire market cycle.
This second triangle started forming after XRP dropped from its $3.31 peak in January 2018. The asset remained inside the pattern for years before finally breaking above the upper resistance line.
XRP broke above the triangle’s main resistance line during the Trump-led November 2024 rally. The breakout triggered a strong move higher, sending the asset from about $0.5 to $3.4 by January 2018. After the rally, XRP pulled back before climbing again to a new all-time high of $3.6 in July 2025.
Notably, the rally did not continue immediately after reaching that peak. Instead, XRP entered a deep correction that brought it back toward the previous breakout area and rising macro support. This phase represents an important test of the long-term structure, as XRP currently remains in this broader downtrend.
RSI Shows Oversold Conditions
Despite the ongoing weakness, one key momentum indicator has moved into an area that previously marked strong accumulation zones.
Notably, the monthly Relative Strength Index (RSI) has dropped into oversold territory at 41.85, near levels where XRP has historically attracted long-term buying interest.
Currently, the price remains weak, market sentiment has become exhausted, and much of the previous rally has faded.
However, the broader breakout structure has not been invalidated. Importantly, traders should prepare for continued volatility, more testing of support, and a difficult path back upward instead of an immediate recovery.
History Suggests a Key Support Level
XRP’s current situation resembles what happened after the March 2017 breakout. Following that breakout, XRP dropped to $0.0075 in April 2017. The sudden decline brought the price back to the upper trendline of the triangle, allowing it to complete a successful breakout retest.
After finding support there, XRP resumed its rally and eventually reached $3.31 by January 2018. If buyers defend the present support area this time, the decline could become a normal post-breakout reset instead of the beginning of a larger structural breakdown.
The most important support zone now sits between $0.70 and $0.83, with $0.82 standing out as the key level. This area lines up with the upper trendline of the symmetrical triangle. Holding above that range would help XRP stay above the breakout level and keep the long-term bullish structure intact.
#CryptoNewss
"Current XRP Downtrend Resembles Triangle Setup That Led to 66,000% Surge in 2017"
#XRP could be repeating the same price pattern that came before its massive rally in the 2017/2018 market cycle.
Latest market data suggests the asset is again moving within a symmetrical triangle, similar to the structure that eventually led to a remarkable 66,000% gain and pushed XRP to $3.31 nine years ago.
The first version of this symmetrical triangle played out over several years. Specifically, it started after XRP fell from its $0.0614 high in December 2013 and continued until the breakout in March 2017.
Once XRP broke above the pattern, an impressive rally ensued. The token climbed more than 66,000%, rising from around $0.005 in March 2017 to a peak of $3.31 in January 2018.
XRP Has Formed A Bigger Triangle
The current symmetrical triangle is larger and took much longer to develop than the previous one. Unlike the first pattern, this one has formed over an entire market cycle.
This second triangle started forming after XRP dropped from its $3.31 peak in January 2018. The asset remained inside the pattern for years before finally breaking above the upper resistance line.
XRP broke above the triangle’s main resistance line during the Trump-led November 2024 rally. The breakout triggered a strong move higher, sending the asset from about $0.5 to $3.4 by January 2018. After the rally, XRP pulled back before climbing again to a new all-time high of $3.6 in July 2025.
Notably, the rally did not continue immediately after reaching that peak. Instead, XRP entered a deep correction that brought it back toward the previous breakout area and rising macro support. This phase represents an important test of the long-term structure, as XRP currently remains in this broader downtrend.
RSI Shows Oversold Conditions
Despite the ongoing weakness, one key momentum indicator has moved into an area that previously marked strong accumulation zones.
Notably, the monthly Relative Strength Index (RSI) has dropped into oversold territory at 41.85, near levels where XRP has historically attracted long-term buying interest.
Currently, the price remains weak, market sentiment has become exhausted, and much of the previous rally has faded.
However, the broader breakout structure has not been invalidated. Importantly, traders should prepare for continued volatility, more testing of support, and a difficult path back upward instead of an immediate recovery.
History Suggests a Key Support Level
XRP’s current situation resembles what happened after the March 2017 breakout. Following that breakout, XRP dropped to $0.0075 in April 2017. The sudden decline brought the price back to the upper trendline of the triangle, allowing it to complete a successful breakout retest.
After finding support there, XRP resumed its rally and eventually reached $3.31 by January 2018. If buyers defend the present support area this time, the decline could become a normal post-breakout reset instead of the beginning of a larger structural breakdown.
The most important support zone now sits between $0.70 and $0.83, with $0.82 standing out as the key level. This area lines up with the upper trendline of the symmetrical triangle. Holding above that range would help XRP stay above the breakout level and keep the long-term bullish structure intact.
#CryptoNewss
Latest market data suggests the asset is again moving within a symmetrical triangle, similar to the structure that eventually led to a remarkable 66,000% gain and pushed XRP to $3.31 nine years ago.
The first version of this symmetrical triangle played out over several years. Specifically, it started after XRP fell from its $0.0614 high in December 2013 and continued until the breakout in March 2017.
Once XRP broke above the pattern, an impressive rally ensued. The token climbed more than 66,000%, rising from around $0.005 in March 2017 to a peak of $3.31 in January 2018.
XRP Has Formed A Bigger Triangle
The current symmetrical triangle is larger and took much longer to develop than the previous one. Unlike the first pattern, this one has formed over an entire market cycle.
This second triangle started forming after XRP dropped from its $3.31 peak in January 2018. The asset remained inside the pattern for years before finally breaking above the upper resistance line.
XRP broke above the triangle’s main resistance line during the Trump-led November 2024 rally. The breakout triggered a strong move higher, sending the asset from about $0.5 to $3.4 by January 2018. After the rally, XRP pulled back before climbing again to a new all-time high of $3.6 in July 2025.
Notably, the rally did not continue immediately after reaching that peak. Instead, XRP entered a deep correction that brought it back toward the previous breakout area and rising macro support. This phase represents an important test of the long-term structure, as XRP currently remains in this broader downtrend.
RSI Shows Oversold Conditions
Despite the ongoing weakness, one key momentum indicator has moved into an area that previously marked strong accumulation zones.
Notably, the monthly Relative Strength Index (RSI) has dropped into oversold territory at 41.85, near levels where XRP has historically attracted long-term buying interest.
Currently, the price remains weak, market sentiment has become exhausted, and much of the previous rally has faded.
However, the broader breakout structure has not been invalidated. Importantly, traders should prepare for continued volatility, more testing of support, and a difficult path back upward instead of an immediate recovery.
History Suggests a Key Support Level
XRP’s current situation resembles what happened after the March 2017 breakout. Following that breakout, XRP dropped to $0.0075 in April 2017. The sudden decline brought the price back to the upper trendline of the triangle, allowing it to complete a successful breakout retest.
After finding support there, XRP resumed its rally and eventually reached $3.31 by January 2018. If buyers defend the present support area this time, the decline could become a normal post-breakout reset instead of the beginning of a larger structural breakdown.
The most important support zone now sits between $0.70 and $0.83, with $0.82 standing out as the key level. This area lines up with the upper trendline of the symmetrical triangle. Holding above that range would help XRP stay above the breakout level and keep the long-term bullish structure intact.
#CryptoNewss
1
598
Article
"Cardano Founder Agrees With Elizabeth Warren, Says Trump Should Stay Out of Crypto"Cardano founder Charles Hoskinson has argued that President Donald Trump should not actively participate in the cryptocurrency market while serving in office.
Hoskison’s comments came after Senator Elizabeth Warren urged lawmakers to reject the latest version of the Clarity Act, claiming it does not adequately prevent President Trump from financially benefiting from his crypto-related activities.
Warren Raises Conflict-of-Interest Concerns
According to Warren, the bill lacks sufficient safeguards to stop the president from profiting from cryptocurrency ventures while in office. She also argued that the legislation does not do enough to combat illicit finance or protect investors and the broader financial system.
Additionally, Warren described the proposal as a missed opportunity to address potential conflicts of interest involving Trump’s crypto businesses, which she claimed generated approximately $1.4 billion in revenue last year.
It is worth noting that the U.S. President is associated with several cryptocurrency ventures, including the Official Trump meme coin and the World Liberty Financial project, which have fueled broader discussions about potential conflicts of interest.
Cardano Founder Reacts
Reacting to Warren’s criticism, Hoskinson revealed that he had expressed similar concerns more than a year ago during several interviews. He argued that the political approach to cryptocurrency regulation had been misguided from the outset.
According to Hoskinson, those decisions ultimately strengthened the narrative that cryptocurrency regulation revolves around President Trump, making bipartisan cooperation increasingly difficult.
He stressed that meaningful progress cannot occur if cryptocurrency becomes a partisan political issue.
Hoskinson Calls Trump “the Ultimate Insider”
In a follow-up statement, Hoskinson argued that no sitting president should participate directly in financial markets because of the extraordinary influence and privileged access associated with the office.
He stated that the president occupies a unique position of power and information, making Trump “the ultimate insider.” Although Hoskinson acknowledged that he rarely agrees with Senator Warren, he said her concerns about presidential involvement in financial markets were justified.
He added that stronger safeguards are necessary to prevent potential conflicts of interest and preserve public confidence in cryptocurrency policymaking.
Updated Clarity Act Introduces Ethics Restrictions
Meanwhile, the Clarity Act continues to attract significant attention in Washington.
Earlier this week, Republican lawmakers introduced an updated draft of the legislation that includes a new ethics provision. The proposal would prohibit the President, Vice President, members of Congress, and their spouses from issuing or sponsoring digital assets while serving in office.
Congressional leadership is reportedly aiming to bring the bill to a Senate floor vote before the upcoming August recess. However, a packed legislative schedule and continued Democratic criticism over the strength of the ethics provisions could delay its passage.
#CryptoNews🚀🔥V
"Cardano Founder Agrees With Elizabeth Warren, Says Trump Should Stay Out of Crypto"
Cardano founder Charles Hoskinson has argued that President Donald Trump should not actively participate in the cryptocurrency market while serving in office.
Hoskison’s comments came after Senator Elizabeth Warren urged lawmakers to reject the latest version of the Clarity Act, claiming it does not adequately prevent President Trump from financially benefiting from his crypto-related activities.
Warren Raises Conflict-of-Interest Concerns
According to Warren, the bill lacks sufficient safeguards to stop the president from profiting from cryptocurrency ventures while in office. She also argued that the legislation does not do enough to combat illicit finance or protect investors and the broader financial system.
Additionally, Warren described the proposal as a missed opportunity to address potential conflicts of interest involving Trump’s crypto businesses, which she claimed generated approximately $1.4 billion in revenue last year.
It is worth noting that the U.S. President is associated with several cryptocurrency ventures, including the Official Trump meme coin and the World Liberty Financial project, which have fueled broader discussions about potential conflicts of interest.
Cardano Founder Reacts
Reacting to Warren’s criticism, Hoskinson revealed that he had expressed similar concerns more than a year ago during several interviews. He argued that the political approach to cryptocurrency regulation had been misguided from the outset.
According to Hoskinson, those decisions ultimately strengthened the narrative that cryptocurrency regulation revolves around President Trump, making bipartisan cooperation increasingly difficult.
He stressed that meaningful progress cannot occur if cryptocurrency becomes a partisan political issue.
Hoskinson Calls Trump “the Ultimate Insider”
In a follow-up statement, Hoskinson argued that no sitting president should participate directly in financial markets because of the extraordinary influence and privileged access associated with the office.
He stated that the president occupies a unique position of power and information, making Trump “the ultimate insider.” Although Hoskinson acknowledged that he rarely agrees with Senator Warren, he said her concerns about presidential involvement in financial markets were justified.
He added that stronger safeguards are necessary to prevent potential conflicts of interest and preserve public confidence in cryptocurrency policymaking.
Updated Clarity Act Introduces Ethics Restrictions
Meanwhile, the Clarity Act continues to attract significant attention in Washington.
Earlier this week, Republican lawmakers introduced an updated draft of the legislation that includes a new ethics provision. The proposal would prohibit the President, Vice President, members of Congress, and their spouses from issuing or sponsoring digital assets while serving in office.
Congressional leadership is reportedly aiming to bring the bill to a Senate floor vote before the upcoming August recess. However, a packed legislative schedule and continued Democratic criticism over the strength of the ethics provisions could delay its passage.
#CryptoNews🚀🔥V
Hoskison’s comments came after Senator Elizabeth Warren urged lawmakers to reject the latest version of the Clarity Act, claiming it does not adequately prevent President Trump from financially benefiting from his crypto-related activities.
Warren Raises Conflict-of-Interest Concerns
According to Warren, the bill lacks sufficient safeguards to stop the president from profiting from cryptocurrency ventures while in office. She also argued that the legislation does not do enough to combat illicit finance or protect investors and the broader financial system.
Additionally, Warren described the proposal as a missed opportunity to address potential conflicts of interest involving Trump’s crypto businesses, which she claimed generated approximately $1.4 billion in revenue last year.
It is worth noting that the U.S. President is associated with several cryptocurrency ventures, including the Official Trump meme coin and the World Liberty Financial project, which have fueled broader discussions about potential conflicts of interest.
Cardano Founder Reacts
Reacting to Warren’s criticism, Hoskinson revealed that he had expressed similar concerns more than a year ago during several interviews. He argued that the political approach to cryptocurrency regulation had been misguided from the outset.
According to Hoskinson, those decisions ultimately strengthened the narrative that cryptocurrency regulation revolves around President Trump, making bipartisan cooperation increasingly difficult.
He stressed that meaningful progress cannot occur if cryptocurrency becomes a partisan political issue.
Hoskinson Calls Trump “the Ultimate Insider”
In a follow-up statement, Hoskinson argued that no sitting president should participate directly in financial markets because of the extraordinary influence and privileged access associated with the office.
He stated that the president occupies a unique position of power and information, making Trump “the ultimate insider.” Although Hoskinson acknowledged that he rarely agrees with Senator Warren, he said her concerns about presidential involvement in financial markets were justified.
He added that stronger safeguards are necessary to prevent potential conflicts of interest and preserve public confidence in cryptocurrency policymaking.
Updated Clarity Act Introduces Ethics Restrictions
Meanwhile, the Clarity Act continues to attract significant attention in Washington.
Earlier this week, Republican lawmakers introduced an updated draft of the legislation that includes a new ethics provision. The proposal would prohibit the President, Vice President, members of Congress, and their spouses from issuing or sponsoring digital assets while serving in office.
Congressional leadership is reportedly aiming to bring the bill to a Senate floor vote before the upcoming August recess. However, a packed legislative schedule and continued Democratic criticism over the strength of the ethics provisions could delay its passage.
#CryptoNews🚀🔥V
376
The #XRP ecosystem has welcomed over $800 million worth of distributed real-world assets this year amid the growing tokenization trend on the network.
The tokenization market has continued to grow in 2026, with its total value now exceeding $410 billion. Current data puts the market at $410.70 billion, made up of $36.72 billion in distributed asset value and $373.98 billion in represented asset value.
Growth has been especially strong in the distributed asset segment. At the beginning of the year, distributed asset value, excluding stablecoins, stood at $25.39 billion. It has since risen to $36.72 billion, as interest in tokenization has gained momentum throughout the year.
#Crypto
The #XRP ecosystem has welcomed over $800 million worth of distributed real-world assets this year amid the growing tokenization trend on the network.
The tokenization market has continued to grow in 2026, with its total value now exceeding $410 billion. Current data puts the market at $410.70 billion, made up of $36.72 billion in distributed asset value and $373.98 billion in represented asset value.
Growth has been especially strong in the distributed asset segment. At the beginning of the year, distributed asset value, excluding stablecoins, stood at $25.39 billion. It has since risen to $36.72 billion, as interest in tokenization has gained momentum throughout the year.
#Crypto
The tokenization market has continued to grow in 2026, with its total value now exceeding $410 billion. Current data puts the market at $410.70 billion, made up of $36.72 billion in distributed asset value and $373.98 billion in represented asset value.
Growth has been especially strong in the distributed asset segment. At the beginning of the year, distributed asset value, excluding stablecoins, stood at $25.39 billion. It has since risen to $36.72 billion, as interest in tokenization has gained momentum throughout the year.
#Crypto
277
Article
"Bitcoin Outlook Improves as Exchange Inflows Stay Low, BlackRock IBIT Draws $557M"#Bitcoin short-term outlook is improving as mid-sized investors are not sending large amounts of BTC to exchanges.
At the same time, BlackRock’s spot Bitcoin ETF continues to see steady demand from institutional investors.
Bitcoin Exchange Inflows Remain Below Previous Sell-Off Levels
CryptoQuant analyst Amr Taha revealed Bitcoin inflows from mid-size investors remain below, or close to, the levels seen on June 22. That reduces the likelihood of a sell-off similar to previous market corrections.
On July 23, Binance recorded inflows of 3,000 BTC, down from 3,446 BTC on June 22. Coinbase received 2,600 BTC, slightly higher than its previous 2,170 BTC. Coinbase Prime recorded 1,264 BTC, below the earlier 1,560 BTC.
Combined inflows across the three platforms reached 6,864 BTC. That was slightly below the 7,176 BTC the market saw on June 22.
The gap between Binance and Coinbase also narrowed. It fell from 1,276 BTC to just 400 BTC, suggesting selling activity was spread more evenly across exchanges.
Taha said previous Bitcoin corrections in October 2025 and January 2026 were marked by sharp inflow spikes on a single exchange. Those concentrated inflows created localized selling pressure.
This time, no similar spike has appeared. According to Taha, that suggests the market is not showing the same immediate bearish setup.
With Bitcoin trading near $65,800, the restrained and balanced inflows point to limited short-term selling pressure. This may explain why Bitcoin price only dipped mildly in the past few days amid the correction that followed after its price reached $66,900 two days ago.
BlackRock’s IBIT Extends Inflow Streak
Meanwhile, institutional demand also remained strong through U.S. spot Bitcoin ETFs. BlackRock’s iShares Bitcoin Trust (IBIT) attracted about $557 million in net inflows across four consecutive positive trading sessions between July 14 and July 21.
The fund added about $155 million on July 14, $131 million on July 17, $114 million on July 20, and $157 million on July 21. The final three sessions accounted for roughly $402 million of the total.
Demand extended beyond BlackRock. On July 20, 21Shares’ ARKB attracted about $70 million. Together, the two funds recorded roughly $184 million in inflows that day.
Consistent BTC ETF Demand Supports Bullish Outlook
Rather than focusing on a single large inflow, Taha said the more important signal is the consistency of positive ETF flows over several trading sessions.
If spot Bitcoin ETFs continue attracting capital at similar levels, it would point to sustained institutional demand. Combined with muted exchange inflows, that could reinforce the constructive outlook and ease concerns about near-term selling pressure.
#CryptoNews🚀🔥V
"Bitcoin Outlook Improves as Exchange Inflows Stay Low, BlackRock IBIT Draws $557M"
#Bitcoin short-term outlook is improving as mid-sized investors are not sending large amounts of BTC to exchanges.
At the same time, BlackRock’s spot Bitcoin ETF continues to see steady demand from institutional investors.
Bitcoin Exchange Inflows Remain Below Previous Sell-Off Levels
CryptoQuant analyst Amr Taha revealed Bitcoin inflows from mid-size investors remain below, or close to, the levels seen on June 22. That reduces the likelihood of a sell-off similar to previous market corrections.
On July 23, Binance recorded inflows of 3,000 BTC, down from 3,446 BTC on June 22. Coinbase received 2,600 BTC, slightly higher than its previous 2,170 BTC. Coinbase Prime recorded 1,264 BTC, below the earlier 1,560 BTC.
Combined inflows across the three platforms reached 6,864 BTC. That was slightly below the 7,176 BTC the market saw on June 22.
The gap between Binance and Coinbase also narrowed. It fell from 1,276 BTC to just 400 BTC, suggesting selling activity was spread more evenly across exchanges.
Taha said previous Bitcoin corrections in October 2025 and January 2026 were marked by sharp inflow spikes on a single exchange. Those concentrated inflows created localized selling pressure.
This time, no similar spike has appeared. According to Taha, that suggests the market is not showing the same immediate bearish setup.
With Bitcoin trading near $65,800, the restrained and balanced inflows point to limited short-term selling pressure. This may explain why Bitcoin price only dipped mildly in the past few days amid the correction that followed after its price reached $66,900 two days ago.
BlackRock’s IBIT Extends Inflow Streak
Meanwhile, institutional demand also remained strong through U.S. spot Bitcoin ETFs. BlackRock’s iShares Bitcoin Trust (IBIT) attracted about $557 million in net inflows across four consecutive positive trading sessions between July 14 and July 21.
The fund added about $155 million on July 14, $131 million on July 17, $114 million on July 20, and $157 million on July 21. The final three sessions accounted for roughly $402 million of the total.
Demand extended beyond BlackRock. On July 20, 21Shares’ ARKB attracted about $70 million. Together, the two funds recorded roughly $184 million in inflows that day.
Consistent BTC ETF Demand Supports Bullish Outlook
Rather than focusing on a single large inflow, Taha said the more important signal is the consistency of positive ETF flows over several trading sessions.
If spot Bitcoin ETFs continue attracting capital at similar levels, it would point to sustained institutional demand. Combined with muted exchange inflows, that could reinforce the constructive outlook and ease concerns about near-term selling pressure.
#CryptoNews🚀🔥V
At the same time, BlackRock’s spot Bitcoin ETF continues to see steady demand from institutional investors.
Bitcoin Exchange Inflows Remain Below Previous Sell-Off Levels
CryptoQuant analyst Amr Taha revealed Bitcoin inflows from mid-size investors remain below, or close to, the levels seen on June 22. That reduces the likelihood of a sell-off similar to previous market corrections.
On July 23, Binance recorded inflows of 3,000 BTC, down from 3,446 BTC on June 22. Coinbase received 2,600 BTC, slightly higher than its previous 2,170 BTC. Coinbase Prime recorded 1,264 BTC, below the earlier 1,560 BTC.
Combined inflows across the three platforms reached 6,864 BTC. That was slightly below the 7,176 BTC the market saw on June 22.
The gap between Binance and Coinbase also narrowed. It fell from 1,276 BTC to just 400 BTC, suggesting selling activity was spread more evenly across exchanges.
Taha said previous Bitcoin corrections in October 2025 and January 2026 were marked by sharp inflow spikes on a single exchange. Those concentrated inflows created localized selling pressure.
This time, no similar spike has appeared. According to Taha, that suggests the market is not showing the same immediate bearish setup.
With Bitcoin trading near $65,800, the restrained and balanced inflows point to limited short-term selling pressure. This may explain why Bitcoin price only dipped mildly in the past few days amid the correction that followed after its price reached $66,900 two days ago.
BlackRock’s IBIT Extends Inflow Streak
Meanwhile, institutional demand also remained strong through U.S. spot Bitcoin ETFs. BlackRock’s iShares Bitcoin Trust (IBIT) attracted about $557 million in net inflows across four consecutive positive trading sessions between July 14 and July 21.
The fund added about $155 million on July 14, $131 million on July 17, $114 million on July 20, and $157 million on July 21. The final three sessions accounted for roughly $402 million of the total.
Demand extended beyond BlackRock. On July 20, 21Shares’ ARKB attracted about $70 million. Together, the two funds recorded roughly $184 million in inflows that day.
Consistent BTC ETF Demand Supports Bullish Outlook
Rather than focusing on a single large inflow, Taha said the more important signal is the consistency of positive ETF flows over several trading sessions.
If spot Bitcoin ETFs continue attracting capital at similar levels, it would point to sustained institutional demand. Combined with muted exchange inflows, that could reinforce the constructive outlook and ease concerns about near-term selling pressure.
#CryptoNews🚀🔥V
97
Article
"Shiba Inu Stabilizes Near Historic Lows, but Bears Retain Control Below Key Level"#Shiba Inu continues to trade under strong bearish pressure, with its broader market structure still pointing lower despite early signs that selling momentum may be easing.
This assessment comes from market commentator Dukes Markets Analysis, who shared the outlook in a recent TradingView publication titled “SHIB: From Meme Queen to New Historic Lows.”
Bearish Trend Remains Firmly Intact for Shiba Inu
According to Dukes, Shiba Inu remains below both its 50-day and 100-day Exponential Moving Averages (EMAs), two widely used indicators for identifying the prevailing market trend.
More importantly, the 50-day EMA continues to trade below the 100-day EMA, maintaining a bearish crossover that typically signals sellers remain in control of the market.
As long as SHIB stays beneath both moving averages, the broader technical structure continues to favor further downside. Consequently, any short-term price rebounds are likely to be corrective rallies rather than the beginning of a sustained bullish reversal.
Shiba Inu Must Reclaim a Key Resistance Level: Dukes
Despite the prevailing bearish outlook, Dukes identified $0.00000458 as the first major resistance level bulls must reclaim.
This price previously served as a strong support zone before breaking down and subsequently turning into resistance. He suggests that a decisive breakout above $0.00000458, followed by a strong daily close, would mark the first meaningful improvement in SHIB’s market structure and suggest buyers are beginning to regain control.
Until then, however, the dominant bearish trend remains unchanged.
Momentum Indicators Hint at a Potential Recovery
Although the overall trend remains negative, several momentum indicators suggest selling pressure may be easing.
The Relative Strength Index (RSI) has started to recover after previously falling into weaker territory. However, it still trades below the neutral 50 level, indicating bearish momentum continues to outweigh bullish strength despite the recent improvement.
Meanwhile, the Stochastic RSI (StochRSI), which measures the speed and momentum of price movements, continues to climb steadily without entering overbought territory. This suggests SHIB could have additional room for a short-term recovery before bullish momentum becomes overstretched.
Another Major Barrier Awaits Bulls
Even with improving momentum readings, Dukes noted that Shiba Inu’s trading volume remains relatively subdued, highlighting the lack of strong conviction from either buyers or sellers.
He emphasized that any breakout above the immediate resistance would require significantly stronger buying activity to confirm a sustainable recovery rather than another temporary bounce.
Even if SHIB successfully reclaims the $0.00000458 resistance level, Dukes believes another significant challenge lies around $0.00000520. This price marks the next major resistance zone, where sellers could once again step in and cap further gains. As a result, bulls would likely need to overcome both resistance levels before Shiba Inu can establish a more convincing medium-term recovery.
SHIB Still Trades Far Below Its Record High
At press time, Shiba Inu remained significantly below its all-time high of $0.00008845. Trading around $0.00000424, the token has declined 95.2% from its peak.
While SHIB has gained a modest 1.04% this month, it remains down 38.58% since the start of the year. The token currently ranks as the 31st-largest cryptocurrency by market capitalization, a notable decline from late 2021, when it consistently ranked among the world’s top 10 digital assets.
Meanwhile, trading activity continues to weaken, with daily volume falling 6.08% over the past 24 hours to $42.98 million, underscoring the lack of strong market participation despite tentative signs of improving momentum.
#CryptoNewsCommunity
"Shiba Inu Stabilizes Near Historic Lows, but Bears Retain Control Below Key Level"
#Shiba Inu continues to trade under strong bearish pressure, with its broader market structure still pointing lower despite early signs that selling momentum may be easing.
This assessment comes from market commentator Dukes Markets Analysis, who shared the outlook in a recent TradingView publication titled “SHIB: From Meme Queen to New Historic Lows.”
Bearish Trend Remains Firmly Intact for Shiba Inu
According to Dukes, Shiba Inu remains below both its 50-day and 100-day Exponential Moving Averages (EMAs), two widely used indicators for identifying the prevailing market trend.
More importantly, the 50-day EMA continues to trade below the 100-day EMA, maintaining a bearish crossover that typically signals sellers remain in control of the market.
As long as SHIB stays beneath both moving averages, the broader technical structure continues to favor further downside. Consequently, any short-term price rebounds are likely to be corrective rallies rather than the beginning of a sustained bullish reversal.
Shiba Inu Must Reclaim a Key Resistance Level: Dukes
Despite the prevailing bearish outlook, Dukes identified $0.00000458 as the first major resistance level bulls must reclaim.
This price previously served as a strong support zone before breaking down and subsequently turning into resistance. He suggests that a decisive breakout above $0.00000458, followed by a strong daily close, would mark the first meaningful improvement in SHIB’s market structure and suggest buyers are beginning to regain control.
Until then, however, the dominant bearish trend remains unchanged.
Momentum Indicators Hint at a Potential Recovery
Although the overall trend remains negative, several momentum indicators suggest selling pressure may be easing.
The Relative Strength Index (RSI) has started to recover after previously falling into weaker territory. However, it still trades below the neutral 50 level, indicating bearish momentum continues to outweigh bullish strength despite the recent improvement.
Meanwhile, the Stochastic RSI (StochRSI), which measures the speed and momentum of price movements, continues to climb steadily without entering overbought territory. This suggests SHIB could have additional room for a short-term recovery before bullish momentum becomes overstretched.
Another Major Barrier Awaits Bulls
Even with improving momentum readings, Dukes noted that Shiba Inu’s trading volume remains relatively subdued, highlighting the lack of strong conviction from either buyers or sellers.
He emphasized that any breakout above the immediate resistance would require significantly stronger buying activity to confirm a sustainable recovery rather than another temporary bounce.
Even if SHIB successfully reclaims the $0.00000458 resistance level, Dukes believes another significant challenge lies around $0.00000520. This price marks the next major resistance zone, where sellers could once again step in and cap further gains. As a result, bulls would likely need to overcome both resistance levels before Shiba Inu can establish a more convincing medium-term recovery.
SHIB Still Trades Far Below Its Record High
At press time, Shiba Inu remained significantly below its all-time high of $0.00008845. Trading around $0.00000424, the token has declined 95.2% from its peak.
While SHIB has gained a modest 1.04% this month, it remains down 38.58% since the start of the year. The token currently ranks as the 31st-largest cryptocurrency by market capitalization, a notable decline from late 2021, when it consistently ranked among the world’s top 10 digital assets.
Meanwhile, trading activity continues to weaken, with daily volume falling 6.08% over the past 24 hours to $42.98 million, underscoring the lack of strong market participation despite tentative signs of improving momentum.
#CryptoNewsCommunity
This assessment comes from market commentator Dukes Markets Analysis, who shared the outlook in a recent TradingView publication titled “SHIB: From Meme Queen to New Historic Lows.”
Bearish Trend Remains Firmly Intact for Shiba Inu
According to Dukes, Shiba Inu remains below both its 50-day and 100-day Exponential Moving Averages (EMAs), two widely used indicators for identifying the prevailing market trend.
More importantly, the 50-day EMA continues to trade below the 100-day EMA, maintaining a bearish crossover that typically signals sellers remain in control of the market.
As long as SHIB stays beneath both moving averages, the broader technical structure continues to favor further downside. Consequently, any short-term price rebounds are likely to be corrective rallies rather than the beginning of a sustained bullish reversal.
Shiba Inu Must Reclaim a Key Resistance Level: Dukes
Despite the prevailing bearish outlook, Dukes identified $0.00000458 as the first major resistance level bulls must reclaim.
This price previously served as a strong support zone before breaking down and subsequently turning into resistance. He suggests that a decisive breakout above $0.00000458, followed by a strong daily close, would mark the first meaningful improvement in SHIB’s market structure and suggest buyers are beginning to regain control.
Until then, however, the dominant bearish trend remains unchanged.
Momentum Indicators Hint at a Potential Recovery
Although the overall trend remains negative, several momentum indicators suggest selling pressure may be easing.
The Relative Strength Index (RSI) has started to recover after previously falling into weaker territory. However, it still trades below the neutral 50 level, indicating bearish momentum continues to outweigh bullish strength despite the recent improvement.
Meanwhile, the Stochastic RSI (StochRSI), which measures the speed and momentum of price movements, continues to climb steadily without entering overbought territory. This suggests SHIB could have additional room for a short-term recovery before bullish momentum becomes overstretched.
Another Major Barrier Awaits Bulls
Even with improving momentum readings, Dukes noted that Shiba Inu’s trading volume remains relatively subdued, highlighting the lack of strong conviction from either buyers or sellers.
He emphasized that any breakout above the immediate resistance would require significantly stronger buying activity to confirm a sustainable recovery rather than another temporary bounce.
Even if SHIB successfully reclaims the $0.00000458 resistance level, Dukes believes another significant challenge lies around $0.00000520. This price marks the next major resistance zone, where sellers could once again step in and cap further gains. As a result, bulls would likely need to overcome both resistance levels before Shiba Inu can establish a more convincing medium-term recovery.
SHIB Still Trades Far Below Its Record High
At press time, Shiba Inu remained significantly below its all-time high of $0.00008845. Trading around $0.00000424, the token has declined 95.2% from its peak.
While SHIB has gained a modest 1.04% this month, it remains down 38.58% since the start of the year. The token currently ranks as the 31st-largest cryptocurrency by market capitalization, a notable decline from late 2021, when it consistently ranked among the world’s top 10 digital assets.
Meanwhile, trading activity continues to weaken, with daily volume falling 6.08% over the past 24 hours to $42.98 million, underscoring the lack of strong market participation despite tentative signs of improving momentum.
#CryptoNewsCommunity
265
Article
"CLARITY Act Could Have Bigger Impact on XRP Than Many Expect, Developer Says"Software developer Vincent Van Code believes the proposed CLARITY Act could have a bigger impact on XRP adoption than many people expect.
He argues that, although XRP’s legal status is clearer today, important regulatory uncertainty still remains.
In a post on X, Van Code said the 2023 district court ruling in the SEC’s case against Ripple significantly reduced legal uncertainty. Notably, the court found that XRP sales on secondary markets are not securities.
He said the ruling has already encouraged more institutional activity. It has supported the expansion of Ripple’s On-Demand Liquidity (ODL) corridors, bank pilot programs, XRP exchange-traded fund (ETF) filings, and broader custody support.
Court Ruling Reduced Risk, but Uncertainty Remains
Van Code argued that the Ripple decision is still only a federal district court ruling, not a federal law. Because of that, he said, future legal and regulatory challenges remain possible.
He noted that the SEC could take different positions in future enforcement actions. Future court decisions or changes in administration could also narrow or revisit the ruling.
According to Van Code, this uncertainty continues to concern large financial institutions. Many of them require clear statutory guidance before committing significant capital or integrating digital assets into core financial products.
CLARITY Act Could Encourage More Institutions
Van Code said the CLARITY Act is designed to address this issue by putting digital asset classifications into federal law.
He added that banks and traditional financial institutions generally follow conservative compliance standards. As a result, many remain hesitant to hold large XRP positions or build major products based only on a court ruling.
Instead, some institutions have limited their XRP involvement to lower-risk activities. These include non-custodial services, pilot programs, and experimental use cases.
If passed, the CLARITY Act could remove much of the remaining regulatory uncertainty that risk-averse institutions continue to cite. Van Code believes this could support broader institutional adoption of XRP.
However, he emphasized that this is his personal analysis. He did not suggest that the legislation would necessarily have a direct impact on XRP’s market price.
CLARITY Act Advances in Senate
A new draft of the Digital Asset Market Clarity Act is circulating in the Senate as lawmakers make a final push to pass crypto market structure legislation before the August recess.
The latest draft includes a controversial ethics provision. It would bar the president and other senior government officials from holding direct crypto investments until 2029. The Department of Justice would be responsible for enforcing the rule.
Republicans say the provision reflects an agreement with President Donald Trump. However, many Democrats argue the restriction does not go far enough. Several have not yet committed to supporting the bill.
Beyond the ethics measure, the legislation would expand consumer protections and clarify how digital assets are regulated. It would also establish rules for crypto exchanges, support tokenized securities, and preserve protections for decentralized finance (DeFi) developers. Developers who do not control customer funds would remain exempt from money transmitter rules.
Republican leaders are expected to bring the bill to the Senate floor soon. However, it will likely need at least 10 Democratic votes to clear the Senate’s 60-vote threshold.
With Congress set to begin its summer recess in August, the coming weeks are the bill’s best opportunity to advance.
#CryptoNewsCommunity
"CLARITY Act Could Have Bigger Impact on XRP Than Many Expect, Developer Says"
Software developer Vincent Van Code believes the proposed CLARITY Act could have a bigger impact on XRP adoption than many people expect.
He argues that, although XRP’s legal status is clearer today, important regulatory uncertainty still remains.
In a post on X, Van Code said the 2023 district court ruling in the SEC’s case against Ripple significantly reduced legal uncertainty. Notably, the court found that XRP sales on secondary markets are not securities.
He said the ruling has already encouraged more institutional activity. It has supported the expansion of Ripple’s On-Demand Liquidity (ODL) corridors, bank pilot programs, XRP exchange-traded fund (ETF) filings, and broader custody support.
Court Ruling Reduced Risk, but Uncertainty Remains
Van Code argued that the Ripple decision is still only a federal district court ruling, not a federal law. Because of that, he said, future legal and regulatory challenges remain possible.
He noted that the SEC could take different positions in future enforcement actions. Future court decisions or changes in administration could also narrow or revisit the ruling.
According to Van Code, this uncertainty continues to concern large financial institutions. Many of them require clear statutory guidance before committing significant capital or integrating digital assets into core financial products.
CLARITY Act Could Encourage More Institutions
Van Code said the CLARITY Act is designed to address this issue by putting digital asset classifications into federal law.
He added that banks and traditional financial institutions generally follow conservative compliance standards. As a result, many remain hesitant to hold large XRP positions or build major products based only on a court ruling.
Instead, some institutions have limited their XRP involvement to lower-risk activities. These include non-custodial services, pilot programs, and experimental use cases.
If passed, the CLARITY Act could remove much of the remaining regulatory uncertainty that risk-averse institutions continue to cite. Van Code believes this could support broader institutional adoption of XRP.
However, he emphasized that this is his personal analysis. He did not suggest that the legislation would necessarily have a direct impact on XRP’s market price.
CLARITY Act Advances in Senate
A new draft of the Digital Asset Market Clarity Act is circulating in the Senate as lawmakers make a final push to pass crypto market structure legislation before the August recess.
The latest draft includes a controversial ethics provision. It would bar the president and other senior government officials from holding direct crypto investments until 2029. The Department of Justice would be responsible for enforcing the rule.
Republicans say the provision reflects an agreement with President Donald Trump. However, many Democrats argue the restriction does not go far enough. Several have not yet committed to supporting the bill.
Beyond the ethics measure, the legislation would expand consumer protections and clarify how digital assets are regulated. It would also establish rules for crypto exchanges, support tokenized securities, and preserve protections for decentralized finance (DeFi) developers. Developers who do not control customer funds would remain exempt from money transmitter rules.
Republican leaders are expected to bring the bill to the Senate floor soon. However, it will likely need at least 10 Democratic votes to clear the Senate’s 60-vote threshold.
With Congress set to begin its summer recess in August, the coming weeks are the bill’s best opportunity to advance.
#CryptoNewsCommunity
He argues that, although XRP’s legal status is clearer today, important regulatory uncertainty still remains.
In a post on X, Van Code said the 2023 district court ruling in the SEC’s case against Ripple significantly reduced legal uncertainty. Notably, the court found that XRP sales on secondary markets are not securities.
He said the ruling has already encouraged more institutional activity. It has supported the expansion of Ripple’s On-Demand Liquidity (ODL) corridors, bank pilot programs, XRP exchange-traded fund (ETF) filings, and broader custody support.
Court Ruling Reduced Risk, but Uncertainty Remains
Van Code argued that the Ripple decision is still only a federal district court ruling, not a federal law. Because of that, he said, future legal and regulatory challenges remain possible.
He noted that the SEC could take different positions in future enforcement actions. Future court decisions or changes in administration could also narrow or revisit the ruling.
According to Van Code, this uncertainty continues to concern large financial institutions. Many of them require clear statutory guidance before committing significant capital or integrating digital assets into core financial products.
CLARITY Act Could Encourage More Institutions
Van Code said the CLARITY Act is designed to address this issue by putting digital asset classifications into federal law.
He added that banks and traditional financial institutions generally follow conservative compliance standards. As a result, many remain hesitant to hold large XRP positions or build major products based only on a court ruling.
Instead, some institutions have limited their XRP involvement to lower-risk activities. These include non-custodial services, pilot programs, and experimental use cases.
If passed, the CLARITY Act could remove much of the remaining regulatory uncertainty that risk-averse institutions continue to cite. Van Code believes this could support broader institutional adoption of XRP.
However, he emphasized that this is his personal analysis. He did not suggest that the legislation would necessarily have a direct impact on XRP’s market price.
CLARITY Act Advances in Senate
A new draft of the Digital Asset Market Clarity Act is circulating in the Senate as lawmakers make a final push to pass crypto market structure legislation before the August recess.
The latest draft includes a controversial ethics provision. It would bar the president and other senior government officials from holding direct crypto investments until 2029. The Department of Justice would be responsible for enforcing the rule.
Republicans say the provision reflects an agreement with President Donald Trump. However, many Democrats argue the restriction does not go far enough. Several have not yet committed to supporting the bill.
Beyond the ethics measure, the legislation would expand consumer protections and clarify how digital assets are regulated. It would also establish rules for crypto exchanges, support tokenized securities, and preserve protections for decentralized finance (DeFi) developers. Developers who do not control customer funds would remain exempt from money transmitter rules.
Republican leaders are expected to bring the bill to the Senate floor soon. However, it will likely need at least 10 Democratic votes to clear the Senate’s 60-vote threshold.
With Congress set to begin its summer recess in August, the coming weeks are the bill’s best opportunity to advance.
#CryptoNewsCommunity
2
347
Large #Cardano investors significantly increased their holdings over the past week, signaling growing confidence in $ADA’s near-term outlook.
According to on-chain data from Santiment, Cardano wallets controlled by large holders accumulated more than 30 million ADA over the past seven days. The data also shows that whale holdings steadily climbed to 5.69 billion ADA, suggesting consistent accumulation rather than isolated purchases.
Meanwhile, renewed whale accumulation has coincided with improving sentiment across the broader crypto market, helping Cardano regain ground in the market-cap rankings.
Notably, ADA overtook Stellar (XLM) to reclaim its position as the 15th-largest cryptocurrency by market capitalization. Cardano currently boasts a market cap of $6.39 billion, narrowly edging past Stellar’s $6.30 billion valuation.
#CryptoNewss
Large #Cardano investors significantly increased their holdings over the past week, signaling growing confidence in $ADA’s near-term outlook.
According to on-chain data from Santiment, Cardano wallets controlled by large holders accumulated more than 30 million ADA over the past seven days. The data also shows that whale holdings steadily climbed to 5.69 billion ADA, suggesting consistent accumulation rather than isolated purchases.
Meanwhile, renewed whale accumulation has coincided with improving sentiment across the broader crypto market, helping Cardano regain ground in the market-cap rankings.
Notably, ADA overtook Stellar (XLM) to reclaim its position as the 15th-largest cryptocurrency by market capitalization. Cardano currently boasts a market cap of $6.39 billion, narrowly edging past Stellar’s $6.30 billion valuation.
#CryptoNewss
According to on-chain data from Santiment, Cardano wallets controlled by large holders accumulated more than 30 million ADA over the past seven days. The data also shows that whale holdings steadily climbed to 5.69 billion ADA, suggesting consistent accumulation rather than isolated purchases.
Meanwhile, renewed whale accumulation has coincided with improving sentiment across the broader crypto market, helping Cardano regain ground in the market-cap rankings.
Notably, ADA overtook Stellar (XLM) to reclaim its position as the 15th-largest cryptocurrency by market capitalization. Cardano currently boasts a market cap of $6.39 billion, narrowly edging past Stellar’s $6.30 billion valuation.
#CryptoNewss
1
474
Article
"XRP Inverse Head-and-Shoulders Targets 16% Move to $1.32"#XRP has formed an inverse head-and-shoulders pattern on the daily chart, with its completion targeting a 16% move to $1.32.
The setup comes amidst the recent price rebound. Notably, from the lows of $1.05 on July 13, XRP has rebounded nearly 8% to its current price. Chart analysis shows that this move completed a bullish formation, one that could potentially take the coin to higher prices.
XRP Inverse H&S Pattern Formation
On the daily chart, XRP has formed an inverse head-and-shoulders (H&S) pattern. The formation follows a rejection from a key support area at $1.32 in early June.
Notably, this demand zone has held XRP since the February crypto market crash, with each price weakness halting there. However, bears forced matters on June 1 and eventually pushed XRP below the support.
The consequent dip to $1.05 on June 6 started the inverse H&S pattern. There, the coin formed the left shoulder before a short-term rebound. The pattern’s head formed during the drop to $1.009 on June 26. Buying pressure stepped in to prevent a decline below the psychological $1 price mark, with XRP subsequently recovering.
The right shoulder formation built on the inverse head-and-shoulders pattern. Following the drop to $1.05 again on July 13, XRP rebounded from the support area again, confirming the bullish structure.
An inverse head-and-shoulders pattern suggests that selling pressure is declining as prices stop making lower lows. It is usually a trend reversal formation, signaling the gradual transition from a downtrend to an uptrend.
Trendline Breakout Confirms Bullish Structure
The completion of the inverse H&S formation saw XRP break above a downward-sloping trendline that has capped recoveries since May. After the high of $1.36 on May 30, XRP has made lower highs, each aligning closely with this trendline.
However, this resistance gave way on July 21 when XRP rallied approximately 3% to complete the right shoulder. This breakout confirms that momentum is now with the bulls, and its sustenance opens the path to higher prices.
The key level to watch is $1.09. As long as XRP stays above this area, the breakout and the inverse H&S pattern remain intact. Meanwhile, the upward target for the bullish formation is reclaiming $1.32, representing a 16% increase from the current price of $1.13.
XRP Whales Extensively Accumulating
Another bullish development that could fuel a price uptrend is the growing dominance of XRP whales on exchange outflows. A recent report shows that whales accounted for 77.8% of all XRP withdrawals from centralized exchanges on July 22.
Whales have a reputation for holding longer than retail. As such, when large holders increasingly shift an asset away from exchanges, it has a lasting impact on available supply. It also signals accumulation, reinforcing confidence in XRP’s future trend among key market participants.
Futures data is also showing renewed derivative interest in XRP. Over the past 3 days, traders have opened more futures positions than they have closed, with the percentage net change showing a staggering 452% increase. Inflows stand at $1.10 billion and outflows at $1.04 billion, reflecting a net inflow of $59 million.
#CryptoNewsFlash
"XRP Inverse Head-and-Shoulders Targets 16% Move to $1.32"
#XRP has formed an inverse head-and-shoulders pattern on the daily chart, with its completion targeting a 16% move to $1.32.
The setup comes amidst the recent price rebound. Notably, from the lows of $1.05 on July 13, XRP has rebounded nearly 8% to its current price. Chart analysis shows that this move completed a bullish formation, one that could potentially take the coin to higher prices.
XRP Inverse H&S Pattern Formation
On the daily chart, XRP has formed an inverse head-and-shoulders (H&S) pattern. The formation follows a rejection from a key support area at $1.32 in early June.
Notably, this demand zone has held XRP since the February crypto market crash, with each price weakness halting there. However, bears forced matters on June 1 and eventually pushed XRP below the support.
The consequent dip to $1.05 on June 6 started the inverse H&S pattern. There, the coin formed the left shoulder before a short-term rebound. The pattern’s head formed during the drop to $1.009 on June 26. Buying pressure stepped in to prevent a decline below the psychological $1 price mark, with XRP subsequently recovering.
The right shoulder formation built on the inverse head-and-shoulders pattern. Following the drop to $1.05 again on July 13, XRP rebounded from the support area again, confirming the bullish structure.
An inverse head-and-shoulders pattern suggests that selling pressure is declining as prices stop making lower lows. It is usually a trend reversal formation, signaling the gradual transition from a downtrend to an uptrend.
Trendline Breakout Confirms Bullish Structure
The completion of the inverse H&S formation saw XRP break above a downward-sloping trendline that has capped recoveries since May. After the high of $1.36 on May 30, XRP has made lower highs, each aligning closely with this trendline.
However, this resistance gave way on July 21 when XRP rallied approximately 3% to complete the right shoulder. This breakout confirms that momentum is now with the bulls, and its sustenance opens the path to higher prices.
The key level to watch is $1.09. As long as XRP stays above this area, the breakout and the inverse H&S pattern remain intact. Meanwhile, the upward target for the bullish formation is reclaiming $1.32, representing a 16% increase from the current price of $1.13.
XRP Whales Extensively Accumulating
Another bullish development that could fuel a price uptrend is the growing dominance of XRP whales on exchange outflows. A recent report shows that whales accounted for 77.8% of all XRP withdrawals from centralized exchanges on July 22.
Whales have a reputation for holding longer than retail. As such, when large holders increasingly shift an asset away from exchanges, it has a lasting impact on available supply. It also signals accumulation, reinforcing confidence in XRP’s future trend among key market participants.
Futures data is also showing renewed derivative interest in XRP. Over the past 3 days, traders have opened more futures positions than they have closed, with the percentage net change showing a staggering 452% increase. Inflows stand at $1.10 billion and outflows at $1.04 billion, reflecting a net inflow of $59 million.
#CryptoNewsFlash
The setup comes amidst the recent price rebound. Notably, from the lows of $1.05 on July 13, XRP has rebounded nearly 8% to its current price. Chart analysis shows that this move completed a bullish formation, one that could potentially take the coin to higher prices.
XRP Inverse H&S Pattern Formation
On the daily chart, XRP has formed an inverse head-and-shoulders (H&S) pattern. The formation follows a rejection from a key support area at $1.32 in early June.
Notably, this demand zone has held XRP since the February crypto market crash, with each price weakness halting there. However, bears forced matters on June 1 and eventually pushed XRP below the support.
The consequent dip to $1.05 on June 6 started the inverse H&S pattern. There, the coin formed the left shoulder before a short-term rebound. The pattern’s head formed during the drop to $1.009 on June 26. Buying pressure stepped in to prevent a decline below the psychological $1 price mark, with XRP subsequently recovering.
The right shoulder formation built on the inverse head-and-shoulders pattern. Following the drop to $1.05 again on July 13, XRP rebounded from the support area again, confirming the bullish structure.
An inverse head-and-shoulders pattern suggests that selling pressure is declining as prices stop making lower lows. It is usually a trend reversal formation, signaling the gradual transition from a downtrend to an uptrend.
Trendline Breakout Confirms Bullish Structure
The completion of the inverse H&S formation saw XRP break above a downward-sloping trendline that has capped recoveries since May. After the high of $1.36 on May 30, XRP has made lower highs, each aligning closely with this trendline.
However, this resistance gave way on July 21 when XRP rallied approximately 3% to complete the right shoulder. This breakout confirms that momentum is now with the bulls, and its sustenance opens the path to higher prices.
The key level to watch is $1.09. As long as XRP stays above this area, the breakout and the inverse H&S pattern remain intact. Meanwhile, the upward target for the bullish formation is reclaiming $1.32, representing a 16% increase from the current price of $1.13.
XRP Whales Extensively Accumulating
Another bullish development that could fuel a price uptrend is the growing dominance of XRP whales on exchange outflows. A recent report shows that whales accounted for 77.8% of all XRP withdrawals from centralized exchanges on July 22.
Whales have a reputation for holding longer than retail. As such, when large holders increasingly shift an asset away from exchanges, it has a lasting impact on available supply. It also signals accumulation, reinforcing confidence in XRP’s future trend among key market participants.
Futures data is also showing renewed derivative interest in XRP. Over the past 3 days, traders have opened more futures positions than they have closed, with the percentage net change showing a staggering 452% increase. Inflows stand at $1.10 billion and outflows at $1.04 billion, reflecting a net inflow of $59 million.
#CryptoNewsFlash
1
256
#XRP ecosystem has welcomed about $1 billion in tokenized asset-backed credit so far in 2026, already outpacing the total from the previous year.
This trend comes as the XRP Ledger (XRPL) continues to witness an increase in tokenized asset value this year amid the growing attention that has enveloped the narrative. For instance, BlackRock CEO Larry Fink argued in January that the tokenization of RWA is inevitable.
According to
http://RWA.xyz , a leading provider of tokenized RWA data, the tokenized asset-backed credit market has grown to a total value of $42.78 billion from just $9.35 billion at the beginning of last year, 2025. Essentially, the market has added over $33 billion in less than two years.
Notably, the XRP ecosystem currently boasts $1.5 billion worth of tokenized credit. This represents a 3.61% market share when considering total credit, and a 22% share in terms of represented credit value.
#Crypto
#XRP ecosystem has welcomed about $1 billion in tokenized asset-backed credit so far in 2026, already outpacing the total from the previous year.
This trend comes as the XRP Ledger (XRPL) continues to witness an increase in tokenized asset value this year amid the growing attention that has enveloped the narrative. For instance, BlackRock CEO Larry Fink argued in January that the tokenization of RWA is inevitable.
According to
http://RWA.xyz , a leading provider of tokenized RWA data, the tokenized asset-backed credit market has grown to a total value of $42.78 billion from just $9.35 billion at the beginning of last year, 2025. Essentially, the market has added over $33 billion in less than two years.
Notably, the XRP ecosystem currently boasts $1.5 billion worth of tokenized credit. This represents a 3.61% market share when considering total credit, and a 22% share in terms of represented credit value.
#Crypto
This trend comes as the XRP Ledger (XRPL) continues to witness an increase in tokenized asset value this year amid the growing attention that has enveloped the narrative. For instance, BlackRock CEO Larry Fink argued in January that the tokenization of RWA is inevitable.
According to
http://RWA.xyz , a leading provider of tokenized RWA data, the tokenized asset-backed credit market has grown to a total value of $42.78 billion from just $9.35 billion at the beginning of last year, 2025. Essentially, the market has added over $33 billion in less than two years.
Notably, the XRP ecosystem currently boasts $1.5 billion worth of tokenized credit. This represents a 3.61% market share when considering total credit, and a 22% share in terms of represented credit value.
#Crypto
2
372
Log in to explore more content
Join global crypto users on Binance Square
⚡️ Get latest and useful information about crypto.
💬 Trusted by the world’s largest crypto exchange.
👍 Discover real insights from verified creators.
Email / Phone number
Trending Topics
RussiaStartsLargeScaleDigitalRubleRolloutSep1
23,393 views
532 Discussing
#russiastartslargescaledigitalrublerolloutsep1
RUSSIA IS ABOUT TO CHANGE HOW DIGITAL MONEY WORKS. 🇷🇺
Starting September 1, Russia begins a large-scale rollout of the digital ruble, pushing its central bank digital currency (CBDC) deeper into the economy.
This isn’t just another payment system.
It’s a major step toward a more digital-first financial system.
And here’s the part crypto traders should watch closely:
More countries are moving toward digital national currencies
Faster digital payments are becoming the new standard
Global finance is gradually shifting toward digital money infrastructure
CBDCs are moving from experiments toward real-world use
But here’s the key point…
The digital ruble is NOT Bitcoin.
Bitcoin is decentralized, while the digital ruble is issued and controlled by Russia’s central bank.
Yet its rollout could accelerate a much bigger global race toward digital currencies and programmable money.
Could September 1 become another major milestone in the world’s transition toward digital money?🇷🇺
#Crypto #DigitalRuble #CBDC #Write2Earn
$BTC
$ETH
$HEMI
Shae Cassler Sw9r
·6 Likes
·3k views
BitcoinUp23%InAugustOutperformingGoldAndStocks
34,093 views
899 Discussing
BitcoinHolds$78K
21,809 views
176 Discussing