
CryptoMind学道
3.4k Posts

CryptoMind学道
Report
Block User
交易员 | 学道者 | Market Liquidity, Flow and Structure | Spot Futures News 和 New Listings | BTC ETH BNB 和 Top Momentum Alts | High-Volume Trade Signals | Risk First 稳
Frequent Trader
2.6 Years
9 Following
732 Followers
2.2K+ Liked
Posts
All
Quotes
PINNED
·
--
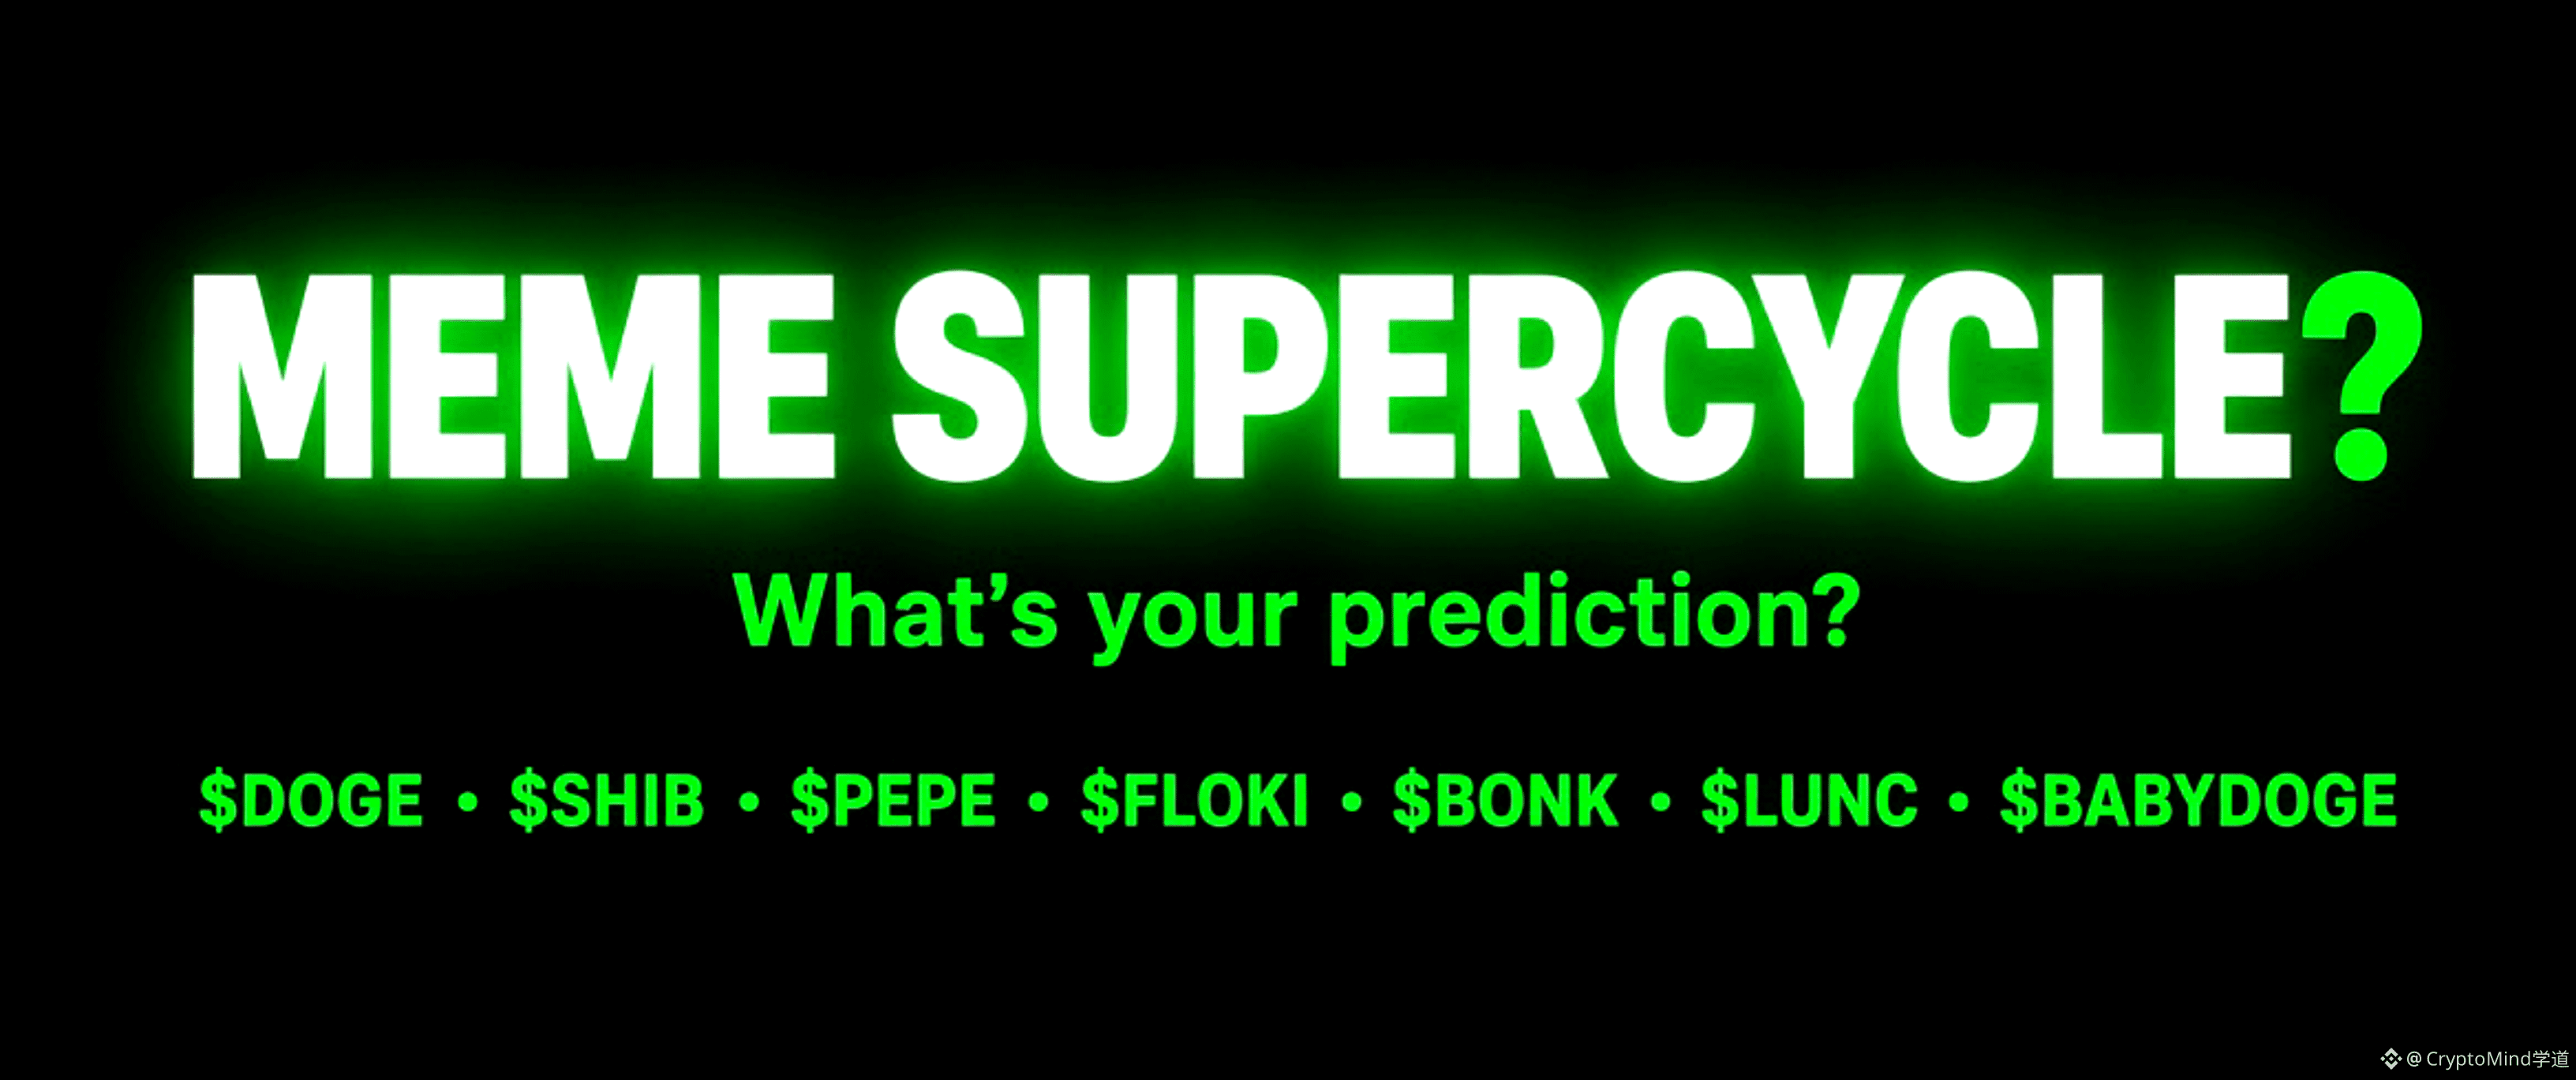
Be honest… have you actually believed a meme list like this before? 🐂
$LUNC 100x
$SHIB 500x
$PEPE 300x
$FLOKI 600x
$BONK 800x
$DOGE 100x
$BABYDOGE 3000x
Looks exciting. Feels familiar. Almost never plays out like the screenshot.
A few memes can run. Most just farm attention.
What’s your real call — which one has a chance, and which one is just noise?
Educational only. Not financial advice. DYOR.
Be honest… have you actually believed a meme list like this before? 🐂
$LUNC 100x
$SHIB 500x
$PEPE 300x
$FLOKI 600x
$BONK 800x
$DOGE 100x
$BABYDOGE 3000x
Looks exciting. Feels familiar. Almost never plays out like the screenshot.
A few memes can run. Most just farm attention.
What’s your real call — which one has a chance, and which one is just noise?
Educational only. Not financial advice. DYOR.
$LUNC 100x
$SHIB 500x
$PEPE 300x
$FLOKI 600x
$BONK 800x
$DOGE 100x
$BABYDOGE 3000x
Looks exciting. Feels familiar. Almost never plays out like the screenshot.
A few memes can run. Most just farm attention.
What’s your real call — which one has a chance, and which one is just noise?
Educational only. Not financial advice. DYOR.
4
19
8.1k
·
--
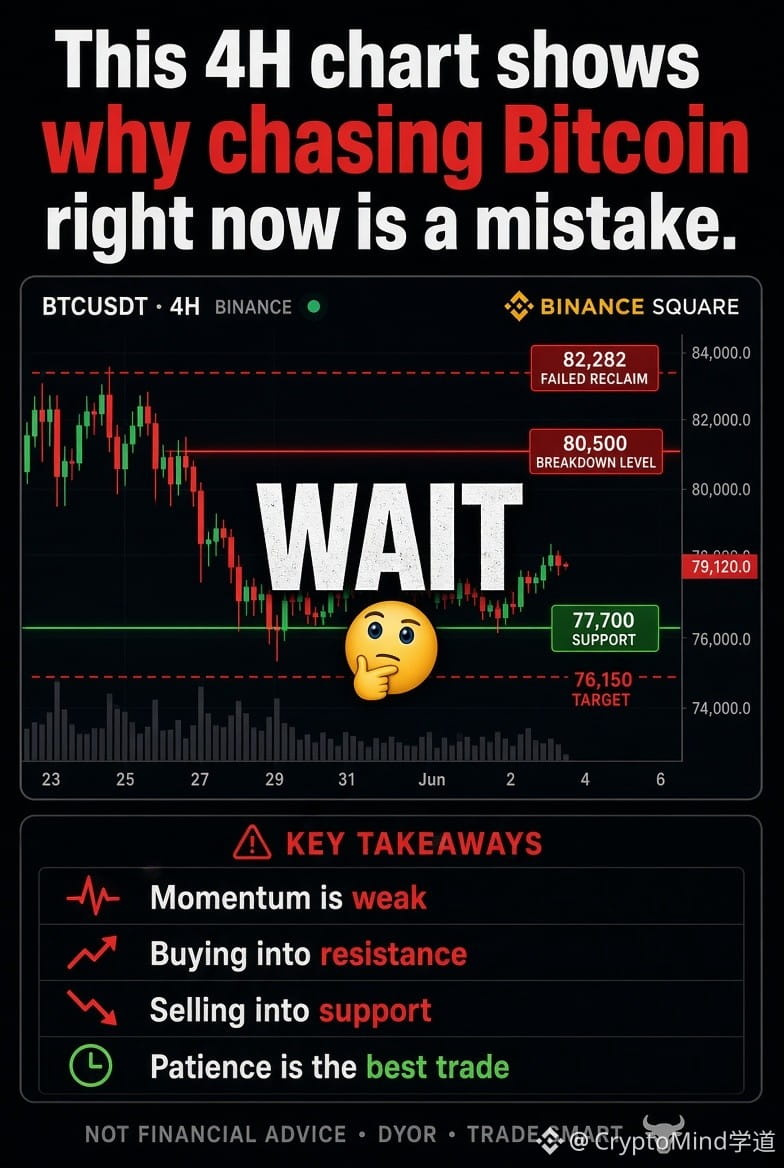
This 4H chart shows why chasing Bitcoin right now is a mistake.
WAIT 🤔
Price is trapped between 77,700 support and the 80,500 breakdown level. We failed to reclaim 82,282, and the recent bounce lacks the volume needed to confirm a reversal. Momentum is weak.
Chasing a long here is buying into resistance. Shorting here is selling into support. The 77,700 level is the line in the sand. Holding it keeps the range intact, but a clean 4H close below it opens the door toward 76,150. On the flip side, we need a strong reclaim of 80,500 with volume to confirm a bullish reversal.
With major macroeconomic data likely dictating short-term volatility, patience is the best trade. Let the market show its hand before committing capital.
What is your trigger level for this range?
{future}(BTCUSDT)
This 4H chart shows why chasing Bitcoin right now is a mistake.
WAIT 🤔
Price is trapped between 77,700 support and the 80,500 breakdown level. We failed to reclaim 82,282, and the recent bounce lacks the volume needed to confirm a reversal. Momentum is weak.
Chasing a long here is buying into resistance. Shorting here is selling into support. The 77,700 level is the line in the sand. Holding it keeps the range intact, but a clean 4H close below it opens the door toward 76,150. On the flip side, we need a strong reclaim of 80,500 with volume to confirm a bullish reversal.
With major macroeconomic data likely dictating short-term volatility, patience is the best trade. Let the market show its hand before committing capital.
What is your trigger level for this range?
WAIT 🤔
Price is trapped between 77,700 support and the 80,500 breakdown level. We failed to reclaim 82,282, and the recent bounce lacks the volume needed to confirm a reversal. Momentum is weak.
Chasing a long here is buying into resistance. Shorting here is selling into support. The 77,700 level is the line in the sand. Holding it keeps the range intact, but a clean 4H close below it opens the door toward 76,150. On the flip side, we need a strong reclaim of 80,500 with volume to confirm a bullish reversal.
With major macroeconomic data likely dictating short-term volatility, patience is the best trade. Let the market show its hand before committing capital.
What is your trigger level for this range?
3
·
--
The chart is giving spot buyers one clean level to watch 👀
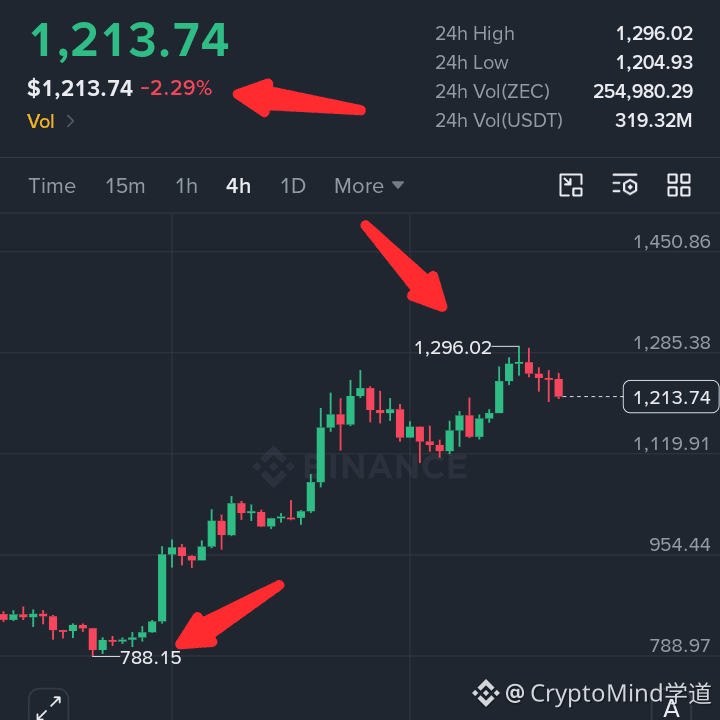
$ZEC just ran from $788 to $1,296 in a few days, and now it’s cooling off near $1,213. That move was backed by real volume and a Grayscale ETF that’s already pulled over $500 million in assets, so this isn’t just a random pump.
Long term setup 👉🏻 $ZEC
Buy Zone: $1,150 to $1,180
Trade here 👇🏻
{spot}(ZECUSDT)
Why this zone matters: it sits right at the recent breakout area and the 4-hour Supertrend support near $1,076. Buyers have stepped in around $1,110 to $1,170 multiple times, so a retest here would be the first real spot entry worth watching.
If ZEC loses $1,040 on a daily close, the short-term structure weakens and a deeper pullback toward $950 becomes likely. That’s the level that would tell me to step back.
The ETF story is the real catalyst here. Grayscale’s ZCSH fund now holds roughly 3% of the circulating ZEC supply, which means real coins are being taken off the market. Combine that with a short squeeze that wiped out millions in bearish positions, and the demand side looks stronger than usual.
But I’m not chasing the green candles at $1,213. The RSI is already overbought and the price is far above its moving averages. A patient spot buyer waits for the zone, not the top of the move.
I’m watching $1,180 for a reaction. Do you think $ZEC holds this breakout or needs a deeper reset first?
The chart is giving spot buyers one clean level to watch 👀
$ZEC just ran from $788 to $1,296 in a few days, and now it’s cooling off near $1,213. That move was backed by real volume and a Grayscale ETF that’s already pulled over $500 million in assets, so this isn’t just a random pump.
Long term setup 👉🏻 $ZEC
Buy Zone: $1,150 to $1,180
Trade here 👇🏻
Why this zone matters: it sits right at the recent breakout area and the 4-hour Supertrend support near $1,076. Buyers have stepped in around $1,110 to $1,170 multiple times, so a retest here would be the first real spot entry worth watching.
If ZEC loses $1,040 on a daily close, the short-term structure weakens and a deeper pullback toward $950 becomes likely. That’s the level that would tell me to step back.
The ETF story is the real catalyst here. Grayscale’s ZCSH fund now holds roughly 3% of the circulating ZEC supply, which means real coins are being taken off the market. Combine that with a short squeeze that wiped out millions in bearish positions, and the demand side looks stronger than usual.
But I’m not chasing the green candles at $1,213. The RSI is already overbought and the price is far above its moving averages. A patient spot buyer waits for the zone, not the top of the move.
I’m watching $1,180 for a reaction. Do you think $ZEC holds this breakout or needs a deeper reset first?
$ZEC just ran from $788 to $1,296 in a few days, and now it’s cooling off near $1,213. That move was backed by real volume and a Grayscale ETF that’s already pulled over $500 million in assets, so this isn’t just a random pump.
Long term setup 👉🏻 $ZEC
Buy Zone: $1,150 to $1,180
Trade here 👇🏻
Why this zone matters: it sits right at the recent breakout area and the 4-hour Supertrend support near $1,076. Buyers have stepped in around $1,110 to $1,170 multiple times, so a retest here would be the first real spot entry worth watching.
If ZEC loses $1,040 on a daily close, the short-term structure weakens and a deeper pullback toward $950 becomes likely. That’s the level that would tell me to step back.
The ETF story is the real catalyst here. Grayscale’s ZCSH fund now holds roughly 3% of the circulating ZEC supply, which means real coins are being taken off the market. Combine that with a short squeeze that wiped out millions in bearish positions, and the demand side looks stronger than usual.
But I’m not chasing the green candles at $1,213. The RSI is already overbought and the price is far above its moving averages. A patient spot buyer waits for the zone, not the top of the move.
I’m watching $1,180 for a reaction. Do you think $ZEC holds this breakout or needs a deeper reset first?
1
68
·
--
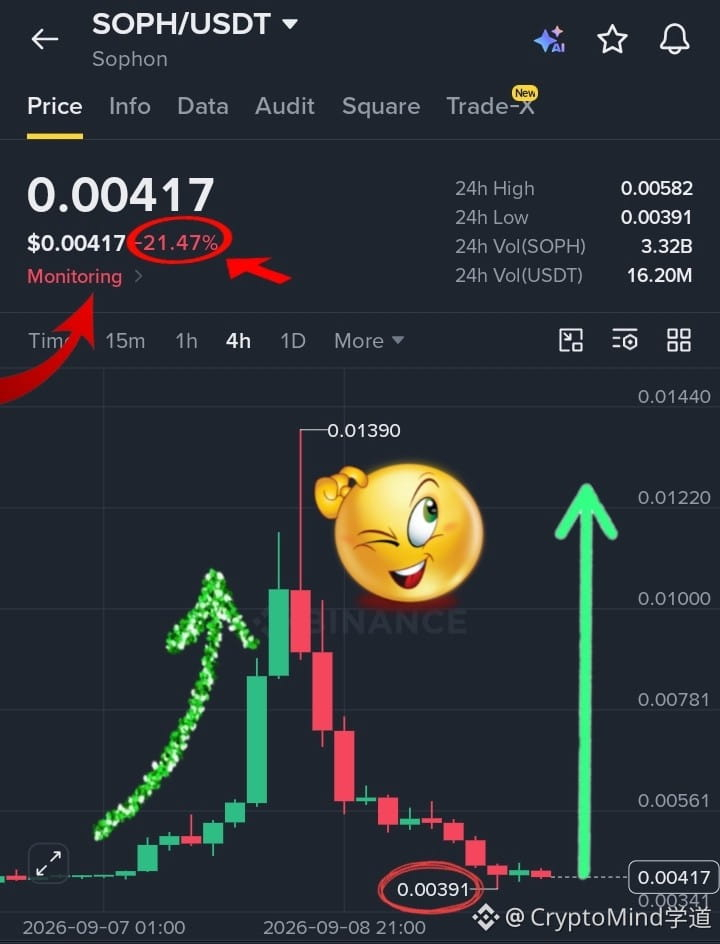
🚨 SOPH is down 21% today, dumping to 0.00391 after that wild 0.01390 spike. The panic is calming down, but this is still a falling knife.
Watching $SOPH for a high-risk bounce off this floor.
🥵 Entry: 0.00400 - 0.00425
🎯 TP1: 0.00485
🎯 TP2: 0.00560
🎯 TP3: 0.00675
I'll secure most of my bag at TP1 and trail the rest toward TP2 and TP3. 💰
{spot}(SOPHUSDT)
That 0.01390 top was a massive liquidity grab. Now price is trying to build a base above 0.00391. High volume suggests sellers might be getting exhausted. A reclaim of 0.00450 could trigger a relief bounce to the old support at 0.00560. Small caps are violent though, size carefully.
If 4H closes below 0.00380, I'm out. Simple.
Catching this knife or waiting for a structure shift?
Follow for more market setups and crypto analysis.
🚨 SOPH is down 21% today, dumping to 0.00391 after that wild 0.01390 spike. The panic is calming down, but this is still a falling knife.
Watching $SOPH for a high-risk bounce off this floor.
🥵 Entry: 0.00400 - 0.00425
🎯 TP1: 0.00485
🎯 TP2: 0.00560
🎯 TP3: 0.00675
I'll secure most of my bag at TP1 and trail the rest toward TP2 and TP3. 💰
That 0.01390 top was a massive liquidity grab. Now price is trying to build a base above 0.00391. High volume suggests sellers might be getting exhausted. A reclaim of 0.00450 could trigger a relief bounce to the old support at 0.00560. Small caps are violent though, size carefully.
If 4H closes below 0.00380, I'm out. Simple.
Catching this knife or waiting for a structure shift?
Follow for more market setups and crypto analysis.
Watching $SOPH for a high-risk bounce off this floor.
🥵 Entry: 0.00400 - 0.00425
🎯 TP1: 0.00485
🎯 TP2: 0.00560
🎯 TP3: 0.00675
I'll secure most of my bag at TP1 and trail the rest toward TP2 and TP3. 💰
That 0.01390 top was a massive liquidity grab. Now price is trying to build a base above 0.00391. High volume suggests sellers might be getting exhausted. A reclaim of 0.00450 could trigger a relief bounce to the old support at 0.00560. Small caps are violent though, size carefully.
If 4H closes below 0.00380, I'm out. Simple.
Catching this knife or waiting for a structure shift?
Follow for more market setups and crypto analysis.
1
109
·
--
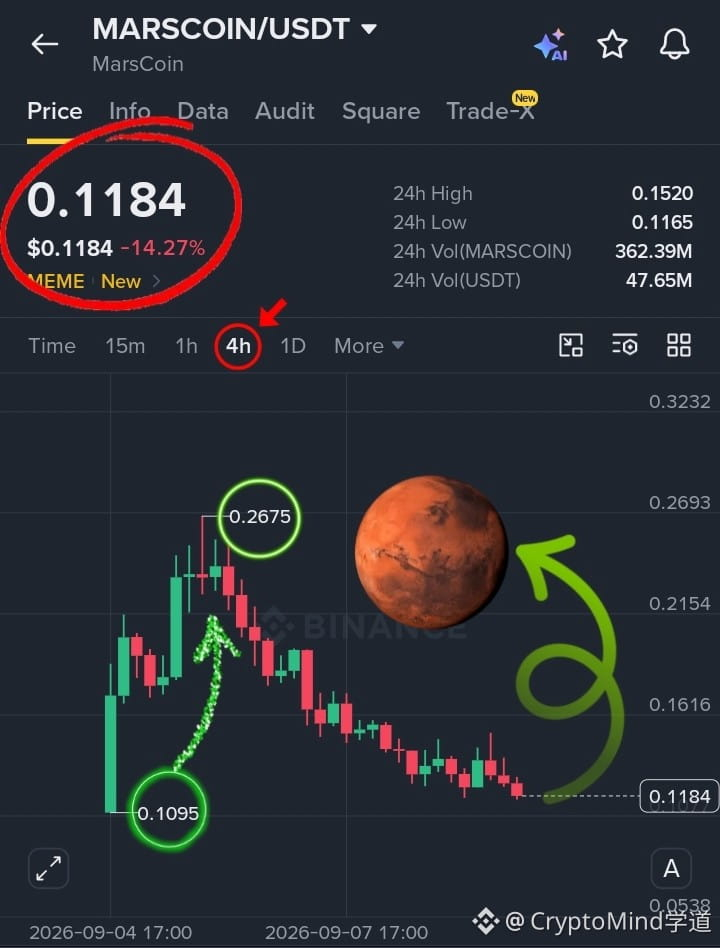
Good Morning, $MARSCOIN got cut in half from its listing peak, and the selling hasn't let up yet.
I’m watching this zone but not rushing in. 👀
{spot}(MARSCOINUSDT)
🐂 Entry: 0.1160 – 0.1200
🎯 TP1: 0.1400
🎯 TP2: 0.1520
🎯 TP3: 0.1750
I’ll take a partial at 0.1400 and let the rest ride toward 0.1520 and 0.1750.
The coin is still fresh — Binance listing on Sept 4 gave it a quick pump to 0.32, but it’s been a straight flush since. Volume is still heavy at 362M, so there’s interest, but sellers are clearly in control. 0.1165 is the only nearby support holding right now. If buyers step in here, a relief bounce toward 0.14–0.15 is possible. But I’m treating this as a high-risk play.
Risk: If it breaks under 0.11, I’m out — that would open the door to much lower levels.
Are you looking for a dead-cat bounce here, or waiting for the dust to settle first?
Not financial advice. Always DYOR.
Good Morning, $MARSCOIN got cut in half from its listing peak, and the selling hasn't let up yet.
I’m watching this zone but not rushing in. 👀
🐂 Entry: 0.1160 – 0.1200
🎯 TP1: 0.1400
🎯 TP2: 0.1520
🎯 TP3: 0.1750
I’ll take a partial at 0.1400 and let the rest ride toward 0.1520 and 0.1750.
The coin is still fresh — Binance listing on Sept 4 gave it a quick pump to 0.32, but it’s been a straight flush since. Volume is still heavy at 362M, so there’s interest, but sellers are clearly in control. 0.1165 is the only nearby support holding right now. If buyers step in here, a relief bounce toward 0.14–0.15 is possible. But I’m treating this as a high-risk play.
Risk: If it breaks under 0.11, I’m out — that would open the door to much lower levels.
Are you looking for a dead-cat bounce here, or waiting for the dust to settle first?
Not financial advice. Always DYOR.
I’m watching this zone but not rushing in. 👀
🐂 Entry: 0.1160 – 0.1200
🎯 TP1: 0.1400
🎯 TP2: 0.1520
🎯 TP3: 0.1750
I’ll take a partial at 0.1400 and let the rest ride toward 0.1520 and 0.1750.
The coin is still fresh — Binance listing on Sept 4 gave it a quick pump to 0.32, but it’s been a straight flush since. Volume is still heavy at 362M, so there’s interest, but sellers are clearly in control. 0.1165 is the only nearby support holding right now. If buyers step in here, a relief bounce toward 0.14–0.15 is possible. But I’m treating this as a high-risk play.
Risk: If it breaks under 0.11, I’m out — that would open the door to much lower levels.
Are you looking for a dead-cat bounce here, or waiting for the dust to settle first?
Not financial advice. Always DYOR.
1
275
·
--
Listen guys, 45% evaporated from 牛来 in 48 hours. BNB is bleeding under 740. One of them is about to get bought—or dumped harder.
🥵 Which way are you leaning?
牛来 collapsed from 0.146 to 0.081 and is now hanging just above the 0.080 level. BNB rejected hard at 758 and is sliding toward 735 support. Both are in clear downtrends, but the risk of a sharp relief bounce is increasing as sellers get exhausted.
For futures traders: watch for a clean break below 0.080 (牛来) or 735 (BNB) to add shorts. If these levels hold, a relief bounce could target 0.090 and 750.
For spot buyers: extreme lows could offer aggressive entries, but waiting for a confirmed reversal is safer.
Buy in spot 👉🏻 $牛来 $BNB
Trade here 👇🏻
{future}(牛来USDT)
{future}(BNBUSDT)
Educational only. Not financial advice. DYOR.
Listen guys, 45% evaporated from 牛来 in 48 hours. BNB is bleeding under 740. One of them is about to get bought—or dumped harder.
🥵 Which way are you leaning?
牛来 collapsed from 0.146 to 0.081 and is now hanging just above the 0.080 level. BNB rejected hard at 758 and is sliding toward 735 support. Both are in clear downtrends, but the risk of a sharp relief bounce is increasing as sellers get exhausted.
For futures traders: watch for a clean break below 0.080 (牛来) or 735 (BNB) to add shorts. If these levels hold, a relief bounce could target 0.090 and 750.
For spot buyers: extreme lows could offer aggressive entries, but waiting for a confirmed reversal is safer.
Buy in spot 👉🏻 $牛来 $BNB
Trade here 👇🏻
Educational only. Not financial advice. DYOR.
🥵 Which way are you leaning?
牛来 collapsed from 0.146 to 0.081 and is now hanging just above the 0.080 level. BNB rejected hard at 758 and is sliding toward 735 support. Both are in clear downtrends, but the risk of a sharp relief bounce is increasing as sellers get exhausted.
For futures traders: watch for a clean break below 0.080 (牛来) or 735 (BNB) to add shorts. If these levels hold, a relief bounce could target 0.090 and 750.
For spot buyers: extreme lows could offer aggressive entries, but waiting for a confirmed reversal is safer.
Buy in spot 👉🏻 $牛来 $BNB
Trade here 👇🏻
Educational only. Not financial advice. DYOR.
🟢 LONG 牛来
🔴 SHORT 牛来
🟢 LONG BNB
🔴 SHORT BNB
11 hr(s) left
2
4.4k
·
--
Partly True
Article
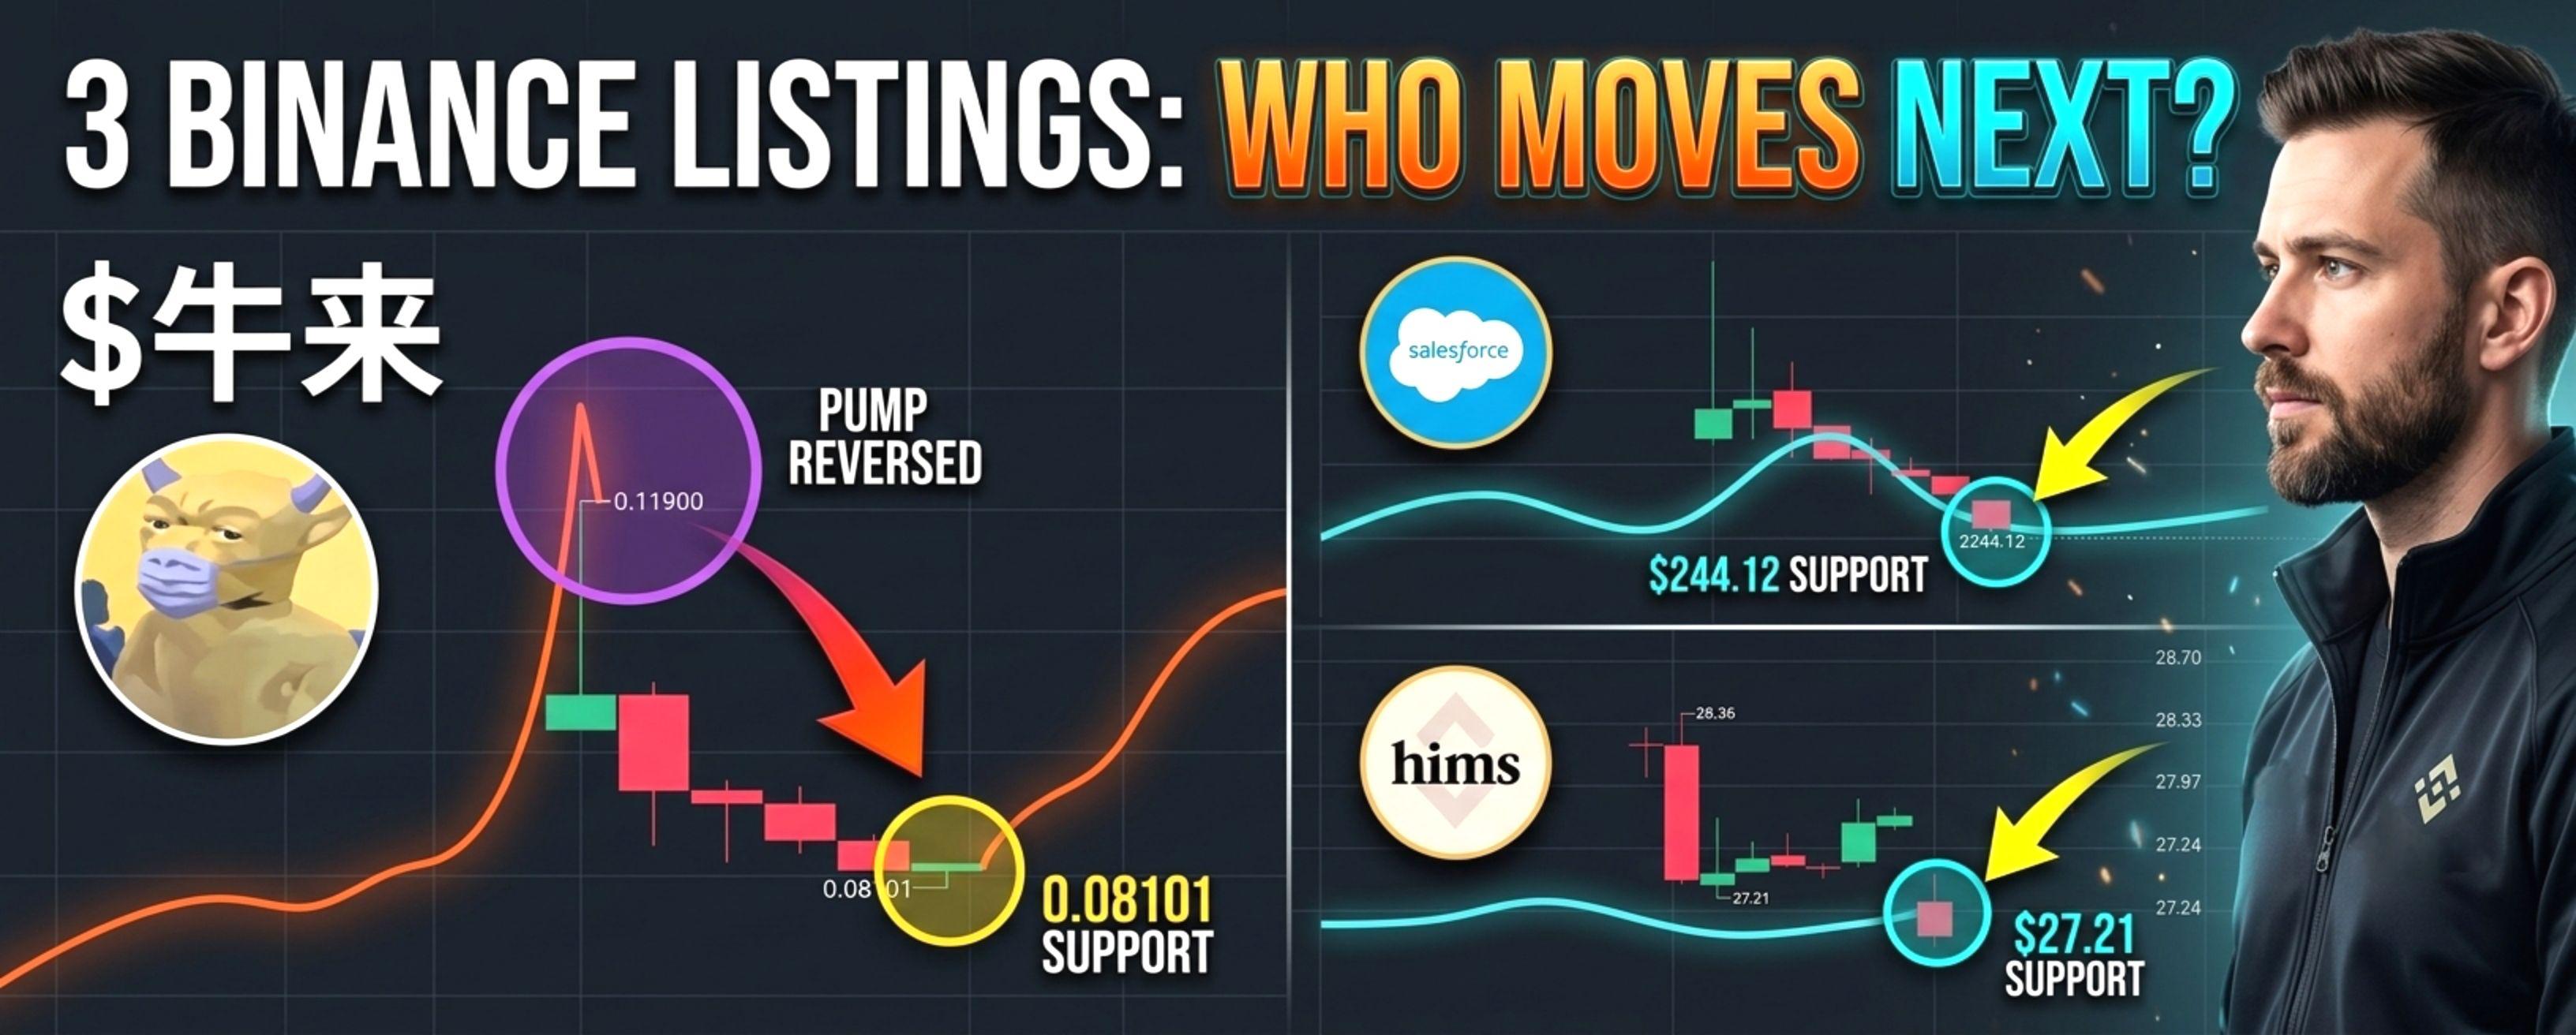
🚨 Three Binance Listings, Three Different Asset ClassesA meme coin, a tokenized tech stock, and a tokenized healthcare stock all hit Binance on the same day. One surged 40% before giving it all back. The other two are holding steady. Here's what traders are watching next.
Market Overview
September 9 delivered a rare moment of diversity on Binance's new listings. Niu Lai, a BNB Chain meme coin, rocketed 40% on the spot listing announcement before surrendering nearly all of those gains. Salesforce (CRMB) and Hims & Hers Health (HIMSB) debuted as tokenized securities (bStocks) with zero maker fees through September 30. Three listings, three very different risk profiles—and three distinct questions about where they go from here.
$牛来 : Binance Listing Pump Reverses—What's Left?
Niu Lai is trading near $0.08332, down over 13 percent on the day, after surging as high as $0.11900 on the Binance spot listing announcement. The token had previously pumped over 150x in a single 24-hour period in August. Now, the listing hype has faded, and the token is testing the $0.08101 low.
The catalyst was clear. Binance announced it would list Niu Lai for spot trading at 20:00 UTC+8 on September 9, opening Niu Lai/USDT, Niu Lai/USDC, and Niu Lai/TRY pairs. The announcement sent the token soaring approximately 40 percent, pushing its market cap above $147 million. But by September 10, the token had given back all of those gains, with its market cap now displayed around $94 million.
牛来 is a meme coin launched on BNB Smart Chain in August 2026, inspired by a Chinese animated film and symbolizing bullish market sentiment. It has a fixed maximum supply of 1 billion tokens with no staking, governance, or emission model. That simplicity is part of its appeal—and its risk.
Entry Consideration: Niu Lai has given back its entire listing pump and is now hovering near the $0.08101 low. A retest of this level could offer a potential reaction zone, but the token's volatility and meme coin structure make this a high-risk setup. Waiting for a confirmed bounce above $0.08332 with volume would provide better confirmation.
Price Projection: If 牛来 holds above $0.08101 and reclaims $0.09389, the next resistance sits at $0.10612. However, the token has already demonstrated that listing pumps can reverse as quickly as they arrive, and the RSI is likely overextended.
Confirmation Signal: A 4-hour close above $0.09389 with strong volume would signal a potential recovery toward $0.10612.
Invalidation: A sustained 4-hour close below $0.08101 would break the immediate support and open the door to $0.06942.
· Support Zone: $0.08101 – $0.06942
· Resistance Level: $0.09389 – $0.10612
Trade here 👇🏻
{spot}(牛来USDT)
$CRMB : Salesforce Tokenized Stock Holds Steady After Debut
CRMB is trading near $244.27, down nearly 2 percent on the day, after Binance listed the Salesforce tokenized security at 20:00 UTC+8 on September 9. The token reached a 24-hour high of $259.66 and is now consolidating near the $244.12 support level.
CRMB is a bStock—a tokenized security representing exposure to Salesforce common stock, issued on the BNB Smart Chain. Binance opened CRMB/USDT and CRMB/USDT spot trading pairs with zero maker fees through September 30. Withdrawals opened at 21:00 UTC+8 on September 9.
The bStock structure allows traders to gain economic exposure to Salesforce without holding the underlying stock, subject to applicable laws. This makes CRMB a fundamentally different asset from a typical cryptocurrency—it tracks the performance of a $250+ billion enterprise software company rather than a speculative token.
The token is currently compressing near the $244.27–$244.12 range after the initial listing volatility. The 24-hour trading volume sits at approximately $294,000, reflecting moderate interest.
Entry Consideration: CRMB is testing the $244.12 support level. A hold above this level could offer a potential reaction zone, but the token's tight range suggests traders are waiting for direction. A break above $246.76 would signal short-term strength.
Price Projection: If CRMB holds above $244.12 and reclaims $246.76, the next resistance sits at $250.18–$253.60. However, the token is still in its first 24 hours of trading, and price discovery is ongoing.
Confirmation Signal: A 4-hour close above $246.76 with volume would signal a recovery toward $250.18.
Invalidation: A sustained 4-hour close below $244.12 would break the immediate support and open the door to $240–$242.
· Support Zone: $244.12 – $240.00
· Resistance Level: $246.76 – $250.18
Trade here 👇🏻
{spot}(CRMBUSDT)
$HIMSB : Hims & Hers Tokenized Stock Finds Its Range
HIMSB is trading near $27.71, down over 1.5 percent on the day, after Binance listed the Hims & Hers Health tokenized security at the same time as CRMB. The token reached a 24-hour high of $28.36 and is now consolidating near the $27.21 support level.
HIMSB is a bStock representing exposure to Hims & Hers Health (HIMS), a telehealth platform providing personalized healthcare services. The token is issued on the BNB Smart Chain and tracks the performance of the underlying stock, which closed at $28.84 on a recent Friday. The HIMSB/USDT trading pair also offers zero maker fees through September 30.
Interestingly, the Robinhood Chain version of HIMS tokens reached as high as $132.64 on Sunday night—more than four times the underlying stock price. That divergence highlights the speculative premium that can exist in tokenized versions of stocks, even when the underlying asset trades on traditional exchanges.
HIMSB is currently trading near the lower end of its 24-hour range, with support at $27.21 and resistance at $28.36. The token's market cap is approximately $564,000.
Entry Consideration: HIMSB is testing the $27.21 support level. A hold above this level could offer a potential reaction zone, but the token is still in price discovery mode. A break above $27.60 would signal short-term strength.
Price Projection: If HIMSB holds above $27.21 and reclaims $27.60, the next resistance sits at $28.33–$28.70. However, the token's all-time high of $27.63 was reached on September 9, suggesting sellers are active near that level.
Confirmation Signal: A 4-hour close above $27.60 with volume would signal a recovery toward $28.33.
Invalidation: A sustained 4-hour close below $27.21 would break the immediate support and open the door to $26.87.
· Support Zone: $27.21 – $26.87
· Resistance Level: $27.60 – $28.33
Trade here 👇🏻
{spot}(HIMSBUSDT)
Three Listings, Three Different Stories
Niu Lai is a pure meme coin play—high volatility, extreme speculation, and a listing pump that reversed almost entirely within 24 hours. The token's simplicity (1 billion fixed supply, no staking, no governance) makes it a pure supply-demand speculation game. CRMB and HIMSB are fundamentally different—they are tokenized securities tracking real-world stocks. Their price action is tied to Salesforce and Hims & Hers Health's performance, not crypto market speculation.
The key question across all three is sustainability. Niu Lai's listing hype has already faded, and the token is testing its post-listing low. CRMB and HIMSB are holding steady, but the zero maker fee period ends September 30, which could affect trading volume and liquidity. The bStock structure also carries regulatory and legal considerations—these are tokenized securities, not cryptocurrencies.
Watch for confirmed 4-hour closes above resistance levels to validate any continuation. Niu Lai needs to break $0.09389; CRMB must clear $246.76; HIMSB needs to reclaim $27.60.
Of these three Binance listings—Niu Lai's meme coin frenzy, CRMB's Salesforce exposure, or HIMSB's healthcare stock token—which one do you think has the most sustainable momentum, and which one carries the highest hidden risk?
Educational only. Not financial advice. Manage risk.
#牛来 #CRMB #HIMSB #Binance #CryptoAnalysis
🚨 Three Binance Listings, Three Different Asset Classes
A meme coin, a tokenized tech stock, and a tokenized healthcare stock all hit Binance on the same day. One surged 40% before giving it all back. The other two are holding steady. Here's what traders are watching next.
Market Overview
September 9 delivered a rare moment of diversity on Binance's new listings. Niu Lai, a BNB Chain meme coin, rocketed 40% on the spot listing announcement before surrendering nearly all of those gains. Salesforce (CRMB) and Hims & Hers Health (HIMSB) debuted as tokenized securities (bStocks) with zero maker fees through September 30. Three listings, three very different risk profiles—and three distinct questions about where they go from here.
$牛来 : Binance Listing Pump Reverses—What's Left?
Niu Lai is trading near $0.08332, down over 13 percent on the day, after surging as high as $0.11900 on the Binance spot listing announcement. The token had previously pumped over 150x in a single 24-hour period in August. Now, the listing hype has faded, and the token is testing the $0.08101 low.
The catalyst was clear. Binance announced it would list Niu Lai for spot trading at 20:00 UTC+8 on September 9, opening Niu Lai/USDT, Niu Lai/USDC, and Niu Lai/TRY pairs. The announcement sent the token soaring approximately 40 percent, pushing its market cap above $147 million. But by September 10, the token had given back all of those gains, with its market cap now displayed around $94 million.
牛来 is a meme coin launched on BNB Smart Chain in August 2026, inspired by a Chinese animated film and symbolizing bullish market sentiment. It has a fixed maximum supply of 1 billion tokens with no staking, governance, or emission model. That simplicity is part of its appeal—and its risk.
Entry Consideration: Niu Lai has given back its entire listing pump and is now hovering near the $0.08101 low. A retest of this level could offer a potential reaction zone, but the token's volatility and meme coin structure make this a high-risk setup. Waiting for a confirmed bounce above $0.08332 with volume would provide better confirmation.
Price Projection: If 牛来 holds above $0.08101 and reclaims $0.09389, the next resistance sits at $0.10612. However, the token has already demonstrated that listing pumps can reverse as quickly as they arrive, and the RSI is likely overextended.
Confirmation Signal: A 4-hour close above $0.09389 with strong volume would signal a potential recovery toward $0.10612.
Invalidation: A sustained 4-hour close below $0.08101 would break the immediate support and open the door to $0.06942.
· Support Zone: $0.08101 – $0.06942
· Resistance Level: $0.09389 – $0.10612
Trade here 👇🏻
$CRMB : Salesforce Tokenized Stock Holds Steady After Debut
CRMB is trading near $244.27, down nearly 2 percent on the day, after Binance listed the Salesforce tokenized security at 20:00 UTC+8 on September 9. The token reached a 24-hour high of $259.66 and is now consolidating near the $244.12 support level.
CRMB is a bStock—a tokenized security representing exposure to Salesforce common stock, issued on the BNB Smart Chain. Binance opened CRMB/USDT and CRMB/USDT spot trading pairs with zero maker fees through September 30. Withdrawals opened at 21:00 UTC+8 on September 9.
The bStock structure allows traders to gain economic exposure to Salesforce without holding the underlying stock, subject to applicable laws. This makes CRMB a fundamentally different asset from a typical cryptocurrency—it tracks the performance of a $250+ billion enterprise software company rather than a speculative token.
The token is currently compressing near the $244.27–$244.12 range after the initial listing volatility. The 24-hour trading volume sits at approximately $294,000, reflecting moderate interest.
Entry Consideration: CRMB is testing the $244.12 support level. A hold above this level could offer a potential reaction zone, but the token's tight range suggests traders are waiting for direction. A break above $246.76 would signal short-term strength.
Price Projection: If CRMB holds above $244.12 and reclaims $246.76, the next resistance sits at $250.18–$253.60. However, the token is still in its first 24 hours of trading, and price discovery is ongoing.
Confirmation Signal: A 4-hour close above $246.76 with volume would signal a recovery toward $250.18.
Invalidation: A sustained 4-hour close below $244.12 would break the immediate support and open the door to $240–$242.
· Support Zone: $244.12 – $240.00
· Resistance Level: $246.76 – $250.18
Trade here 👇🏻
$HIMSB : Hims & Hers Tokenized Stock Finds Its Range
HIMSB is trading near $27.71, down over 1.5 percent on the day, after Binance listed the Hims & Hers Health tokenized security at the same time as CRMB. The token reached a 24-hour high of $28.36 and is now consolidating near the $27.21 support level.
HIMSB is a bStock representing exposure to Hims & Hers Health (HIMS), a telehealth platform providing personalized healthcare services. The token is issued on the BNB Smart Chain and tracks the performance of the underlying stock, which closed at $28.84 on a recent Friday. The HIMSB/USDT trading pair also offers zero maker fees through September 30.
Interestingly, the Robinhood Chain version of HIMS tokens reached as high as $132.64 on Sunday night—more than four times the underlying stock price. That divergence highlights the speculative premium that can exist in tokenized versions of stocks, even when the underlying asset trades on traditional exchanges.
HIMSB is currently trading near the lower end of its 24-hour range, with support at $27.21 and resistance at $28.36. The token's market cap is approximately $564,000.
Entry Consideration: HIMSB is testing the $27.21 support level. A hold above this level could offer a potential reaction zone, but the token is still in price discovery mode. A break above $27.60 would signal short-term strength.
Price Projection: If HIMSB holds above $27.21 and reclaims $27.60, the next resistance sits at $28.33–$28.70. However, the token's all-time high of $27.63 was reached on September 9, suggesting sellers are active near that level.
Confirmation Signal: A 4-hour close above $27.60 with volume would signal a recovery toward $28.33.
Invalidation: A sustained 4-hour close below $27.21 would break the immediate support and open the door to $26.87.
· Support Zone: $27.21 – $26.87
· Resistance Level: $27.60 – $28.33
Trade here 👇🏻
Three Listings, Three Different Stories
Niu Lai is a pure meme coin play—high volatility, extreme speculation, and a listing pump that reversed almost entirely within 24 hours. The token's simplicity (1 billion fixed supply, no staking, no governance) makes it a pure supply-demand speculation game. CRMB and HIMSB are fundamentally different—they are tokenized securities tracking real-world stocks. Their price action is tied to Salesforce and Hims & Hers Health's performance, not crypto market speculation.
The key question across all three is sustainability. Niu Lai's listing hype has already faded, and the token is testing its post-listing low. CRMB and HIMSB are holding steady, but the zero maker fee period ends September 30, which could affect trading volume and liquidity. The bStock structure also carries regulatory and legal considerations—these are tokenized securities, not cryptocurrencies.
Watch for confirmed 4-hour closes above resistance levels to validate any continuation. Niu Lai needs to break $0.09389; CRMB must clear $246.76; HIMSB needs to reclaim $27.60.
Of these three Binance listings—Niu Lai's meme coin frenzy, CRMB's Salesforce exposure, or HIMSB's healthcare stock token—which one do you think has the most sustainable momentum, and which one carries the highest hidden risk?
Educational only. Not financial advice. Manage risk.
#牛来 #CRMB #HIMSB #Binance #CryptoAnalysis
Market Overview
September 9 delivered a rare moment of diversity on Binance's new listings. Niu Lai, a BNB Chain meme coin, rocketed 40% on the spot listing announcement before surrendering nearly all of those gains. Salesforce (CRMB) and Hims & Hers Health (HIMSB) debuted as tokenized securities (bStocks) with zero maker fees through September 30. Three listings, three very different risk profiles—and three distinct questions about where they go from here.
$牛来 : Binance Listing Pump Reverses—What's Left?
Niu Lai is trading near $0.08332, down over 13 percent on the day, after surging as high as $0.11900 on the Binance spot listing announcement. The token had previously pumped over 150x in a single 24-hour period in August. Now, the listing hype has faded, and the token is testing the $0.08101 low.
The catalyst was clear. Binance announced it would list Niu Lai for spot trading at 20:00 UTC+8 on September 9, opening Niu Lai/USDT, Niu Lai/USDC, and Niu Lai/TRY pairs. The announcement sent the token soaring approximately 40 percent, pushing its market cap above $147 million. But by September 10, the token had given back all of those gains, with its market cap now displayed around $94 million.
牛来 is a meme coin launched on BNB Smart Chain in August 2026, inspired by a Chinese animated film and symbolizing bullish market sentiment. It has a fixed maximum supply of 1 billion tokens with no staking, governance, or emission model. That simplicity is part of its appeal—and its risk.
Entry Consideration: Niu Lai has given back its entire listing pump and is now hovering near the $0.08101 low. A retest of this level could offer a potential reaction zone, but the token's volatility and meme coin structure make this a high-risk setup. Waiting for a confirmed bounce above $0.08332 with volume would provide better confirmation.
Price Projection: If 牛来 holds above $0.08101 and reclaims $0.09389, the next resistance sits at $0.10612. However, the token has already demonstrated that listing pumps can reverse as quickly as they arrive, and the RSI is likely overextended.
Confirmation Signal: A 4-hour close above $0.09389 with strong volume would signal a potential recovery toward $0.10612.
Invalidation: A sustained 4-hour close below $0.08101 would break the immediate support and open the door to $0.06942.
· Support Zone: $0.08101 – $0.06942
· Resistance Level: $0.09389 – $0.10612
Trade here 👇🏻
$CRMB : Salesforce Tokenized Stock Holds Steady After Debut
CRMB is trading near $244.27, down nearly 2 percent on the day, after Binance listed the Salesforce tokenized security at 20:00 UTC+8 on September 9. The token reached a 24-hour high of $259.66 and is now consolidating near the $244.12 support level.
CRMB is a bStock—a tokenized security representing exposure to Salesforce common stock, issued on the BNB Smart Chain. Binance opened CRMB/USDT and CRMB/USDT spot trading pairs with zero maker fees through September 30. Withdrawals opened at 21:00 UTC+8 on September 9.
The bStock structure allows traders to gain economic exposure to Salesforce without holding the underlying stock, subject to applicable laws. This makes CRMB a fundamentally different asset from a typical cryptocurrency—it tracks the performance of a $250+ billion enterprise software company rather than a speculative token.
The token is currently compressing near the $244.27–$244.12 range after the initial listing volatility. The 24-hour trading volume sits at approximately $294,000, reflecting moderate interest.
Entry Consideration: CRMB is testing the $244.12 support level. A hold above this level could offer a potential reaction zone, but the token's tight range suggests traders are waiting for direction. A break above $246.76 would signal short-term strength.
Price Projection: If CRMB holds above $244.12 and reclaims $246.76, the next resistance sits at $250.18–$253.60. However, the token is still in its first 24 hours of trading, and price discovery is ongoing.
Confirmation Signal: A 4-hour close above $246.76 with volume would signal a recovery toward $250.18.
Invalidation: A sustained 4-hour close below $244.12 would break the immediate support and open the door to $240–$242.
· Support Zone: $244.12 – $240.00
· Resistance Level: $246.76 – $250.18
Trade here 👇🏻
$HIMSB : Hims & Hers Tokenized Stock Finds Its Range
HIMSB is trading near $27.71, down over 1.5 percent on the day, after Binance listed the Hims & Hers Health tokenized security at the same time as CRMB. The token reached a 24-hour high of $28.36 and is now consolidating near the $27.21 support level.
HIMSB is a bStock representing exposure to Hims & Hers Health (HIMS), a telehealth platform providing personalized healthcare services. The token is issued on the BNB Smart Chain and tracks the performance of the underlying stock, which closed at $28.84 on a recent Friday. The HIMSB/USDT trading pair also offers zero maker fees through September 30.
Interestingly, the Robinhood Chain version of HIMS tokens reached as high as $132.64 on Sunday night—more than four times the underlying stock price. That divergence highlights the speculative premium that can exist in tokenized versions of stocks, even when the underlying asset trades on traditional exchanges.
HIMSB is currently trading near the lower end of its 24-hour range, with support at $27.21 and resistance at $28.36. The token's market cap is approximately $564,000.
Entry Consideration: HIMSB is testing the $27.21 support level. A hold above this level could offer a potential reaction zone, but the token is still in price discovery mode. A break above $27.60 would signal short-term strength.
Price Projection: If HIMSB holds above $27.21 and reclaims $27.60, the next resistance sits at $28.33–$28.70. However, the token's all-time high of $27.63 was reached on September 9, suggesting sellers are active near that level.
Confirmation Signal: A 4-hour close above $27.60 with volume would signal a recovery toward $28.33.
Invalidation: A sustained 4-hour close below $27.21 would break the immediate support and open the door to $26.87.
· Support Zone: $27.21 – $26.87
· Resistance Level: $27.60 – $28.33
Trade here 👇🏻
Three Listings, Three Different Stories
Niu Lai is a pure meme coin play—high volatility, extreme speculation, and a listing pump that reversed almost entirely within 24 hours. The token's simplicity (1 billion fixed supply, no staking, no governance) makes it a pure supply-demand speculation game. CRMB and HIMSB are fundamentally different—they are tokenized securities tracking real-world stocks. Their price action is tied to Salesforce and Hims & Hers Health's performance, not crypto market speculation.
The key question across all three is sustainability. Niu Lai's listing hype has already faded, and the token is testing its post-listing low. CRMB and HIMSB are holding steady, but the zero maker fee period ends September 30, which could affect trading volume and liquidity. The bStock structure also carries regulatory and legal considerations—these are tokenized securities, not cryptocurrencies.
Watch for confirmed 4-hour closes above resistance levels to validate any continuation. Niu Lai needs to break $0.09389; CRMB must clear $246.76; HIMSB needs to reclaim $27.60.
Of these three Binance listings—Niu Lai's meme coin frenzy, CRMB's Salesforce exposure, or HIMSB's healthcare stock token—which one do you think has the most sustainable momentum, and which one carries the highest hidden risk?
Educational only. Not financial advice. Manage risk.
#牛来 #CRMB #HIMSB #Binance #CryptoAnalysis
1
397
·
--
Bullish
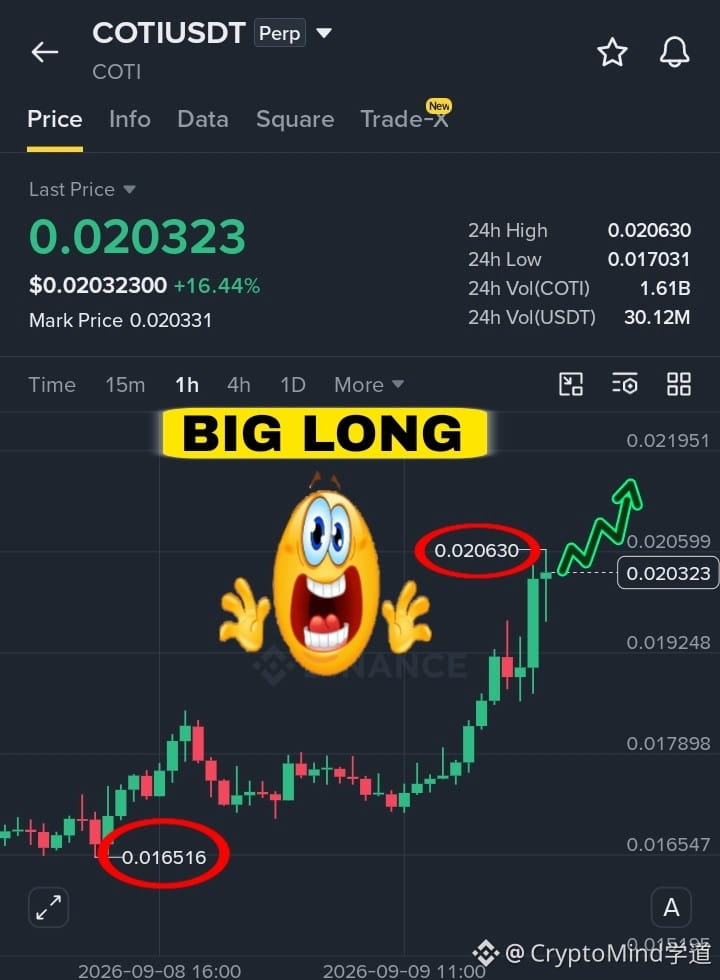
$COTI just broke out of a 3-month downtrend — but this is where real resistance begins.
🟢 Bullish setup on $COTI
📍 Entry: 0.0195 to 0.0200
🎯 TP1: 0.0206
🎯 TP2: 0.0219
🎯 TP3: 0.0240
🛑 Stop Loss: 0.0188
Potential reward-to-risk: approximately 1.2R / 2.5R / 4.5R across the targets.
Consider proper position sizing and secure partial profits at each target to reduce exposure.
Why this setup stands out
$COTI broke above the 0.0179 resistance with strong volume, and the 4H structure is showing higher highs forming. The Privacy-Preserving Layer 2 project is gaining traction following its Wallypay integration and GDPR-aligned compliance narrative. The token is now approaching the 0.0206 resistance, a key level that has capped price since early August.
Position Management
Recommended 3x–5x leverage for this setup. The support is holding, and the upside has room to run toward the targets. Good liquidity ensures smooth execution.
Risk
A close below 0.0188 would break the support structure and invalidate this setup.
Will 0.0206 resistance break, or is this just another rejection?
Educational only. Not financial advice. DYOR.
Trade here 👇🏻
{future}(COTIUSDT)
$COTI just broke out of a 3-month downtrend — but this is where real resistance begins.
🟢 Bullish setup on $COTI
📍 Entry: 0.0195 to 0.0200
🎯 TP1: 0.0206
🎯 TP2: 0.0219
🎯 TP3: 0.0240
🛑 Stop Loss: 0.0188
Potential reward-to-risk: approximately 1.2R / 2.5R / 4.5R across the targets.
Consider proper position sizing and secure partial profits at each target to reduce exposure.
Why this setup stands out
$COTI broke above the 0.0179 resistance with strong volume, and the 4H structure is showing higher highs forming. The Privacy-Preserving Layer 2 project is gaining traction following its Wallypay integration and GDPR-aligned compliance narrative. The token is now approaching the 0.0206 resistance, a key level that has capped price since early August.
Position Management
Recommended 3x–5x leverage for this setup. The support is holding, and the upside has room to run toward the targets. Good liquidity ensures smooth execution.
Risk
A close below 0.0188 would break the support structure and invalidate this setup.
Will 0.0206 resistance break, or is this just another rejection?
Educational only. Not financial advice. DYOR.
Trade here 👇🏻
🟢 Bullish setup on $COTI
📍 Entry: 0.0195 to 0.0200
🎯 TP1: 0.0206
🎯 TP2: 0.0219
🎯 TP3: 0.0240
🛑 Stop Loss: 0.0188
Potential reward-to-risk: approximately 1.2R / 2.5R / 4.5R across the targets.
Consider proper position sizing and secure partial profits at each target to reduce exposure.
Why this setup stands out
$COTI broke above the 0.0179 resistance with strong volume, and the 4H structure is showing higher highs forming. The Privacy-Preserving Layer 2 project is gaining traction following its Wallypay integration and GDPR-aligned compliance narrative. The token is now approaching the 0.0206 resistance, a key level that has capped price since early August.
Position Management
Recommended 3x–5x leverage for this setup. The support is holding, and the upside has room to run toward the targets. Good liquidity ensures smooth execution.
Risk
A close below 0.0188 would break the support structure and invalidate this setup.
Will 0.0206 resistance break, or is this just another rejection?
Educational only. Not financial advice. DYOR.
Trade here 👇🏻
1
47
·
--
Bullish
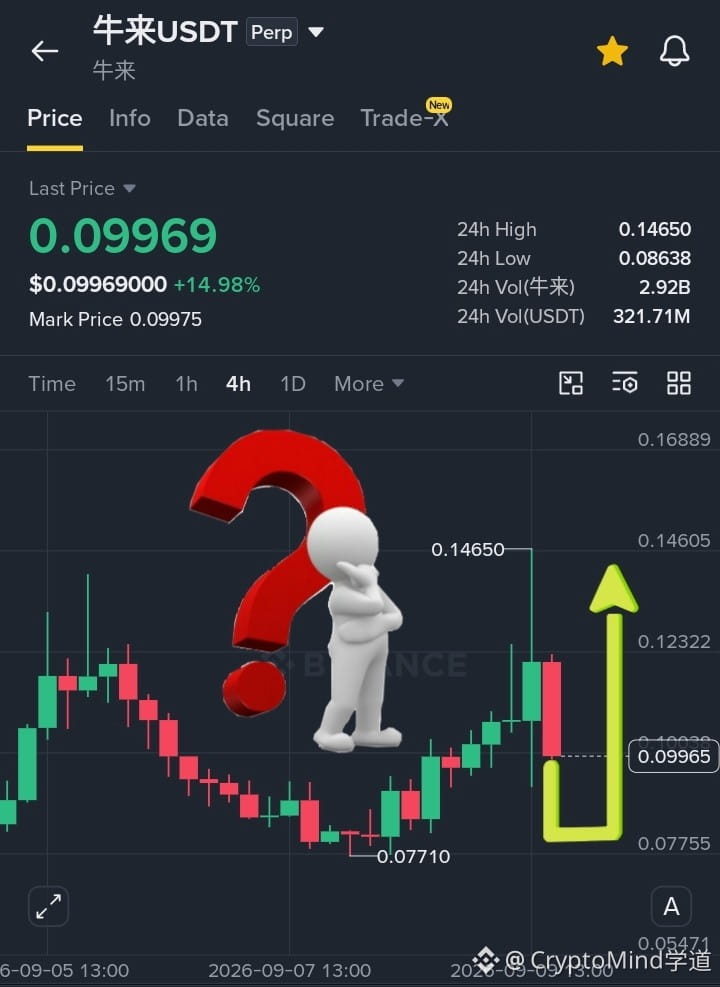
$牛来 is trying to hold the 0.086 support after that wild rejection. Price bounced but still trades below the mid-range. Volume remains elevated.
Not chasing this move. Prefer to wait for a clear structure around the lows.
Entry: 0.087 - 0.090
TP1: 0.105
TP2: 0.123
TP3: 0.140
SL: 0.080
Leverage: 2x-3x
{future}(牛来USDT)
Scale at TP1, move stop to entry, let the rest run.
The daily range is massive: 0.086 to 0.146. Current price at 0.099 is right in the middle. For a long setup to be valid, price must defend the 0.086 zone and reclaim 0.105. If that happens, momentum could carry it toward the upper half. No clear catalyst visible from the chart alone.
Invalidation if 0.080 breaks.
Are you watching this range for a bounce or waiting for a clean break?
Educational only. Not financial advice.
$牛来 is trying to hold the 0.086 support after that wild rejection. Price bounced but still trades below the mid-range. Volume remains elevated.
Not chasing this move. Prefer to wait for a clear structure around the lows.
Entry: 0.087 - 0.090
TP1: 0.105
TP2: 0.123
TP3: 0.140
SL: 0.080
Leverage: 2x-3x
Scale at TP1, move stop to entry, let the rest run.
The daily range is massive: 0.086 to 0.146. Current price at 0.099 is right in the middle. For a long setup to be valid, price must defend the 0.086 zone and reclaim 0.105. If that happens, momentum could carry it toward the upper half. No clear catalyst visible from the chart alone.
Invalidation if 0.080 breaks.
Are you watching this range for a bounce or waiting for a clean break?
Educational only. Not financial advice.
Not chasing this move. Prefer to wait for a clear structure around the lows.
Entry: 0.087 - 0.090
TP1: 0.105
TP2: 0.123
TP3: 0.140
SL: 0.080
Leverage: 2x-3x
Scale at TP1, move stop to entry, let the rest run.
The daily range is massive: 0.086 to 0.146. Current price at 0.099 is right in the middle. For a long setup to be valid, price must defend the 0.086 zone and reclaim 0.105. If that happens, momentum could carry it toward the upper half. No clear catalyst visible from the chart alone.
Invalidation if 0.080 breaks.
Are you watching this range for a bounce or waiting for a clean break?
Educational only. Not financial advice.
1
576
·
--
Article
When the Perp Outgrows the UnderlyingSomething unusual is happening in the futures market. Two ETFs that barely existed in the crypto space eighteen months ago are now among the most actively traded perpetual contracts on Binance. SOXL, a 3x leveraged semiconductor ETF, and KORU, a 3x leveraged South Korea ETF, have attracted massive speculative flow. But the price action tells a more complicated story than simple bullishness.
The Numbers That Stand Out
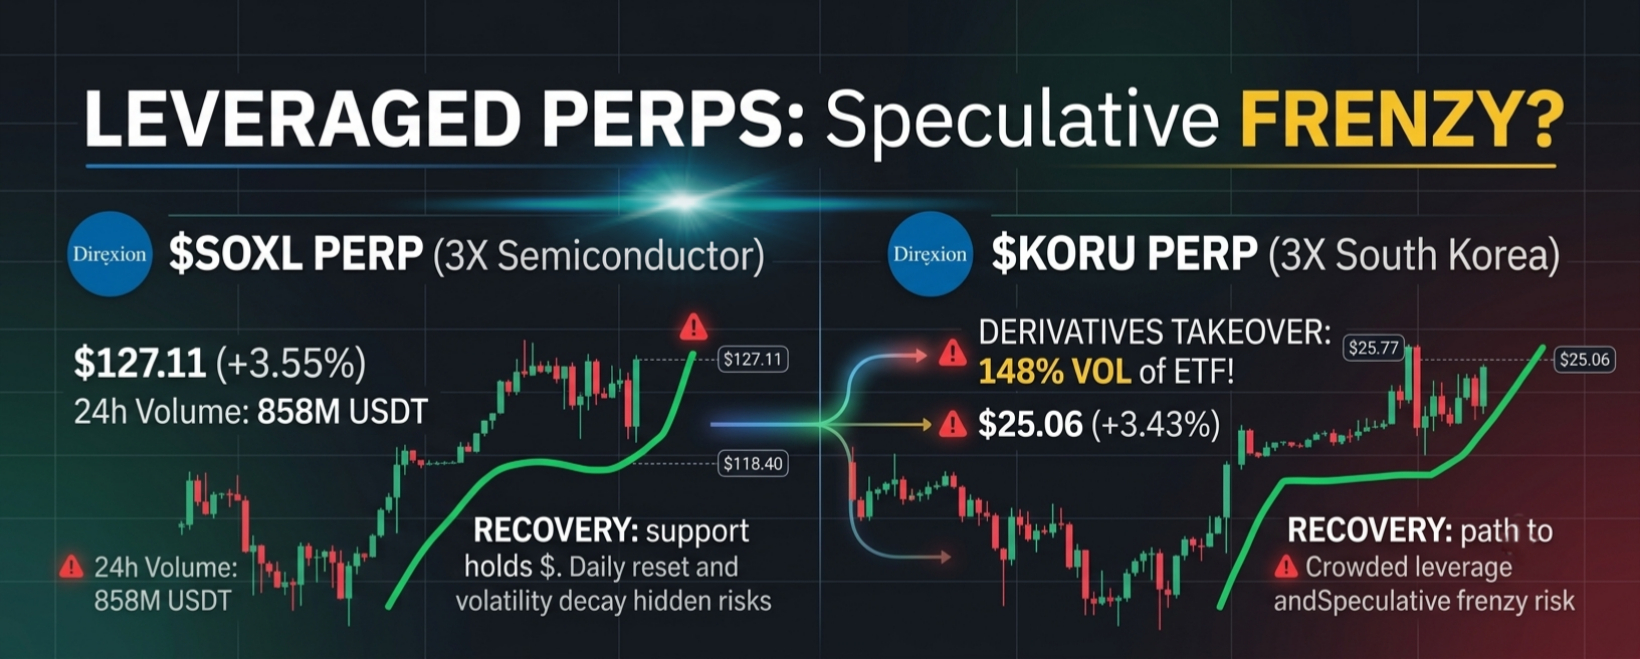
SOXLUSDT is trading at 127.11, up 3.55% in the last 24 hours. The contract hit a high of 127.62 and a low of 118.40. Volume is substantial: 6.95 million SOXL contracts traded, representing 858 million USDT in notional value.
KORUUSDT is at 25.06, up 3.43%, with a 24-hour range between 25.11 and 23.57. The volume here is even more striking relative to the price: 20.75 million KORU contracts traded, worth 504 million USDT.
These are not small numbers. SOXL has led the ETF perpetual market with 41.97 billion dollars in cumulative volume, followed by KORU at 16.15 billion. But the more revealing statistic is this: KORU's perpetual contract traded at 148% of the volume of its underlying ETF. More money is changing hands in the crypto derivative than in the actual ETF it is based on.
The Price Structure
$SOXL has been in a clear recovery. The 24-hour low of 118.40 shows where buyers stepped in. The resistance at 127.62 is the immediate hurdle. A break above that level could open the path toward 128.99 and potentially 130.51. But what concerns me is the gap between the futures price and the spot price. SOXL stock is at 127.083, while the perpetual is at 127.11, a premium of just 0.03 dollars.
$KORU shows a similar pattern. The stock trades at 25.105, while the perpetual is at 25.06, a slight discount. This suggests that futures traders are not aggressively bidding up these contracts. The enthusiasm is there, but it is measured.
The Bigger Picture
The ETF perpetual market has grown at an average rate of 170% month-over-month. Binance now commands 74% of this market. These contracts now represent roughly 30% of Binance's total TradFi perpetual activity.
But there is a tension. Retail investors have been selling individual semiconductor stocks like Nvidia and Micron while simultaneously buying leveraged ETFs like SOXL. They are taking profits on individual names but maintaining exposure to the sector through leveraged products. That is a positioning choice that carries hidden risks.
SOXL's realized volatility can exceed 90%. The fund resets daily, meaning a chop pattern of up 10% then down 10% leaves the underlying flat but the 3x fund down. This volatility decay erodes returns even when the underlying index eventually recovers.
What I Would Watch
For SOXL, the 118.40 low is the key support. If price holds above this level and breaks 127.62, the bullish structure remains intact. The next targets would be 128.99 and 130.51. But if SOXL loses 118.40, the correction could accelerate toward 110.53.
{future}(SOXLUSDT)
For KORU, the support at 23.57 is critical. The resistance at 25.11 is the immediate barrier. A break above that could target 25.77. The 24-hour volume of 20.75 million contracts suggests there is real interest, but much of it may be speculative.
{future}(KORUUSDT)
My Take
I am watching this market, but I am not chasing it. The volume is impressive, but the positioning is becoming crowded. KORU's perpetual trading at 148% of its underlying ETF's volume is a warning sign. It suggests that leverage is driving the price action more than genuine demand.
The part I would be careful with is the volatility decay. These are 3x leveraged products designed for daily trading, not long-term holds. Holding them through a choppy market can erode value even if the underlying index moves in your favor.
I would rather wait for a pullback to support levels before considering entries. The liquidity is there, but the risk is real.
One Question
With KORU's perpetual contract now trading at 148% of its underlying ETF's volume, do you see this as a sign of growing institutional interest in crypto-based TradFi exposure, or a speculative retail frenzy that could unwind violently?
Educational only. Not financial advice. Manage risk.
#ETFPerpetuals #LeveragedETFs #KORU #BinanceFutures #SOXLUSDT
When the Perp Outgrows the Underlying
Something unusual is happening in the futures market. Two ETFs that barely existed in the crypto space eighteen months ago are now among the most actively traded perpetual contracts on Binance. SOXL, a 3x leveraged semiconductor ETF, and KORU, a 3x leveraged South Korea ETF, have attracted massive speculative flow. But the price action tells a more complicated story than simple bullishness.
The Numbers That Stand Out
SOXLUSDT is trading at 127.11, up 3.55% in the last 24 hours. The contract hit a high of 127.62 and a low of 118.40. Volume is substantial: 6.95 million SOXL contracts traded, representing 858 million USDT in notional value.
KORUUSDT is at 25.06, up 3.43%, with a 24-hour range between 25.11 and 23.57. The volume here is even more striking relative to the price: 20.75 million KORU contracts traded, worth 504 million USDT.
These are not small numbers. SOXL has led the ETF perpetual market with 41.97 billion dollars in cumulative volume, followed by KORU at 16.15 billion. But the more revealing statistic is this: KORU's perpetual contract traded at 148% of the volume of its underlying ETF. More money is changing hands in the crypto derivative than in the actual ETF it is based on.
The Price Structure
$SOXL has been in a clear recovery. The 24-hour low of 118.40 shows where buyers stepped in. The resistance at 127.62 is the immediate hurdle. A break above that level could open the path toward 128.99 and potentially 130.51. But what concerns me is the gap between the futures price and the spot price. SOXL stock is at 127.083, while the perpetual is at 127.11, a premium of just 0.03 dollars.
$KORU shows a similar pattern. The stock trades at 25.105, while the perpetual is at 25.06, a slight discount. This suggests that futures traders are not aggressively bidding up these contracts. The enthusiasm is there, but it is measured.
The Bigger Picture
The ETF perpetual market has grown at an average rate of 170% month-over-month. Binance now commands 74% of this market. These contracts now represent roughly 30% of Binance's total TradFi perpetual activity.
But there is a tension. Retail investors have been selling individual semiconductor stocks like Nvidia and Micron while simultaneously buying leveraged ETFs like SOXL. They are taking profits on individual names but maintaining exposure to the sector through leveraged products. That is a positioning choice that carries hidden risks.
SOXL's realized volatility can exceed 90%. The fund resets daily, meaning a chop pattern of up 10% then down 10% leaves the underlying flat but the 3x fund down. This volatility decay erodes returns even when the underlying index eventually recovers.
What I Would Watch
For SOXL, the 118.40 low is the key support. If price holds above this level and breaks 127.62, the bullish structure remains intact. The next targets would be 128.99 and 130.51. But if SOXL loses 118.40, the correction could accelerate toward 110.53.
For KORU, the support at 23.57 is critical. The resistance at 25.11 is the immediate barrier. A break above that could target 25.77. The 24-hour volume of 20.75 million contracts suggests there is real interest, but much of it may be speculative.
My Take
I am watching this market, but I am not chasing it. The volume is impressive, but the positioning is becoming crowded. KORU's perpetual trading at 148% of its underlying ETF's volume is a warning sign. It suggests that leverage is driving the price action more than genuine demand.
The part I would be careful with is the volatility decay. These are 3x leveraged products designed for daily trading, not long-term holds. Holding them through a choppy market can erode value even if the underlying index moves in your favor.
I would rather wait for a pullback to support levels before considering entries. The liquidity is there, but the risk is real.
One Question
With KORU's perpetual contract now trading at 148% of its underlying ETF's volume, do you see this as a sign of growing institutional interest in crypto-based TradFi exposure, or a speculative retail frenzy that could unwind violently?
Educational only. Not financial advice. Manage risk.
#ETFPerpetuals #LeveragedETFs #KORU #BinanceFutures #SOXLUSDT
The Numbers That Stand Out
SOXLUSDT is trading at 127.11, up 3.55% in the last 24 hours. The contract hit a high of 127.62 and a low of 118.40. Volume is substantial: 6.95 million SOXL contracts traded, representing 858 million USDT in notional value.
KORUUSDT is at 25.06, up 3.43%, with a 24-hour range between 25.11 and 23.57. The volume here is even more striking relative to the price: 20.75 million KORU contracts traded, worth 504 million USDT.
These are not small numbers. SOXL has led the ETF perpetual market with 41.97 billion dollars in cumulative volume, followed by KORU at 16.15 billion. But the more revealing statistic is this: KORU's perpetual contract traded at 148% of the volume of its underlying ETF. More money is changing hands in the crypto derivative than in the actual ETF it is based on.
The Price Structure
$SOXL has been in a clear recovery. The 24-hour low of 118.40 shows where buyers stepped in. The resistance at 127.62 is the immediate hurdle. A break above that level could open the path toward 128.99 and potentially 130.51. But what concerns me is the gap between the futures price and the spot price. SOXL stock is at 127.083, while the perpetual is at 127.11, a premium of just 0.03 dollars.
$KORU shows a similar pattern. The stock trades at 25.105, while the perpetual is at 25.06, a slight discount. This suggests that futures traders are not aggressively bidding up these contracts. The enthusiasm is there, but it is measured.
The Bigger Picture
The ETF perpetual market has grown at an average rate of 170% month-over-month. Binance now commands 74% of this market. These contracts now represent roughly 30% of Binance's total TradFi perpetual activity.
But there is a tension. Retail investors have been selling individual semiconductor stocks like Nvidia and Micron while simultaneously buying leveraged ETFs like SOXL. They are taking profits on individual names but maintaining exposure to the sector through leveraged products. That is a positioning choice that carries hidden risks.
SOXL's realized volatility can exceed 90%. The fund resets daily, meaning a chop pattern of up 10% then down 10% leaves the underlying flat but the 3x fund down. This volatility decay erodes returns even when the underlying index eventually recovers.
What I Would Watch
For SOXL, the 118.40 low is the key support. If price holds above this level and breaks 127.62, the bullish structure remains intact. The next targets would be 128.99 and 130.51. But if SOXL loses 118.40, the correction could accelerate toward 110.53.
For KORU, the support at 23.57 is critical. The resistance at 25.11 is the immediate barrier. A break above that could target 25.77. The 24-hour volume of 20.75 million contracts suggests there is real interest, but much of it may be speculative.
My Take
I am watching this market, but I am not chasing it. The volume is impressive, but the positioning is becoming crowded. KORU's perpetual trading at 148% of its underlying ETF's volume is a warning sign. It suggests that leverage is driving the price action more than genuine demand.
The part I would be careful with is the volatility decay. These are 3x leveraged products designed for daily trading, not long-term holds. Holding them through a choppy market can erode value even if the underlying index moves in your favor.
I would rather wait for a pullback to support levels before considering entries. The liquidity is there, but the risk is real.
One Question
With KORU's perpetual contract now trading at 148% of its underlying ETF's volume, do you see this as a sign of growing institutional interest in crypto-based TradFi exposure, or a speculative retail frenzy that could unwind violently?
Educational only. Not financial advice. Manage risk.
#ETFPerpetuals #LeveragedETFs #KORU #BinanceFutures #SOXLUSDT
1
249
·
--
Verified
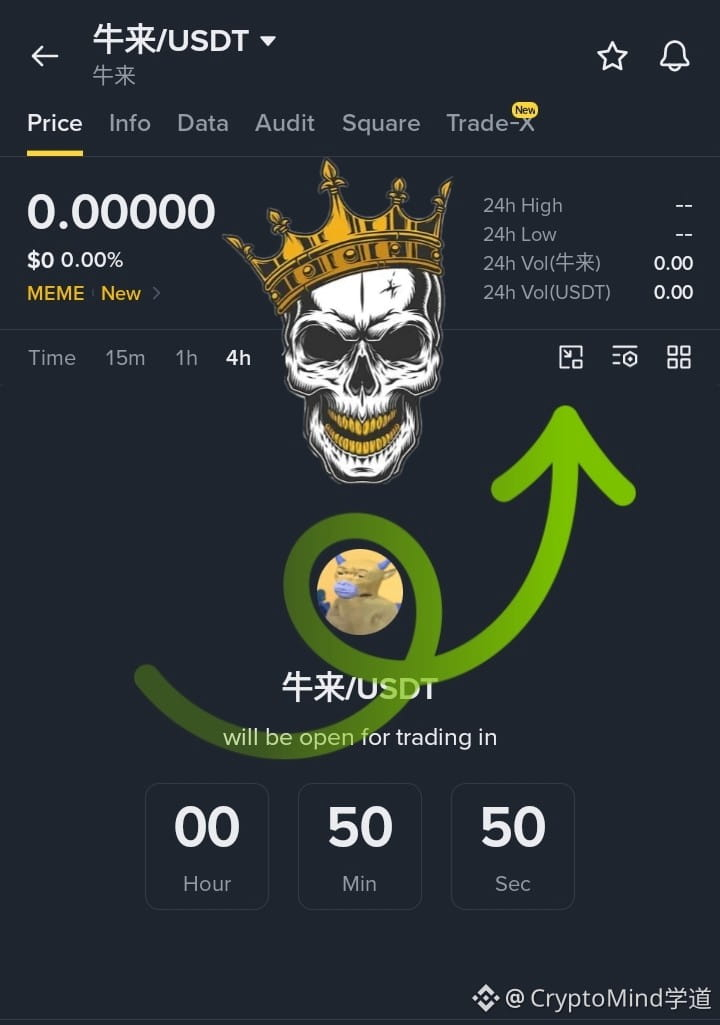
Binance just listed $牛来 a $BNB Chain meme coin, for spot trading at 14:30 UTC today. 👀
The token surged over 40 percent shortly after the announcement, hitting a $147 million peak before pulling back.
Trading pairs include 牛来/USDT, 牛来/USDC, and 牛来/TRY.
Binance applied a Seed Tag to $牛来 meaning higher volatility and risk — users must pass a risk quiz every 90 days before trading.
The token moved through Binance Alpha (August 18) → Futures (August 30, 10x leverage) → Spot (today) — a rare full-stack listing for a Chinese meme coin.
Are you trading the listing momentum or waiting on the sidelines?
{spot}(牛来USDT)
Binance just listed $牛来 a $BNB Chain meme coin, for spot trading at 14:30 UTC today. 👀
The token surged over 40 percent shortly after the announcement, hitting a $147 million peak before pulling back.
Trading pairs include 牛来/USDT, 牛来/USDC, and 牛来/TRY.
Binance applied a Seed Tag to $牛来 meaning higher volatility and risk — users must pass a risk quiz every 90 days before trading.
The token moved through Binance Alpha (August 18) → Futures (August 30, 10x leverage) → Spot (today) — a rare full-stack listing for a Chinese meme coin.
Are you trading the listing momentum or waiting on the sidelines?
The token surged over 40 percent shortly after the announcement, hitting a $147 million peak before pulling back.
Trading pairs include 牛来/USDT, 牛来/USDC, and 牛来/TRY.
Binance applied a Seed Tag to $牛来 meaning higher volatility and risk — users must pass a risk quiz every 90 days before trading.
The token moved through Binance Alpha (August 18) → Futures (August 30, 10x leverage) → Spot (today) — a rare full-stack listing for a Chinese meme coin.
Are you trading the listing momentum or waiting on the sidelines?
1
388
·
--
Bullish
Two charts, two very different risk profiles. 🥵
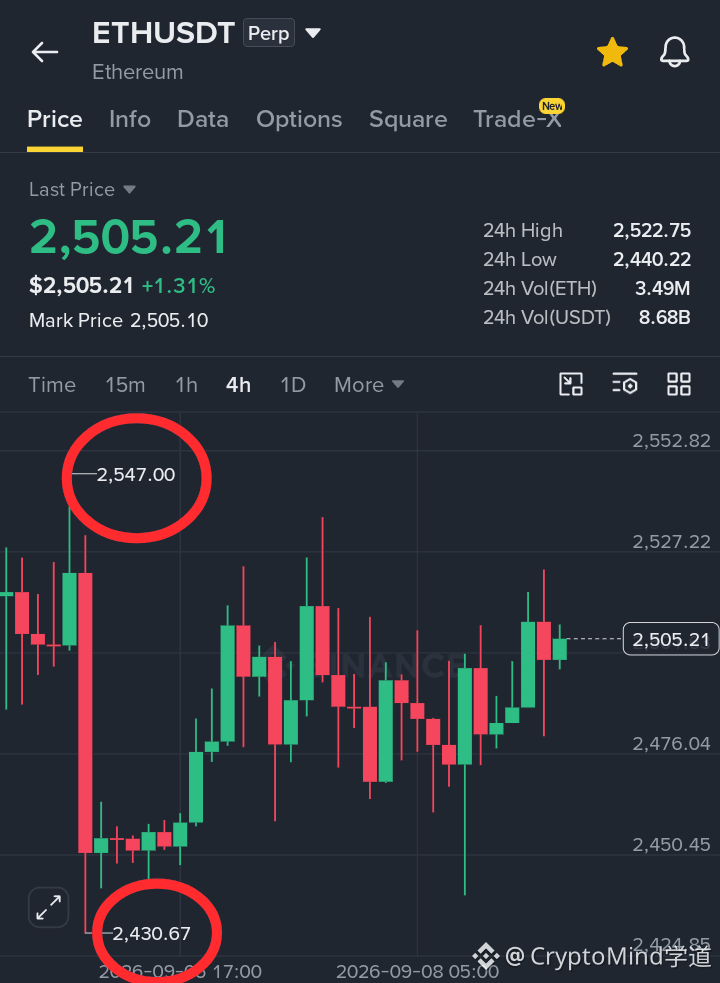
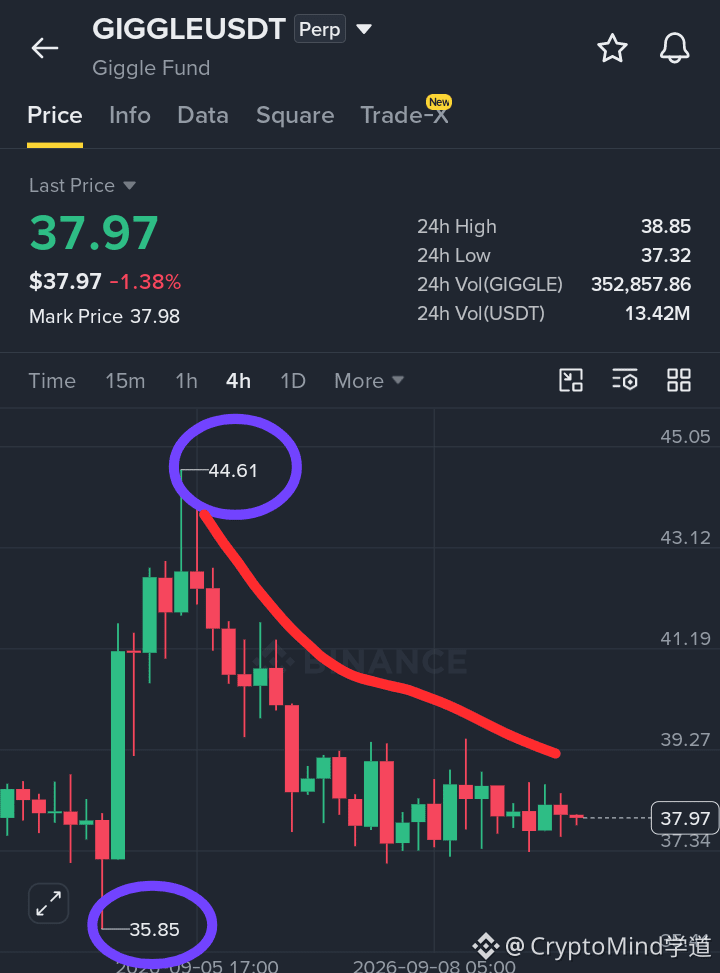
$GIGGLE is a BSC meme coin that surged 60% in early August after CZ's comments on donations, but it's now fading from its $45 peak. $ETH is consolidating in a tight range between $2,380 and $2,530, holding above key moving averages.
BEST SETUP: ETHUSDT 🟢
BIAS: LONG on range support
⏩ ENTRY: $2,440 – $2,490
🛑 STOP LOSS: $2,380
🎯 TP1: $2,530
🎯 TP2: $2,650
{future}(ETHUSDT)
ETH offers a clean range with defined levels—support at $2,440, resistance at $2,530. A break above $2,530 opens the door to $2,650. GIGGLE is broken below its recent highs at $44.61 and lacks a clear catalyst to reverse—avoid chasing the downside.
Risk: A break below $2,380 invalidates the bullish setup and could trigger long liquidations.
Trade here 👇🏻
{future}(GIGGLEUSDT)
Are you buying the range or waiting for a breakout?
Two charts, two very different risk profiles. 🥵
$GIGGLE is a BSC meme coin that surged 60% in early August after CZ's comments on donations, but it's now fading from its $45 peak. $ETH is consolidating in a tight range between $2,380 and $2,530, holding above key moving averages.
BEST SETUP: ETHUSDT 🟢
BIAS: LONG on range support
⏩ ENTRY: $2,440 – $2,490
🛑 STOP LOSS: $2,380
🎯 TP1: $2,530
🎯 TP2: $2,650
ETH offers a clean range with defined levels—support at $2,440, resistance at $2,530. A break above $2,530 opens the door to $2,650. GIGGLE is broken below its recent highs at $44.61 and lacks a clear catalyst to reverse—avoid chasing the downside.
Risk: A break below $2,380 invalidates the bullish setup and could trigger long liquidations.
Trade here 👇🏻
Are you buying the range or waiting for a breakout?
$GIGGLE is a BSC meme coin that surged 60% in early August after CZ's comments on donations, but it's now fading from its $45 peak. $ETH is consolidating in a tight range between $2,380 and $2,530, holding above key moving averages.
BEST SETUP: ETHUSDT 🟢
BIAS: LONG on range support
⏩ ENTRY: $2,440 – $2,490
🛑 STOP LOSS: $2,380
🎯 TP1: $2,530
🎯 TP2: $2,650
ETH offers a clean range with defined levels—support at $2,440, resistance at $2,530. A break above $2,530 opens the door to $2,650. GIGGLE is broken below its recent highs at $44.61 and lacks a clear catalyst to reverse—avoid chasing the downside.
Risk: A break below $2,380 invalidates the bullish setup and could trigger long liquidations.
Trade here 👇🏻
Are you buying the range or waiting for a breakout?
1
208
·
--
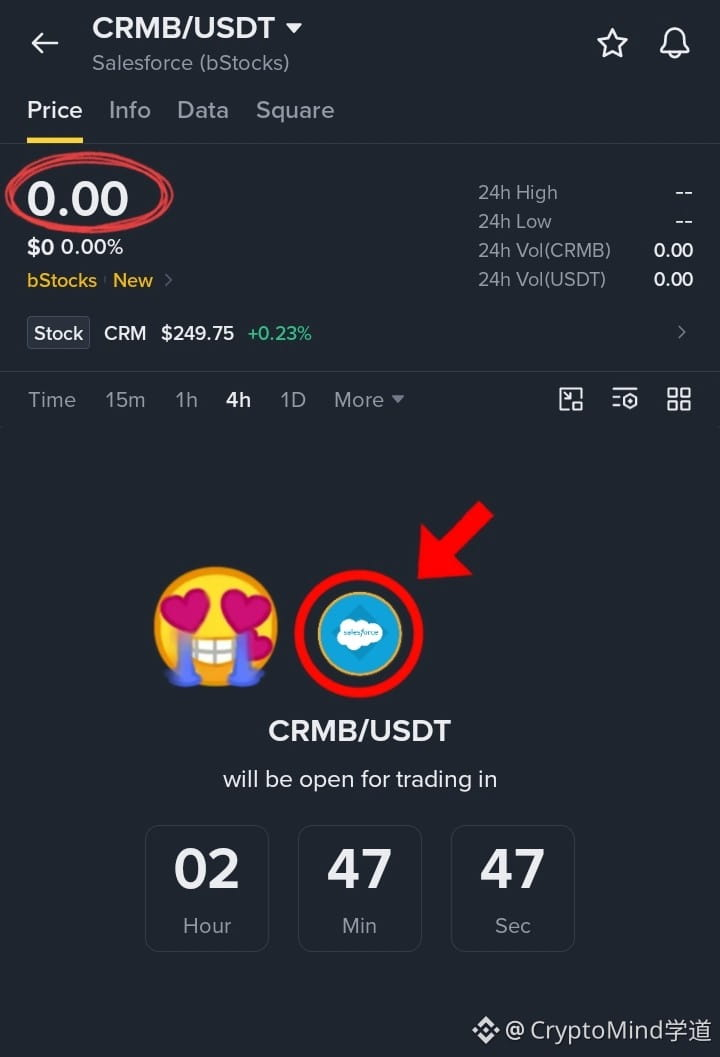
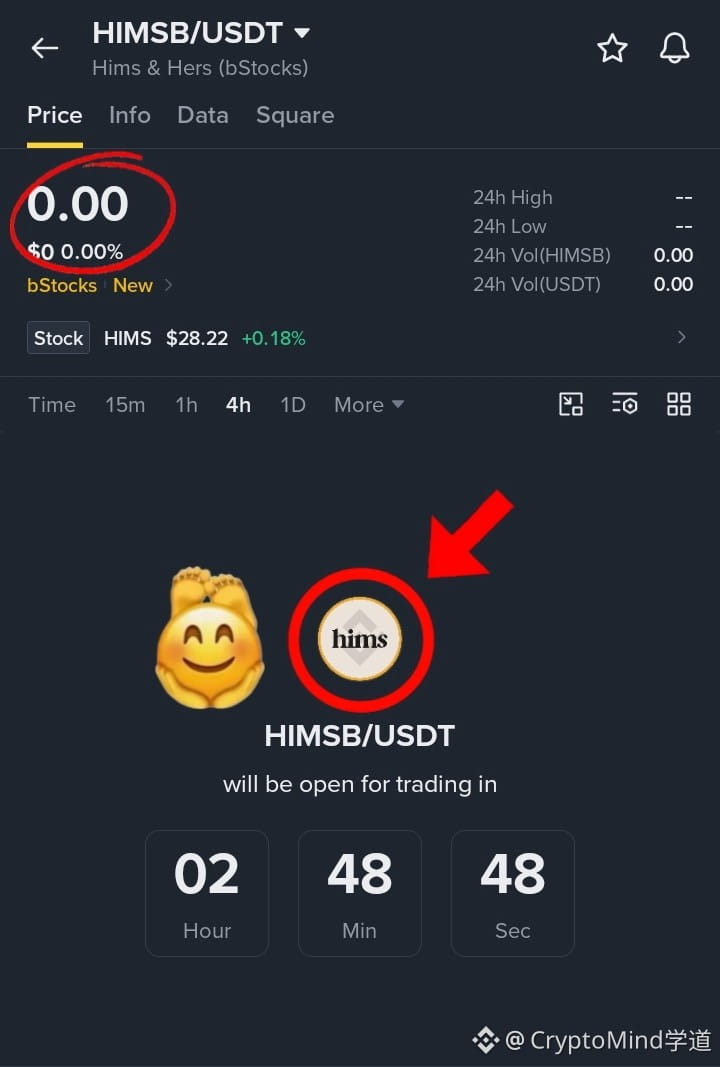
Binance just listed two new bStocks 🙃
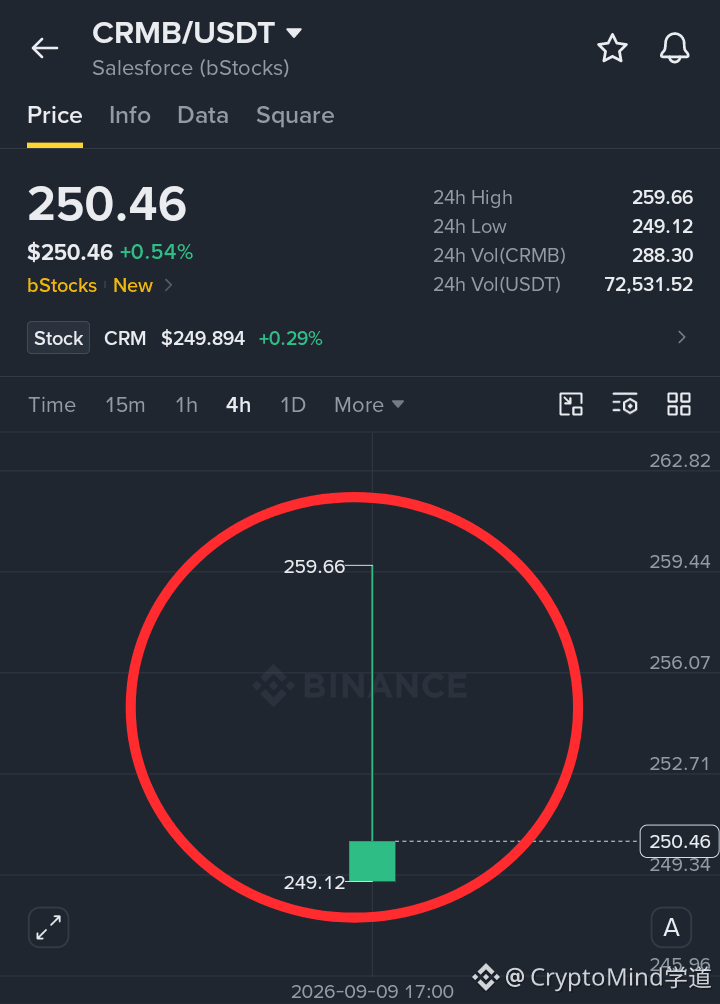
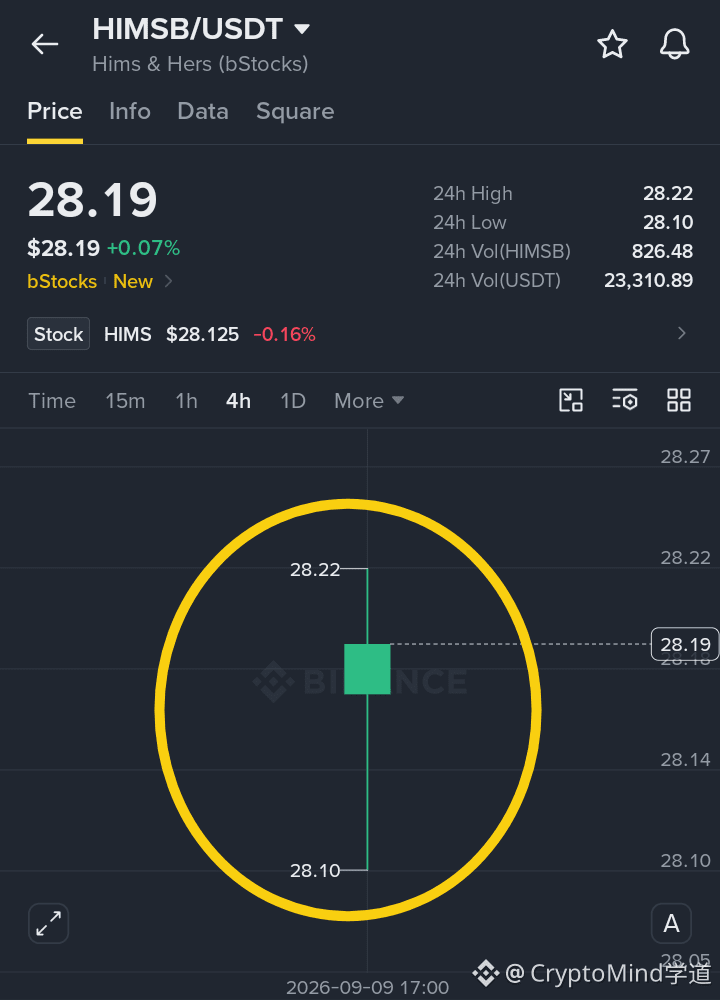
Salesforce ($CRMB ) is at 250.46, up 0.54% today. The 24h range is 249.12 to 259.66. Hims & Hers ($HIMSB ) is at 28.19, up just 0.07%, with a tight range of 28.10 to 28.22. Spot trading opened at 20:00 UTC+8 today, and zero maker fees apply until September 30.
Salesforce has had a strong run, up 34% over the past month. But it has pulled back from its recent high of 264.43. Hims & Hers, on the other hand, has been more stable recently.
The bStocks program lets you trade tokenized stocks on Binance with a 1:1 conversion rate. But remember, these are not actual shares — they are tokenized securities.
Which one are you watching more closely?
{spot}(CRMBUSDT)
{spot}(HIMSBUSDT)
Educational only. Not financial advice. DYOR.
Binance just listed two new bStocks 🙃
Salesforce ($CRMB ) is at 250.46, up 0.54% today. The 24h range is 249.12 to 259.66. Hims & Hers ($HIMSB ) is at 28.19, up just 0.07%, with a tight range of 28.10 to 28.22. Spot trading opened at 20:00 UTC+8 today, and zero maker fees apply until September 30.
Salesforce has had a strong run, up 34% over the past month. But it has pulled back from its recent high of 264.43. Hims & Hers, on the other hand, has been more stable recently.
The bStocks program lets you trade tokenized stocks on Binance with a 1:1 conversion rate. But remember, these are not actual shares — they are tokenized securities.
Which one are you watching more closely?
Educational only. Not financial advice. DYOR.
Salesforce ($CRMB ) is at 250.46, up 0.54% today. The 24h range is 249.12 to 259.66. Hims & Hers ($HIMSB ) is at 28.19, up just 0.07%, with a tight range of 28.10 to 28.22. Spot trading opened at 20:00 UTC+8 today, and zero maker fees apply until September 30.
Salesforce has had a strong run, up 34% over the past month. But it has pulled back from its recent high of 264.43. Hims & Hers, on the other hand, has been more stable recently.
The bStocks program lets you trade tokenized stocks on Binance with a 1:1 conversion rate. But remember, these are not actual shares — they are tokenized securities.
Which one are you watching more closely?
Educational only. Not financial advice. DYOR.
1
160
·
--
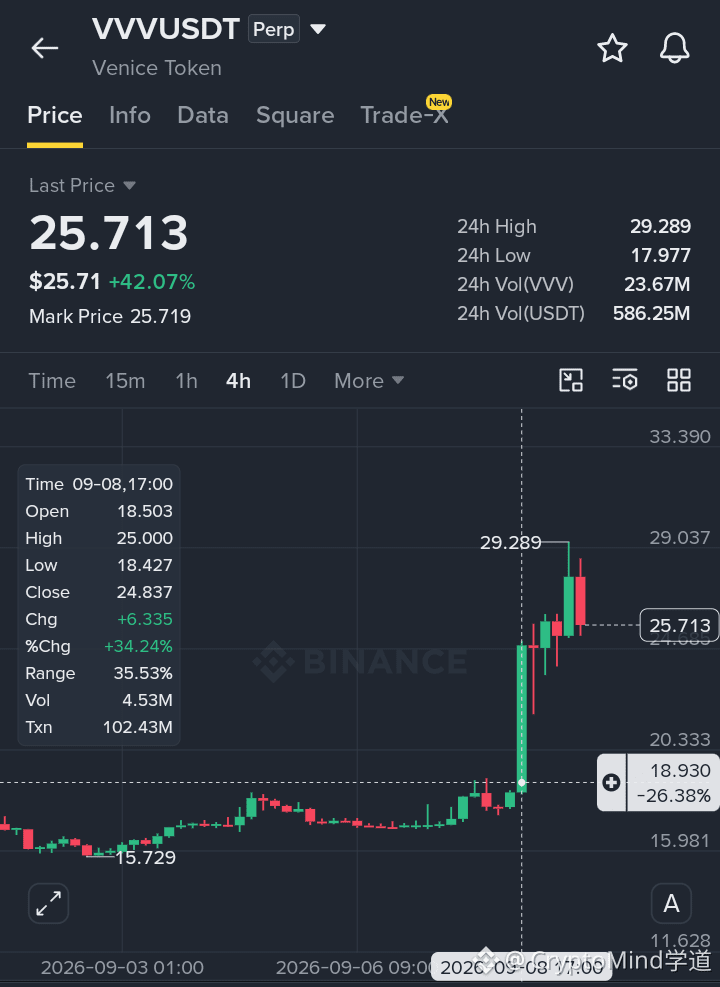
Venice Token just posted its biggest daily green candle ever — but the pullback is already here.
Taking a short trade on $VVV
📍 Entry: 25.20 to 25.80
🎯 TP1: 23.00
🎯 TP2: 20.33
🎯 TP3: 18.43
🛑 Stop Loss: 27.00
Potential reward-to-risk: approximately 1.2R / 2.5R / 3.8R across the targets.
Why this setup stands out
$VVV surged 42% in 24 hours after its launch on September 3, hitting a high of 25.7. The token is now rejecting the 25.00 resistance zone, and the 4H structure is showing a clear bearish divergence — price made a higher high, but RSI made a lower high. The $ATH remains at 33.39, but the current move is overextended, and profit-taking is already visible. Venice Token is a privacy-focused AI platform, but the rally was driven by hype, not fundamentals.
Position Management
Use 3x–5x leverage for this short setup. The rejection at 25.7 is clear, and the downside has room to run toward the first support at 23.00. Liquidity is good, so slippage is minimal.
Risk
A break above 27.00 would invalidate this setup and suggest continuation to the upside.
Is this the start of a correction, or just a pause before another leg up?
Educational only. Not financial advice. DYOR.
Trade here 👇🏻
{future}(VVVUSDT)
Venice Token just posted its biggest daily green candle ever — but the pullback is already here.
Taking a short trade on $VVV
📍 Entry: 25.20 to 25.80
🎯 TP1: 23.00
🎯 TP2: 20.33
🎯 TP3: 18.43
🛑 Stop Loss: 27.00
Potential reward-to-risk: approximately 1.2R / 2.5R / 3.8R across the targets.
Why this setup stands out
$VVV surged 42% in 24 hours after its launch on September 3, hitting a high of 25.7. The token is now rejecting the 25.00 resistance zone, and the 4H structure is showing a clear bearish divergence — price made a higher high, but RSI made a lower high. The $ATH remains at 33.39, but the current move is overextended, and profit-taking is already visible. Venice Token is a privacy-focused AI platform, but the rally was driven by hype, not fundamentals.
Position Management
Use 3x–5x leverage for this short setup. The rejection at 25.7 is clear, and the downside has room to run toward the first support at 23.00. Liquidity is good, so slippage is minimal.
Risk
A break above 27.00 would invalidate this setup and suggest continuation to the upside.
Is this the start of a correction, or just a pause before another leg up?
Educational only. Not financial advice. DYOR.
Trade here 👇🏻
Taking a short trade on $VVV
📍 Entry: 25.20 to 25.80
🎯 TP1: 23.00
🎯 TP2: 20.33
🎯 TP3: 18.43
🛑 Stop Loss: 27.00
Potential reward-to-risk: approximately 1.2R / 2.5R / 3.8R across the targets.
Why this setup stands out
$VVV surged 42% in 24 hours after its launch on September 3, hitting a high of 25.7. The token is now rejecting the 25.00 resistance zone, and the 4H structure is showing a clear bearish divergence — price made a higher high, but RSI made a lower high. The $ATH remains at 33.39, but the current move is overextended, and profit-taking is already visible. Venice Token is a privacy-focused AI platform, but the rally was driven by hype, not fundamentals.
Position Management
Use 3x–5x leverage for this short setup. The rejection at 25.7 is clear, and the downside has room to run toward the first support at 23.00. Liquidity is good, so slippage is minimal.
Risk
A break above 27.00 would invalidate this setup and suggest continuation to the upside.
Is this the start of a correction, or just a pause before another leg up?
Educational only. Not financial advice. DYOR.
Trade here 👇🏻
1
70
·
--
Verified
Binance just listed bStocks for Salesforce $CRMB and Hims & Hers $HIMSB but HIMSB's debut comes with a massive legal overhang.
Novo Nordisk filed a lawsuit against Hims & Hers over its compounded weight-loss drugs, sending HIMS stock down 16%.
The tokenized securities still track the underlying stock 1:1, meaning any further legal developments could hit $HIMSB hard.
Will you trade this dip or stay away until the lawsuit clears up?
{spot}(CRMBUSDT)
{spot}(HIMSBUSDT)
Binance just listed bStocks for Salesforce $CRMB and Hims & Hers $HIMSB but HIMSB's debut comes with a massive legal overhang.
Novo Nordisk filed a lawsuit against Hims & Hers over its compounded weight-loss drugs, sending HIMS stock down 16%.
The tokenized securities still track the underlying stock 1:1, meaning any further legal developments could hit $HIMSB hard.
Will you trade this dip or stay away until the lawsuit clears up?
Novo Nordisk filed a lawsuit against Hims & Hers over its compounded weight-loss drugs, sending HIMS stock down 16%.
The tokenized securities still track the underlying stock 1:1, meaning any further legal developments could hit $HIMSB hard.
Will you trade this dip or stay away until the lawsuit clears up?
1
381
·
--
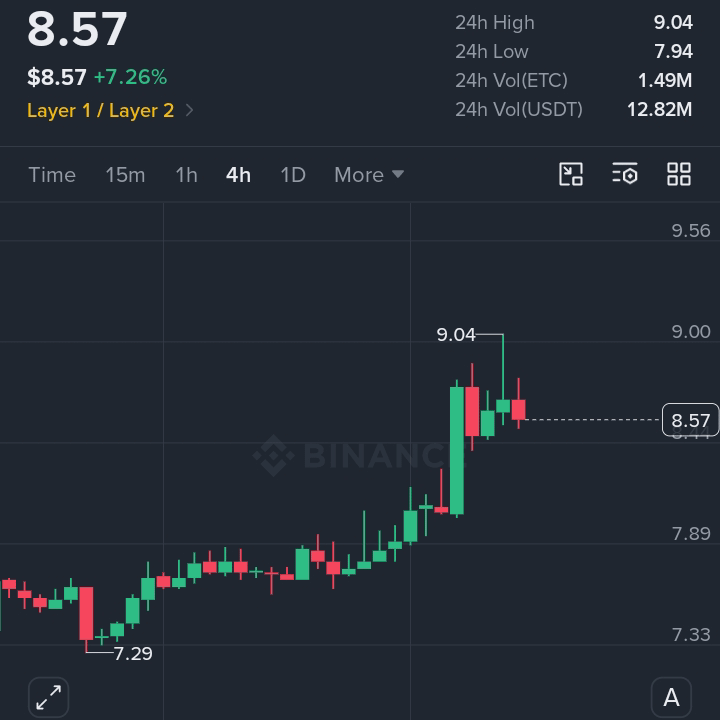
$ETC swept 7.94 and came straight back.
9.04 decides everything from here. 😱
I’m in only on acceptance above it.
Entry: 9.05 – 9.20
TP1: 9.80
TP2: 10.40
TP3: 11.20
Offload some at TP1.
Close the rest into TP2–TP3.
Full exit if momentum dies after the break.
4H close under 8.25 and the trade is done.
No break, no trade.
{spot}(ETCUSDT)
Not financial advice. Always DYOR.
$ETC swept 7.94 and came straight back.
9.04 decides everything from here. 😱
I’m in only on acceptance above it.
Entry: 9.05 – 9.20
TP1: 9.80
TP2: 10.40
TP3: 11.20
Offload some at TP1.
Close the rest into TP2–TP3.
Full exit if momentum dies after the break.
4H close under 8.25 and the trade is done.
No break, no trade.
Not financial advice. Always DYOR.
9.04 decides everything from here. 😱
I’m in only on acceptance above it.
Entry: 9.05 – 9.20
TP1: 9.80
TP2: 10.40
TP3: 11.20
Offload some at TP1.
Close the rest into TP2–TP3.
Full exit if momentum dies after the break.
4H close under 8.25 and the trade is done.
No break, no trade.
Not financial advice. Always DYOR.
1
49
·
--
Bullish
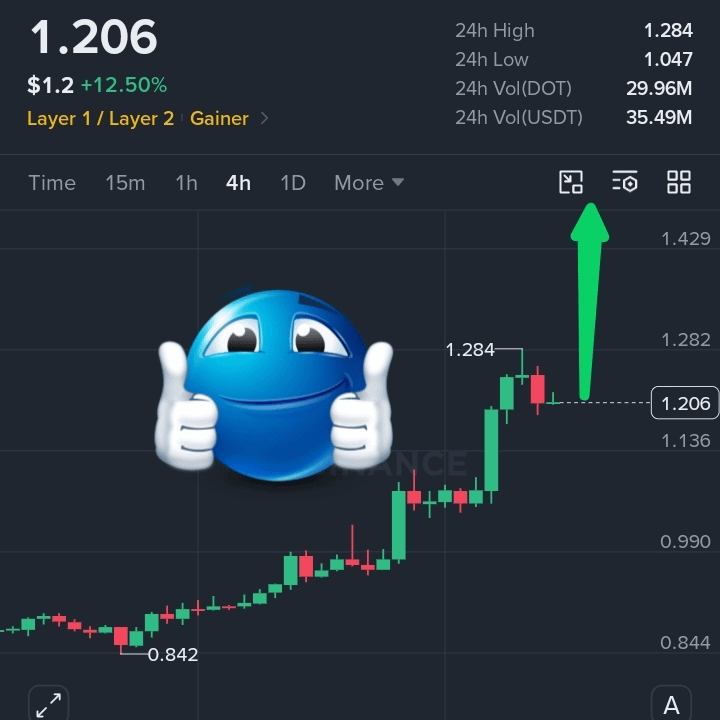
$DOT broke $1 and governance just forced the market to react
👀 Watching for buy setup
🐂 Entry: 1.05 – 1.10
🎯 TP1: 1.28
🎯 TP2: 1.42
🎯 TP3: 1.60
{spot}(DOTUSDT)
The play ▶️
OpenGov locked in dotUSD with 97.5% approval. About $610K in shorts got squeezed as price pushed to 1.26 on heavy volume. $1 has flipped to support. Structure stays valid above that level — a daily close back under $1 weakens the whole move.
Momentum or pullback to $1 — which side are you on?
Educational only. Not financial advice. DYOR.
$DOT broke $1 and governance just forced the market to react
👀 Watching for buy setup
🐂 Entry: 1.05 – 1.10
🎯 TP1: 1.28
🎯 TP2: 1.42
🎯 TP3: 1.60
The play ▶️
OpenGov locked in dotUSD with 97.5% approval. About $610K in shorts got squeezed as price pushed to 1.26 on heavy volume. $1 has flipped to support. Structure stays valid above that level — a daily close back under $1 weakens the whole move.
Momentum or pullback to $1 — which side are you on?
Educational only. Not financial advice. DYOR.
👀 Watching for buy setup
🐂 Entry: 1.05 – 1.10
🎯 TP1: 1.28
🎯 TP2: 1.42
🎯 TP3: 1.60
The play ▶️
OpenGov locked in dotUSD with 97.5% approval. About $610K in shorts got squeezed as price pushed to 1.26 on heavy volume. $1 has flipped to support. Structure stays valid above that level — a daily close back under $1 weakens the whole move.
Momentum or pullback to $1 — which side are you on?
Educational only. Not financial advice. DYOR.
1
74
·
--
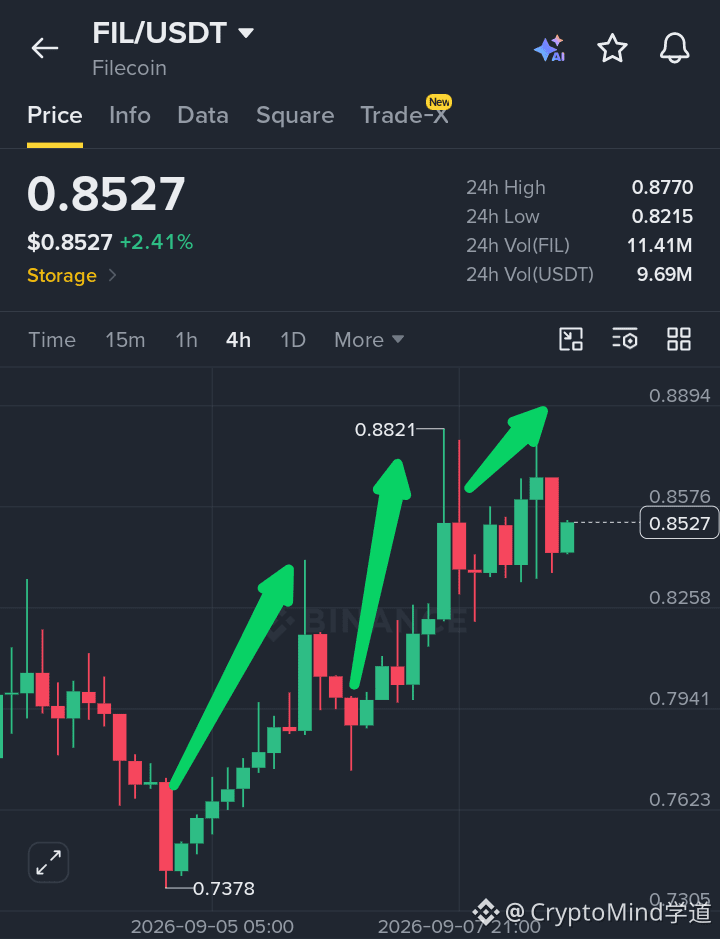
Good morning fan, Filecoin is squeezing bears out of their positions as the narrative around AI infrastructure spending heats up—short liquidations hit $1.5M.
SPOT SETUP: $FIL
Entry: 0.8250 – 0.8500
TP1: 0.9000
TP2: 0.9500
TP3: 1.0000
{spot}(FILUSDT)
$FIL broke out of a multi-month descending channel, reclaimed the 200-day SMA near $0.704, and is now testing resistance around $0.86. Volume surged 338%, with open interest climbing to $211M—fresh capital entering positions. The AI storage narrative is gaining traction as Filecoin positions itself as a cost-effective alternative to traditional cloud infrastructure facing massive hardware cost inflation. On October 15, Protocol Labs and Filecoin Foundation vesting ends, cutting new FIL supply by ~75%—from 88M to 22M tokens annually. A daily close above $0.8644 could open the door toward $0.995 and $1.094.
Risk: A sustained break below $0.8000 would weaken the bullish structure.
With the AI narrative gaining momentum and a major supply shock just weeks away—are you positioning ahead of the October vesting cliff, or waiting for a confirmed breakout above $0.86?
Not financial advice. DYOR.
Good morning fan, Filecoin is squeezing bears out of their positions as the narrative around AI infrastructure spending heats up—short liquidations hit $1.5M.
SPOT SETUP: $FIL
Entry: 0.8250 – 0.8500
TP1: 0.9000
TP2: 0.9500
TP3: 1.0000
$FIL broke out of a multi-month descending channel, reclaimed the 200-day SMA near $0.704, and is now testing resistance around $0.86. Volume surged 338%, with open interest climbing to $211M—fresh capital entering positions. The AI storage narrative is gaining traction as Filecoin positions itself as a cost-effective alternative to traditional cloud infrastructure facing massive hardware cost inflation. On October 15, Protocol Labs and Filecoin Foundation vesting ends, cutting new FIL supply by ~75%—from 88M to 22M tokens annually. A daily close above $0.8644 could open the door toward $0.995 and $1.094.
Risk: A sustained break below $0.8000 would weaken the bullish structure.
With the AI narrative gaining momentum and a major supply shock just weeks away—are you positioning ahead of the October vesting cliff, or waiting for a confirmed breakout above $0.86?
Not financial advice. DYOR.
SPOT SETUP: $FIL
Entry: 0.8250 – 0.8500
TP1: 0.9000
TP2: 0.9500
TP3: 1.0000
$FIL broke out of a multi-month descending channel, reclaimed the 200-day SMA near $0.704, and is now testing resistance around $0.86. Volume surged 338%, with open interest climbing to $211M—fresh capital entering positions. The AI storage narrative is gaining traction as Filecoin positions itself as a cost-effective alternative to traditional cloud infrastructure facing massive hardware cost inflation. On October 15, Protocol Labs and Filecoin Foundation vesting ends, cutting new FIL supply by ~75%—from 88M to 22M tokens annually. A daily close above $0.8644 could open the door toward $0.995 and $1.094.
Risk: A sustained break below $0.8000 would weaken the bullish structure.
With the AI narrative gaining momentum and a major supply shock just weeks away—are you positioning ahead of the October vesting cliff, or waiting for a confirmed breakout above $0.86?
Not financial advice. DYOR.

1
229
·
--
Article
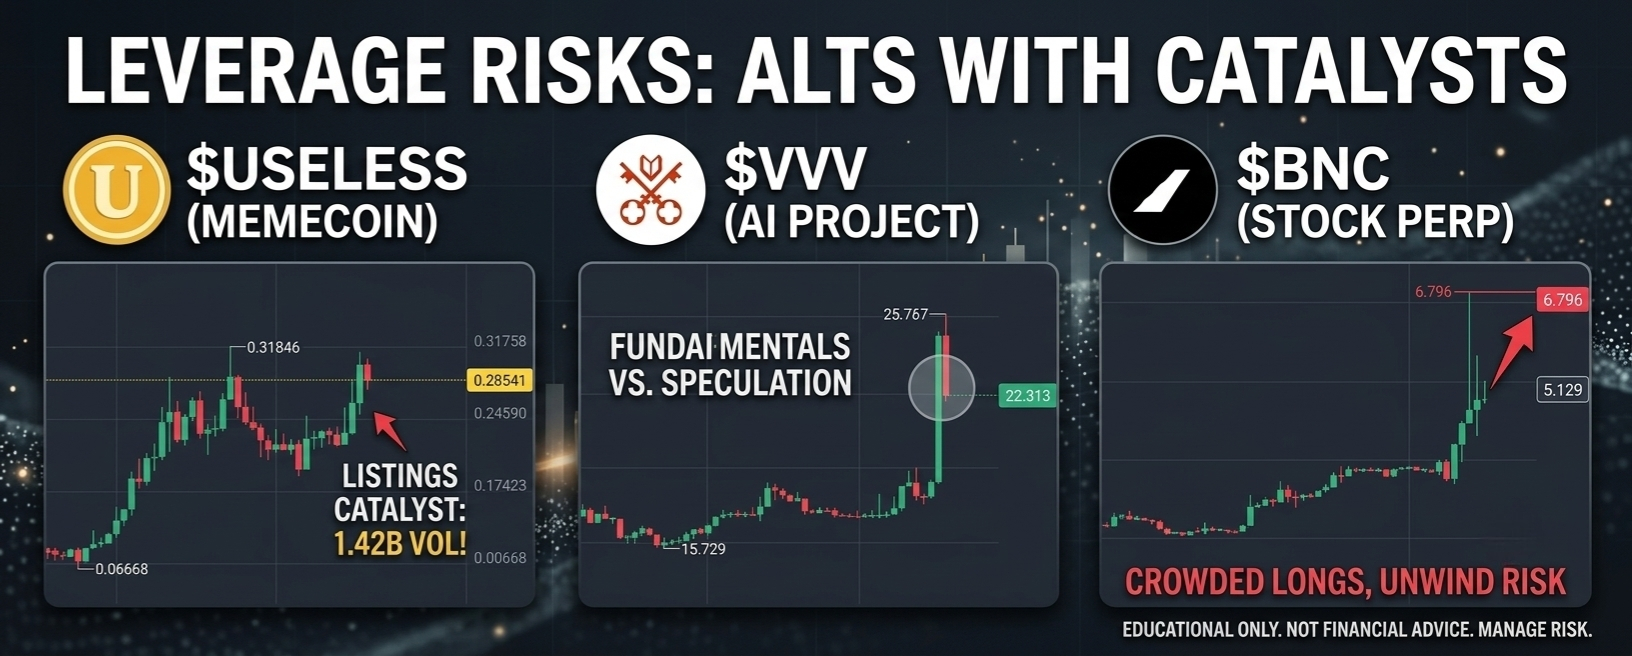
Three Coins, One Warning: When Listings and Leverage CollideThe altcoin market is sending a message, and it is not subtle. Over the past several days, three very different tokens have produced nearly identical price fireworks. USELESS, a memecoin that openly admits it has no utility, surged over 28% in 24 hours. VVV, an AI project with real revenue, climbed over 26%. And BNC, a token tied to a US stock, jumped over 28% as well.
On the surface, these look like three separate wins. But when you step back, a single pattern emerges: capital is rotating aggressively into anything with a catalyst, and derivatives are amplifying the move. The question is not whether these rallies are real. It is whether the leverage behind them is sustainable.
What Connects These Three
Each asset has its own story. USELESS, a Solana-based memecoin, has been riding a wave of exchange listings. It surged after Bithumb announced a listing and again after Upbit followed suit. The token has now become one of the most talked-about names in crypto, with 24-hour volume reaching 1.42 billion USELESS tokens.
VVV, or Venice Token, operates in the AI sector. Venice AI recently crossed 100 million dollars in annualized revenue and surpassed 4 million users. The team has also been aggressively burning tokens and reducing issuance. This is a fundamentally driven rally, at least by crypto standards.
BNC is the most unusual of the three. It is tied to CEA Industries Inc., a US stock, and trades as a perpetual contract on Binance. At the time of the screenshot, BNCUSDT was trading at 5.129 USDT, up over 28% with 24-hour volume of 314 million USDT. The funding rate on BNC has been so elevated that exchanges have had to adjust their caps.
Three different assets. Three different narratives. But one common thread: futures are driving the price action.
Where the Real Risk Lives
The most telling data point across all three charts is the volume. USELESS recorded 1.42 billion tokens traded in 24 hours. VVV saw 9.38 million tokens traded. BNC moved 58.93 million tokens. These are not normal volume levels for these assets. This is speculative flow, pure and simple.
Now consider the broader market context. Bitcoin recently went through its sharpest deleveraging since 2023. Binance Bitcoin futures open interest briefly dropped below its 180-day moving average. That was a reset. Leverage was flushed out of the system.
But traders are already piling back in. And this time, they are targeting altcoins. Altcoin leverage has overtaken Bitcoin's for the first time since 2024. The market cap of altcoins outside the top 10 has climbed above 200 billion dollars, up more than 10% since the start of September.
This matters because leverage amplifies moves in both directions. When capital rotates into altcoins and the market turns, the unwind can be vicious. The three coins in today's analysis are not just moving together. They are moving on borrowed fuel.
$USELESS : The Memecoin That Is Not Joking
USELESS has been on an extraordinary run. From a low of 0.0668 on August 31, it climbed to a high of 0.316 on September 5, a gain of over 370%. The chart shows a recent pullback to 0.28541, with a 24-hour high of 0.31340 and a low of 0.21871.
The key level to watch is the resistance zone between 0.262 and 0.278. Price broke above this zone but has since retraced. If USELESS can hold above 0.285 and reclaim 0.313, the next leg higher could target 0.389. But if it loses 0.262, the structure changes.
The volume is the story here. 1.42 billion USELESS tokens traded in 24 hours is massive for a memecoin of this size. This is not organic accumulation. This is momentum trading at scale.
$VVV : Real Revenue, Real Questions
VVV is trading at 22.313 USDT, up over 26% with a 24-hour high of 25.767 and a low of 17.523. The token has been one of 2026's standout performers, climbing roughly 87% in a single month and close to 180% over three months.
The fundamental case is compelling. Venice AI has real users and real revenue. The buyback and burn mechanism is aggressive. The token supply reduction is meaningful. But here is the tension: even with all this positive news, VVV is still trading below its all-time high near 22.58. The AI trade has cooled, and the current rally may be more about speculative rotation than renewed conviction.
If VVV breaks above 25.767 with volume, the path to new highs is clear. But a rejection there could send it back toward the 19.118 support level.
$BNC : The Stock-Token Arbitrage
BNC is the most structurally interesting of the three. It is not a crypto project in the traditional sense. It is a perpetual contract tied to a US stock. The pre-market price of CEA Industries was 6.24 dollars at the time of the screenshot, while BNCUSDT traded at 5.129 USDT. That is a meaningful discount.
The funding rate on BNC has been a problem. It hit the 2% annualized cap, and exchanges have had to adjust their funding rate limits. This tells you that long positioning is extremely crowded. When a funding rate hits its cap, it means the market is overwhelmingly one-sided.
BNC broke above 5.129 and is now approaching 6.796. The 24-hour range is wide: from 3.668 to 6.796. That kind of volatility is dangerous for leveraged positions. If BNC continues higher, the shorts will get squeezed. But if it reverses, the longs will face a brutal unwind.
The Most Important Contradiction
Here is what stands out to me. Price is strong across all three assets. Volume is high. Catalysts are real. But the broader market is not uniformly bullish. Bitcoin dominance has opened September lower after being rejected at the important 60% level. And the taker buy-sell volume ratio in crypto futures is leaning short, with bearish bets accounting for 51.6% of the flow.
So we have a situation where altcoins are rallying hard while the broader futures market is leaning bearish. That is a contradiction. It suggests that the current altcoin rally may be more isolated and more speculative than it appears.
The other contradiction is the funding data. Altcoin leverage has overtaken Bitcoin's, but funding rates on many assets are still negative or neutral. That means traders are not paying a premium to be long. They are simply accumulating leveraged positions without conviction. That is a fragile setup.
What I Would Watch
For USELESS, watch the 0.285 level. If price holds above it and breaks 0.313, the bullish structure remains intact. If it loses 0.285 and drops below 0.262, the rally is over.
{future}(USELESSUSDT)
For VVV, the key is 25.767. A break above that with volume could trigger a squeeze toward the all-time high. A rejection would likely send it back to 19.118.
{future}(VVVUSDT)
For BNC, the funding rate is the signal. If it stays elevated, longs are crowded. A liquidation cascade could send BNC back toward 3.668. But if the funding rate normalizes and price holds above 5.129, the path to 6.796 remains open.
{future}(BNCUSDT)
My Take
I am watching this rotation closely, but I am not chasing it. The setup is interesting, but the risk is asymmetric. These assets have moved too far, too fast, on leverage that is becoming crowded. The catalysts are real, but the positioning is dangerous.
The part I would be careful with is the funding rate on BNC and the volume on USELESS. Those are the two most extreme data points. If they normalize, the rally could continue. If they accelerate, the unwind could be violent.
I would rather wait for a pullback to key support levels before considering entries. The liquidity is there, but so is the risk.
One Question
Given the elevated funding rates and crowded long positioning across these assets, do you see the current rally as the beginning of a sustained altcoin season or a short-term leverage flush waiting to happen?
Educational only. Not financial advice. Manage risk.
#useless #VVV #BNC #altcoins #FuturesTrading
Three Coins, One Warning: When Listings and Leverage Collide
The altcoin market is sending a message, and it is not subtle. Over the past several days, three very different tokens have produced nearly identical price fireworks. USELESS, a memecoin that openly admits it has no utility, surged over 28% in 24 hours. VVV, an AI project with real revenue, climbed over 26%. And BNC, a token tied to a US stock, jumped over 28% as well.
On the surface, these look like three separate wins. But when you step back, a single pattern emerges: capital is rotating aggressively into anything with a catalyst, and derivatives are amplifying the move. The question is not whether these rallies are real. It is whether the leverage behind them is sustainable.
What Connects These Three
Each asset has its own story. USELESS, a Solana-based memecoin, has been riding a wave of exchange listings. It surged after Bithumb announced a listing and again after Upbit followed suit. The token has now become one of the most talked-about names in crypto, with 24-hour volume reaching 1.42 billion USELESS tokens.
VVV, or Venice Token, operates in the AI sector. Venice AI recently crossed 100 million dollars in annualized revenue and surpassed 4 million users. The team has also been aggressively burning tokens and reducing issuance. This is a fundamentally driven rally, at least by crypto standards.
BNC is the most unusual of the three. It is tied to CEA Industries Inc., a US stock, and trades as a perpetual contract on Binance. At the time of the screenshot, BNCUSDT was trading at 5.129 USDT, up over 28% with 24-hour volume of 314 million USDT. The funding rate on BNC has been so elevated that exchanges have had to adjust their caps.
Three different assets. Three different narratives. But one common thread: futures are driving the price action.
Where the Real Risk Lives
The most telling data point across all three charts is the volume. USELESS recorded 1.42 billion tokens traded in 24 hours. VVV saw 9.38 million tokens traded. BNC moved 58.93 million tokens. These are not normal volume levels for these assets. This is speculative flow, pure and simple.
Now consider the broader market context. Bitcoin recently went through its sharpest deleveraging since 2023. Binance Bitcoin futures open interest briefly dropped below its 180-day moving average. That was a reset. Leverage was flushed out of the system.
But traders are already piling back in. And this time, they are targeting altcoins. Altcoin leverage has overtaken Bitcoin's for the first time since 2024. The market cap of altcoins outside the top 10 has climbed above 200 billion dollars, up more than 10% since the start of September.
This matters because leverage amplifies moves in both directions. When capital rotates into altcoins and the market turns, the unwind can be vicious. The three coins in today's analysis are not just moving together. They are moving on borrowed fuel.
$USELESS : The Memecoin That Is Not Joking
USELESS has been on an extraordinary run. From a low of 0.0668 on August 31, it climbed to a high of 0.316 on September 5, a gain of over 370%. The chart shows a recent pullback to 0.28541, with a 24-hour high of 0.31340 and a low of 0.21871.
The key level to watch is the resistance zone between 0.262 and 0.278. Price broke above this zone but has since retraced. If USELESS can hold above 0.285 and reclaim 0.313, the next leg higher could target 0.389. But if it loses 0.262, the structure changes.
The volume is the story here. 1.42 billion USELESS tokens traded in 24 hours is massive for a memecoin of this size. This is not organic accumulation. This is momentum trading at scale.
$VVV : Real Revenue, Real Questions
VVV is trading at 22.313 USDT, up over 26% with a 24-hour high of 25.767 and a low of 17.523. The token has been one of 2026's standout performers, climbing roughly 87% in a single month and close to 180% over three months.
The fundamental case is compelling. Venice AI has real users and real revenue. The buyback and burn mechanism is aggressive. The token supply reduction is meaningful. But here is the tension: even with all this positive news, VVV is still trading below its all-time high near 22.58. The AI trade has cooled, and the current rally may be more about speculative rotation than renewed conviction.
If VVV breaks above 25.767 with volume, the path to new highs is clear. But a rejection there could send it back toward the 19.118 support level.
$BNC : The Stock-Token Arbitrage
BNC is the most structurally interesting of the three. It is not a crypto project in the traditional sense. It is a perpetual contract tied to a US stock. The pre-market price of CEA Industries was 6.24 dollars at the time of the screenshot, while BNCUSDT traded at 5.129 USDT. That is a meaningful discount.
The funding rate on BNC has been a problem. It hit the 2% annualized cap, and exchanges have had to adjust their funding rate limits. This tells you that long positioning is extremely crowded. When a funding rate hits its cap, it means the market is overwhelmingly one-sided.
BNC broke above 5.129 and is now approaching 6.796. The 24-hour range is wide: from 3.668 to 6.796. That kind of volatility is dangerous for leveraged positions. If BNC continues higher, the shorts will get squeezed. But if it reverses, the longs will face a brutal unwind.
The Most Important Contradiction
Here is what stands out to me. Price is strong across all three assets. Volume is high. Catalysts are real. But the broader market is not uniformly bullish. Bitcoin dominance has opened September lower after being rejected at the important 60% level. And the taker buy-sell volume ratio in crypto futures is leaning short, with bearish bets accounting for 51.6% of the flow.
So we have a situation where altcoins are rallying hard while the broader futures market is leaning bearish. That is a contradiction. It suggests that the current altcoin rally may be more isolated and more speculative than it appears.
The other contradiction is the funding data. Altcoin leverage has overtaken Bitcoin's, but funding rates on many assets are still negative or neutral. That means traders are not paying a premium to be long. They are simply accumulating leveraged positions without conviction. That is a fragile setup.
What I Would Watch
For USELESS, watch the 0.285 level. If price holds above it and breaks 0.313, the bullish structure remains intact. If it loses 0.285 and drops below 0.262, the rally is over.
For VVV, the key is 25.767. A break above that with volume could trigger a squeeze toward the all-time high. A rejection would likely send it back to 19.118.
For BNC, the funding rate is the signal. If it stays elevated, longs are crowded. A liquidation cascade could send BNC back toward 3.668. But if the funding rate normalizes and price holds above 5.129, the path to 6.796 remains open.
My Take
I am watching this rotation closely, but I am not chasing it. The setup is interesting, but the risk is asymmetric. These assets have moved too far, too fast, on leverage that is becoming crowded. The catalysts are real, but the positioning is dangerous.
The part I would be careful with is the funding rate on BNC and the volume on USELESS. Those are the two most extreme data points. If they normalize, the rally could continue. If they accelerate, the unwind could be violent.
I would rather wait for a pullback to key support levels before considering entries. The liquidity is there, but so is the risk.
One Question
Given the elevated funding rates and crowded long positioning across these assets, do you see the current rally as the beginning of a sustained altcoin season or a short-term leverage flush waiting to happen?
Educational only. Not financial advice. Manage risk.
#useless #VVV #BNC #altcoins #FuturesTrading
On the surface, these look like three separate wins. But when you step back, a single pattern emerges: capital is rotating aggressively into anything with a catalyst, and derivatives are amplifying the move. The question is not whether these rallies are real. It is whether the leverage behind them is sustainable.
What Connects These Three
Each asset has its own story. USELESS, a Solana-based memecoin, has been riding a wave of exchange listings. It surged after Bithumb announced a listing and again after Upbit followed suit. The token has now become one of the most talked-about names in crypto, with 24-hour volume reaching 1.42 billion USELESS tokens.
VVV, or Venice Token, operates in the AI sector. Venice AI recently crossed 100 million dollars in annualized revenue and surpassed 4 million users. The team has also been aggressively burning tokens and reducing issuance. This is a fundamentally driven rally, at least by crypto standards.
BNC is the most unusual of the three. It is tied to CEA Industries Inc., a US stock, and trades as a perpetual contract on Binance. At the time of the screenshot, BNCUSDT was trading at 5.129 USDT, up over 28% with 24-hour volume of 314 million USDT. The funding rate on BNC has been so elevated that exchanges have had to adjust their caps.
Three different assets. Three different narratives. But one common thread: futures are driving the price action.
Where the Real Risk Lives
The most telling data point across all three charts is the volume. USELESS recorded 1.42 billion tokens traded in 24 hours. VVV saw 9.38 million tokens traded. BNC moved 58.93 million tokens. These are not normal volume levels for these assets. This is speculative flow, pure and simple.
Now consider the broader market context. Bitcoin recently went through its sharpest deleveraging since 2023. Binance Bitcoin futures open interest briefly dropped below its 180-day moving average. That was a reset. Leverage was flushed out of the system.
But traders are already piling back in. And this time, they are targeting altcoins. Altcoin leverage has overtaken Bitcoin's for the first time since 2024. The market cap of altcoins outside the top 10 has climbed above 200 billion dollars, up more than 10% since the start of September.
This matters because leverage amplifies moves in both directions. When capital rotates into altcoins and the market turns, the unwind can be vicious. The three coins in today's analysis are not just moving together. They are moving on borrowed fuel.
$USELESS : The Memecoin That Is Not Joking
USELESS has been on an extraordinary run. From a low of 0.0668 on August 31, it climbed to a high of 0.316 on September 5, a gain of over 370%. The chart shows a recent pullback to 0.28541, with a 24-hour high of 0.31340 and a low of 0.21871.
The key level to watch is the resistance zone between 0.262 and 0.278. Price broke above this zone but has since retraced. If USELESS can hold above 0.285 and reclaim 0.313, the next leg higher could target 0.389. But if it loses 0.262, the structure changes.
The volume is the story here. 1.42 billion USELESS tokens traded in 24 hours is massive for a memecoin of this size. This is not organic accumulation. This is momentum trading at scale.
$VVV : Real Revenue, Real Questions
VVV is trading at 22.313 USDT, up over 26% with a 24-hour high of 25.767 and a low of 17.523. The token has been one of 2026's standout performers, climbing roughly 87% in a single month and close to 180% over three months.
The fundamental case is compelling. Venice AI has real users and real revenue. The buyback and burn mechanism is aggressive. The token supply reduction is meaningful. But here is the tension: even with all this positive news, VVV is still trading below its all-time high near 22.58. The AI trade has cooled, and the current rally may be more about speculative rotation than renewed conviction.
If VVV breaks above 25.767 with volume, the path to new highs is clear. But a rejection there could send it back toward the 19.118 support level.
$BNC : The Stock-Token Arbitrage
BNC is the most structurally interesting of the three. It is not a crypto project in the traditional sense. It is a perpetual contract tied to a US stock. The pre-market price of CEA Industries was 6.24 dollars at the time of the screenshot, while BNCUSDT traded at 5.129 USDT. That is a meaningful discount.
The funding rate on BNC has been a problem. It hit the 2% annualized cap, and exchanges have had to adjust their funding rate limits. This tells you that long positioning is extremely crowded. When a funding rate hits its cap, it means the market is overwhelmingly one-sided.
BNC broke above 5.129 and is now approaching 6.796. The 24-hour range is wide: from 3.668 to 6.796. That kind of volatility is dangerous for leveraged positions. If BNC continues higher, the shorts will get squeezed. But if it reverses, the longs will face a brutal unwind.
The Most Important Contradiction
Here is what stands out to me. Price is strong across all three assets. Volume is high. Catalysts are real. But the broader market is not uniformly bullish. Bitcoin dominance has opened September lower after being rejected at the important 60% level. And the taker buy-sell volume ratio in crypto futures is leaning short, with bearish bets accounting for 51.6% of the flow.
So we have a situation where altcoins are rallying hard while the broader futures market is leaning bearish. That is a contradiction. It suggests that the current altcoin rally may be more isolated and more speculative than it appears.
The other contradiction is the funding data. Altcoin leverage has overtaken Bitcoin's, but funding rates on many assets are still negative or neutral. That means traders are not paying a premium to be long. They are simply accumulating leveraged positions without conviction. That is a fragile setup.
What I Would Watch
For USELESS, watch the 0.285 level. If price holds above it and breaks 0.313, the bullish structure remains intact. If it loses 0.285 and drops below 0.262, the rally is over.
For VVV, the key is 25.767. A break above that with volume could trigger a squeeze toward the all-time high. A rejection would likely send it back to 19.118.
For BNC, the funding rate is the signal. If it stays elevated, longs are crowded. A liquidation cascade could send BNC back toward 3.668. But if the funding rate normalizes and price holds above 5.129, the path to 6.796 remains open.
My Take
I am watching this rotation closely, but I am not chasing it. The setup is interesting, but the risk is asymmetric. These assets have moved too far, too fast, on leverage that is becoming crowded. The catalysts are real, but the positioning is dangerous.
The part I would be careful with is the funding rate on BNC and the volume on USELESS. Those are the two most extreme data points. If they normalize, the rally could continue. If they accelerate, the unwind could be violent.
I would rather wait for a pullback to key support levels before considering entries. The liquidity is there, but so is the risk.
One Question
Given the elevated funding rates and crowded long positioning across these assets, do you see the current rally as the beginning of a sustained altcoin season or a short-term leverage flush waiting to happen?
Educational only. Not financial advice. Manage risk.
#useless #VVV #BNC #altcoins #FuturesTrading
1
154
·
--
Listen fam the Privacy coins are suddenly market leaders, but this looks like peak froth. 💛
$ZEC exploded 53% in six days, fueled by Grayscale's spot ETF conversion and a massive short squeeze that liquidated over $46 million in bearish positions. F2Pool's co-founder called it a "narrative short squeeze" with $3.18 billion in 24-hour volume—hard to reconcile with organic adoption. DASH followed as a laggard play, spiking from $30 to $78 before crashing 11% back to $62.58.
BEST SETUP: ZECUSDT
BIAS: SHORT on breakdown
ENTRY: $1,150 – $1,180
STOP LOSS: $1,250 (above recent peak)
TP1: $1,076
TP2: $1,000
$ZEC is trading 151% above its 200-day SMA, with momentum cooling on the daily MACD histogram. The 4-hour Supertrend support sits at $1,076—a break there accelerates downside. $DASH is a weaker setup; it's already rolled over post-DashCon, and as one trader noted, "ZEC涨完了,资金溢出到DASH; ZEC一旦回调,DASH会跌得更狠".
Risk: Another short squeeze could push ZEC toward $1,500. Wait for a confirmed break below $1,150 before entering.
Trade here 👇🏻
{future}(ZECUSDT)
{future}(DASHUSDT)
Is this the top for privacy coins, or just the beginning?
Educational only. Not financial advice. DYOR.
Listen fam the Privacy coins are suddenly market leaders, but this looks like peak froth. 💛
$ZEC exploded 53% in six days, fueled by Grayscale's spot ETF conversion and a massive short squeeze that liquidated over $46 million in bearish positions. F2Pool's co-founder called it a "narrative short squeeze" with $3.18 billion in 24-hour volume—hard to reconcile with organic adoption. DASH followed as a laggard play, spiking from $30 to $78 before crashing 11% back to $62.58.
BEST SETUP: ZECUSDT
BIAS: SHORT on breakdown
ENTRY: $1,150 – $1,180
STOP LOSS: $1,250 (above recent peak)
TP1: $1,076
TP2: $1,000
$ZEC is trading 151% above its 200-day SMA, with momentum cooling on the daily MACD histogram. The 4-hour Supertrend support sits at $1,076—a break there accelerates downside. $DASH is a weaker setup; it's already rolled over post-DashCon, and as one trader noted, "ZEC涨完了,资金溢出到DASH; ZEC一旦回调,DASH会跌得更狠".
Risk: Another short squeeze could push ZEC toward $1,500. Wait for a confirmed break below $1,150 before entering.
Trade here 👇🏻
Is this the top for privacy coins, or just the beginning?
Educational only. Not financial advice. DYOR.
$ZEC exploded 53% in six days, fueled by Grayscale's spot ETF conversion and a massive short squeeze that liquidated over $46 million in bearish positions. F2Pool's co-founder called it a "narrative short squeeze" with $3.18 billion in 24-hour volume—hard to reconcile with organic adoption. DASH followed as a laggard play, spiking from $30 to $78 before crashing 11% back to $62.58.
BEST SETUP: ZECUSDT
BIAS: SHORT on breakdown
ENTRY: $1,150 – $1,180
STOP LOSS: $1,250 (above recent peak)
TP1: $1,076
TP2: $1,000
$ZEC is trading 151% above its 200-day SMA, with momentum cooling on the daily MACD histogram. The 4-hour Supertrend support sits at $1,076—a break there accelerates downside. $DASH is a weaker setup; it's already rolled over post-DashCon, and as one trader noted, "ZEC涨完了,资金溢出到DASH; ZEC一旦回调,DASH会跌得更狠".
Risk: Another short squeeze could push ZEC toward $1,500. Wait for a confirmed break below $1,150 before entering.
Trade here 👇🏻
Is this the top for privacy coins, or just the beginning?
Educational only. Not financial advice. DYOR.
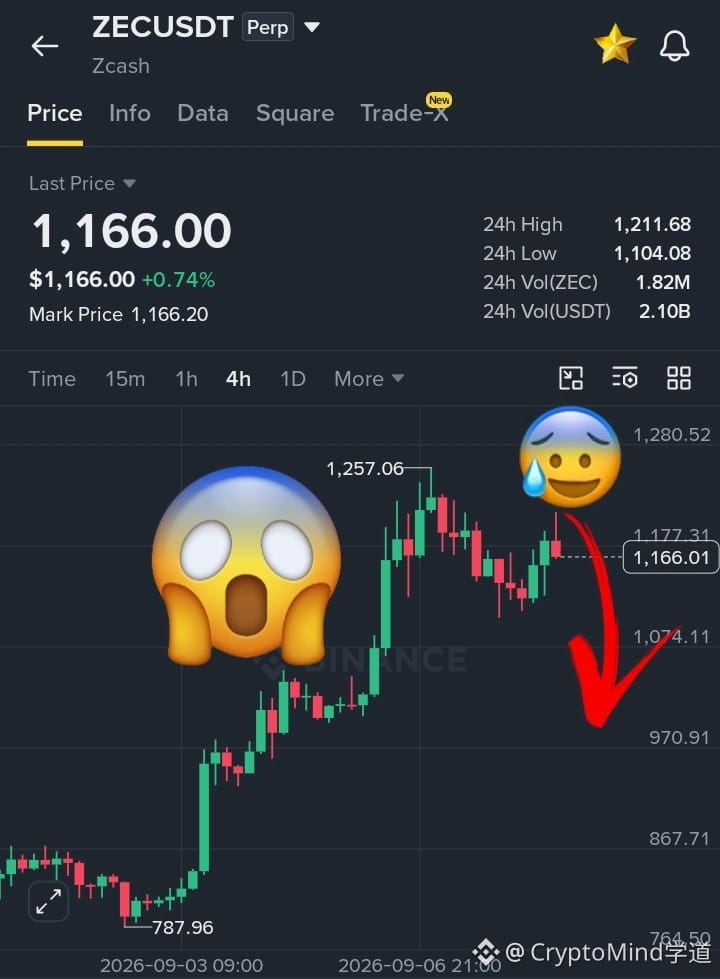
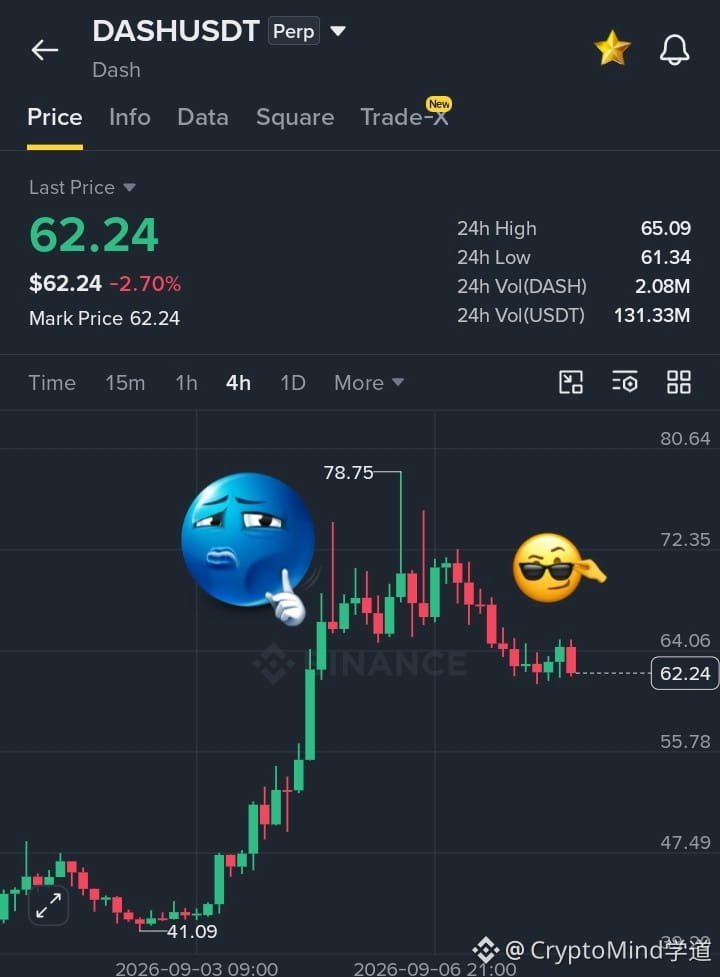
2
247
Log in to explore more content
Join global crypto users on Binance Square
⚡️ Get latest and useful information about crypto.
💬 Trusted by the world’s largest crypto exchange.
👍 Discover real insights from verified creators.
Email / Phone number
Trending Topics
AppleDebutsFoldablePhone
25,756 views
566 Discussing
Apple just dropped the foldable iPhone — and the market is paying attention. This isn't just another product cycle; it's a new product category, a new CEO on stage, and a $1,999 price tag that pushes $AAPL further into ultra-premium territory. Foldables are the narrative, and Apple is now the headline.
#appledebutsfoldablephone #EUExtendsCentralContactPointToCASPs #US10YTreasuryYieldHitsHighestSinceNov2023 #BrentCrudeTops$100 #USTreasuryToBuyBackUpTo$6BLongDatedDebt
KimHotbae
·2 Likes
·2.7k views
TSMCAugustRevenueUp53.3%YoY
315 views
69 Discussing
IranSaysReadyToEscalateWarWithUS
3,148 views
124 Discussing