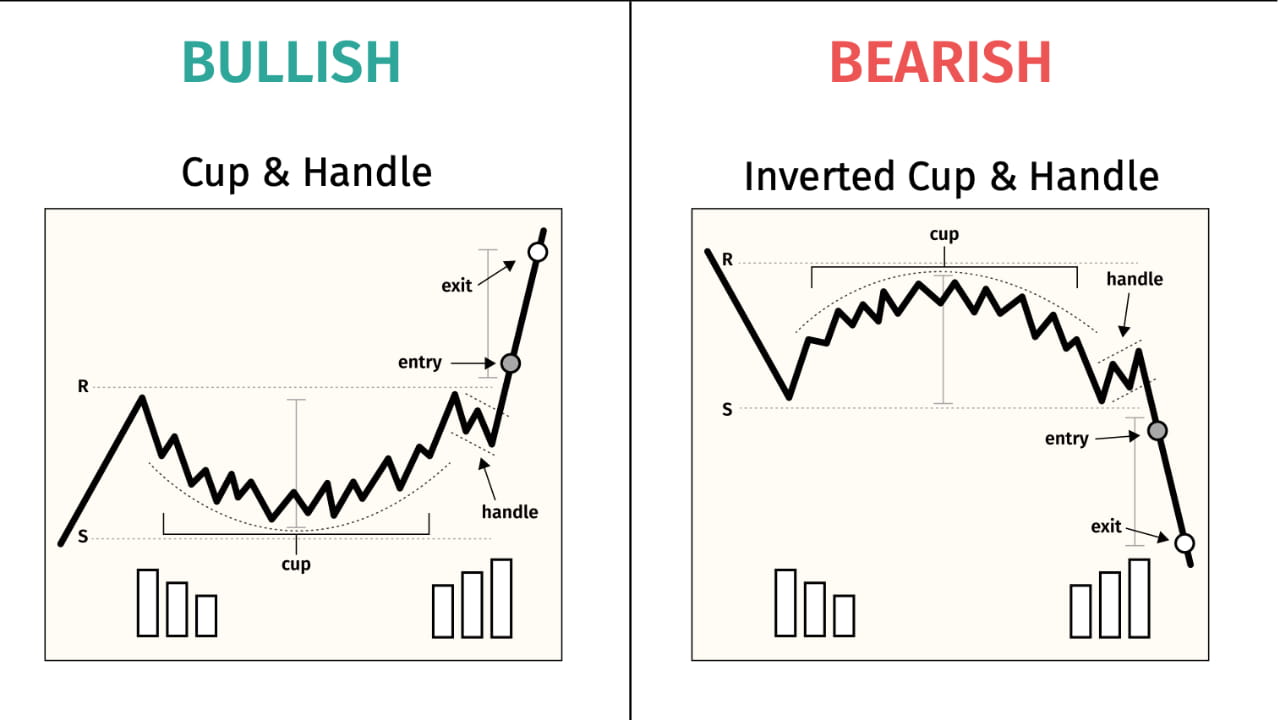

The Cup and Handle pattern is a bullish continuation pattern that is commonly used in technical analysis. It is formed when the price of an asset, such as a stock, initially forms a rounded bottom shape, resembling a cup, followed by a brief period of consolidation, forming a handle.
The Cup formation is characterized by a gradual decline in the asset's price, followed by
buyers start to enter the market. This gradual price increase usually takes the form of a U-shaped or rounded bottom, forming the "Cup" of the pattern. The Cup formation can take several weeks to several months to form and should be visually confirmed with a price chart.
After the Cup formation, there is often a brief consolidation period where the price trades sideways, forming a handle. The handle is typically formed by a slight downward drift in the price with low trading volumes. This indicates that buyers are taking a pause before resuming the uptrend.
When the price breaks out above the handle's resistance level, it is considered a signal to buy. This indicates that buyers are taking control and the uptrend is likely to continue.
Traders often use the height of the Cup as a target for the expected price increase. The target is calculated by measuring the distance from the bottom of the Cup to the highest point of the pattern and adding it to the breakout point.
It's important to note that like all technical patterns, the Cup and Handle pattern is not always reliable and should be confirmed with other technical indicators and analysis before making a trading decision. Additionally, the pattern should be validated by strong volume during the breakout.

The Inverse Cup and Handle pattern is a bearish reversal pattern that is the opposite of the Cup and Handle pattern. It is also known as the "Saucer Top" pattern, and it is formed when the price of an asset initially forms a rounded top shape, resembling an inverted cup, followed by a brief period of consolidation forming a handle.
The Inverse Cup formation is characterized by a gradual increase in the asset's price, followed by a gradual decrease as sellers start to enter the market. This gradual price decrease usually takes the form of a U-shaped or rounded top, forming the "Inverse Cup" of the pattern. The Inverse Cup formation can take several weeks to several months to form and should be visually confirmed with a price chart.
After the Inverse Cup formation, there is often a brief consolidation period where the price trades sideways, forming a handle. The handle is typically formed by a slight upward drift in the price with low trading volumes. This indicates that sellers are taking a pause before resuming the downtrend.
When the price breaks down below the handle's support level, it is considered a signal to sell. This indicates that sellers are taking control and the downtrend is likely to continue.
Traders often use the height of the Inverse Cup as a target for the expected price decrease. The target is calculated by measuring the distance from the top of the Inverse Cup to the lowest point of the pattern and subtracting it from the breakdown point.
Like all technical patterns, the Inverse Cup and Handle pattern is not always reliable and should be confirmed with other technical indicators and analysis before making a trading decision. Additionally, the pattern should be validated by strong volume during the breakdown.