
#backtest
backtest
3,820 views
29 Discussing
Hot
Latest

·
--
💡 Backtest data won’t cheat anyone:
8 years, 53,392 verified trades👇
🥇 EMA7/25 + RSI → PF=1.67
🥈 Add 4+ conditions → Win rate 57.1%
🥉 Add 7+ conditions → Win rate 57.6%
Key point:
❌ Win rate 60% but PF<1 → loses long-term
✅ Win rate 46% but PF=1.67 → makes money long-term
Risk-reward ratio > win rate
This is the mistake most beginners make
#量化交易 #Backtest #Crypto
💡 Backtest data won’t cheat anyone:
8 years, 53,392 verified trades👇
🥇 EMA7/25 + RSI → PF=1.67
🥈 Add 4+ conditions → Win rate 57.1%
🥉 Add 7+ conditions → Win rate 57.6%
Key point:
❌ Win rate 60% but PF<1 → loses long-term
✅ Win rate 46% but PF=1.67 → makes money long-term
Risk-reward ratio > win rate
This is the mistake most beginners make
#量化交易 #Backtest #Crypto
8 years, 53,392 verified trades👇
🥇 EMA7/25 + RSI → PF=1.67
🥈 Add 4+ conditions → Win rate 57.1%
🥉 Add 7+ conditions → Win rate 57.6%
Key point:
❌ Win rate 60% but PF<1 → loses long-term
✅ Win rate 46% but PF=1.67 → makes money long-term
Risk-reward ratio > win rate
This is the mistake most beginners make
#量化交易 #Backtest #Crypto
61
·
--
💡 Backtest data won’t cheat you:
8 years, 53,392 trades verified👇
🥇 EMA7/25+RSI → PF=1.67
🥈 Added 4+ conditions → Win rate 57.1%
🥉 Added 7+ conditions → Win rate 57.6%
Key point:
❌ Win rate 60% but PF<1 → lose long-term
✅ Win rate 46% but PF=1.67 → profit long-term
Risk-reward ratio > win rate
This is what most beginners get wrong
#量化交易 #Backtest #Crypto
💡 Backtest data won’t cheat you:
8 years, 53,392 trades verified👇
🥇 EMA7/25+RSI → PF=1.67
🥈 Added 4+ conditions → Win rate 57.1%
🥉 Added 7+ conditions → Win rate 57.6%
Key point:
❌ Win rate 60% but PF<1 → lose long-term
✅ Win rate 46% but PF=1.67 → profit long-term
Risk-reward ratio > win rate
This is what most beginners get wrong
#量化交易 #Backtest #Crypto
8 years, 53,392 trades verified👇
🥇 EMA7/25+RSI → PF=1.67
🥈 Added 4+ conditions → Win rate 57.1%
🥉 Added 7+ conditions → Win rate 57.6%
Key point:
❌ Win rate 60% but PF<1 → lose long-term
✅ Win rate 46% but PF=1.67 → profit long-term
Risk-reward ratio > win rate
This is what most beginners get wrong
#量化交易 #Backtest #Crypto
79

$XAUT ALERT: SPDR flows falling win 61% of the time 📊
The data is clear: following the large “gold” fund flows is a bad strategy. My backtest shows that when SPDR sells 1+ tonne, XAUT rebounds 61.4% of the time the next day. This is a signal worth taking into account—the market already prices in these flow figures before you even see them.
Trying to trade by buying the fund only gives you a win rate of 52.6%, which is worse than chance over a bullish year. The smartest short-term play is to systematically “do the opposite” (fade) the fund, rather than follow it.
Are you trading the flows or fading them?
This is not financial advice. Always manage your risk.
#XAUT #GOLD #FadeTheFlow #Backtest #CryptoAnalysis
$XAU
{future}(XAUUSDT)
$XAUT
{future}(XAUTUSDT)
$XAUT ALERT: SPDR flows falling win 61% of the time 📊
The data is clear: following the large “gold” fund flows is a bad strategy. My backtest shows that when SPDR sells 1+ tonne, XAUT rebounds 61.4% of the time the next day. This is a signal worth taking into account—the market already prices in these flow figures before you even see them.
Trying to trade by buying the fund only gives you a win rate of 52.6%, which is worse than chance over a bullish year. The smartest short-term play is to systematically “do the opposite” (fade) the fund, rather than follow it.
Are you trading the flows or fading them?
This is not financial advice. Always manage your risk.
#XAUT #GOLD #FadeTheFlow #Backtest #CryptoAnalysis
$XAU
$XAUT
The data is clear: following the large “gold” fund flows is a bad strategy. My backtest shows that when SPDR sells 1+ tonne, XAUT rebounds 61.4% of the time the next day. This is a signal worth taking into account—the market already prices in these flow figures before you even see them.
Trying to trade by buying the fund only gives you a win rate of 52.6%, which is worse than chance over a bullish year. The smartest short-term play is to systematically “do the opposite” (fade) the fund, rather than follow it.
Are you trading the flows or fading them?
This is not financial advice. Always manage your risk.
#XAUT #GOLD #FadeTheFlow #Backtest #CryptoAnalysis
$XAU
$XAUT

2
111

·
--
$BTC BACKTEST DATA REVEALS THE COST OF AVERAGING DOWN — CAN YOU GUESS THE COIN? 📉
Entry: Not provided
Target: Not provided
Stop Loss: Not provided
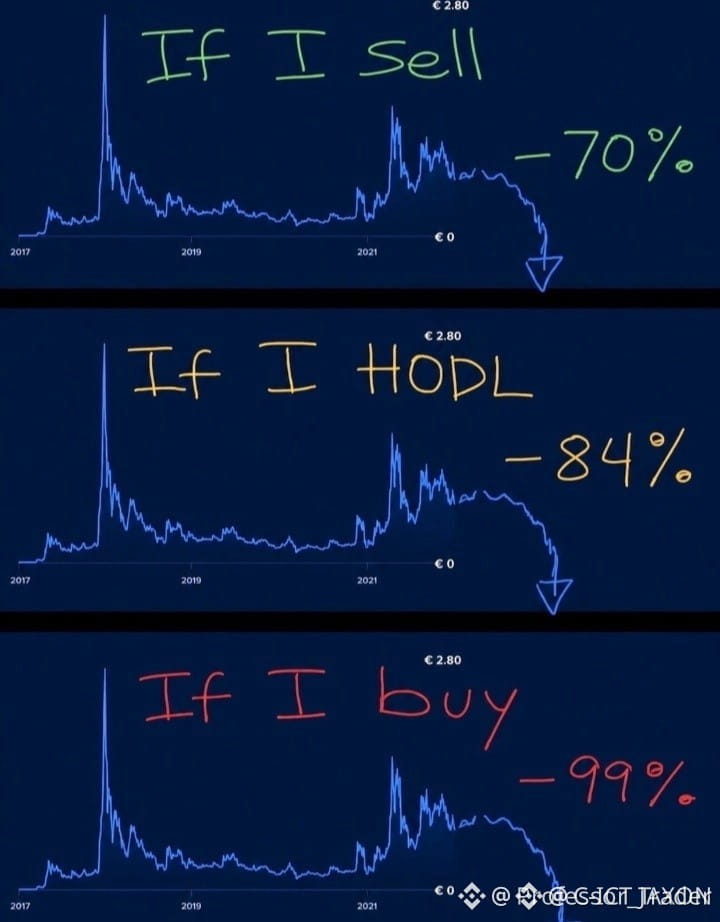
This is a real backtest scenario: selling at -70% preserves some capital, while HODLing at -84% leaves you near zero, and buying more at -99% nearly wipes you out. The numbers speak for themselves — the worst mistake was adding to a losing position.
The lesson? Cutting losses early protects against total ruin. But these results are tied to a specific coin. Which one do you think produced this pattern?
Not financial advice. Always manage your risk.
#Crypto #TradingStrategy #RiskManagement #Backtest
💎
$BTC BACKTEST DATA REVEALS THE COST OF AVERAGING DOWN — CAN YOU GUESS THE COIN? 📉
Entry: Not provided
Target: Not provided
Stop Loss: Not provided
This is a real backtest scenario: selling at -70% preserves some capital, while HODLing at -84% leaves you near zero, and buying more at -99% nearly wipes you out. The numbers speak for themselves — the worst mistake was adding to a losing position.
The lesson? Cutting losses early protects against total ruin. But these results are tied to a specific coin. Which one do you think produced this pattern?
Not financial advice. Always manage your risk.
#Crypto #TradingStrategy #RiskManagement #Backtest
💎
Entry: Not provided
Target: Not provided
Stop Loss: Not provided
This is a real backtest scenario: selling at -70% preserves some capital, while HODLing at -84% leaves you near zero, and buying more at -99% nearly wipes you out. The numbers speak for themselves — the worst mistake was adding to a losing position.
The lesson? Cutting losses early protects against total ruin. But these results are tied to a specific coin. Which one do you think produced this pattern?
Not financial advice. Always manage your risk.
#Crypto #TradingStrategy #RiskManagement #Backtest
💎
53
·
--
💡 Backtesting data doesn't lie:
8 years, 53,392 trades verified👇
🥇 EMA7/25 + RSI → PF=1.67
🥈 Adding 4+ conditions → Win rate 57.1%
🥉 Adding 7+ conditions → Win rate 57.6%
Key points:
❌ Win rate 60% but PF < 1 → Long-term losses
✅ Win rate 46% but PF = 1.67 → Long-term gains
Risk-reward ratio > Win rate
This is where most newbies get it wrong
#量化交易 #Backtest #Crypto
💡 Backtesting data doesn't lie:
8 years, 53,392 trades verified👇
🥇 EMA7/25 + RSI → PF=1.67
🥈 Adding 4+ conditions → Win rate 57.1%
🥉 Adding 7+ conditions → Win rate 57.6%
Key points:
❌ Win rate 60% but PF < 1 → Long-term losses
✅ Win rate 46% but PF = 1.67 → Long-term gains
Risk-reward ratio > Win rate
This is where most newbies get it wrong
#量化交易 #Backtest #Crypto
8 years, 53,392 trades verified👇
🥇 EMA7/25 + RSI → PF=1.67
🥈 Adding 4+ conditions → Win rate 57.1%
🥉 Adding 7+ conditions → Win rate 57.6%
Key points:
❌ Win rate 60% but PF < 1 → Long-term losses
✅ Win rate 46% but PF = 1.67 → Long-term gains
Risk-reward ratio > Win rate
This is where most newbies get it wrong
#量化交易 #Backtest #Crypto
66
·
--
$BLUAI BREAKOUT BACKTESTING CRITICAL SUPPORT ZONE RIGHT NOW 🎯
Target: 0.06 🚀
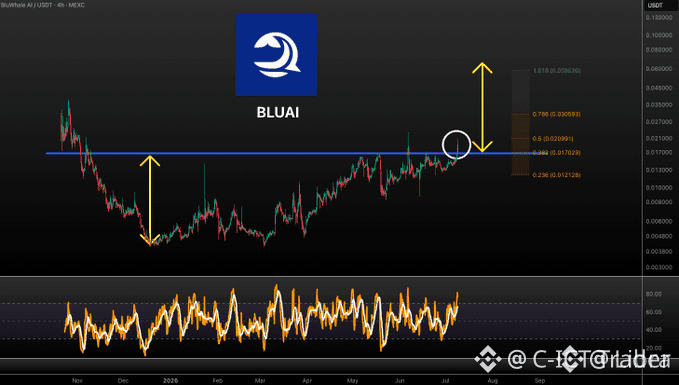
The initial breakout above resistance is now retesting that level as support. If this backtest holds and volume confirms, the measured move targets $0.06 exactly. On the lower timeframes, the pullback has already swept last week's liquidity, which often precedes continuation.
Are you waiting for a clean close above the retest or are you already positioned?
Not financial advice. Always manage your risk.
#BLUAI #Breakout #Backtest #Crypto #Altcoin
🎯
$BLUAI BREAKOUT BACKTESTING CRITICAL SUPPORT ZONE RIGHT NOW 🎯
Target: 0.06 🚀
The initial breakout above resistance is now retesting that level as support. If this backtest holds and volume confirms, the measured move targets $0.06 exactly. On the lower timeframes, the pullback has already swept last week's liquidity, which often precedes continuation.
Are you waiting for a clean close above the retest or are you already positioned?
Not financial advice. Always manage your risk.
#BLUAI #Breakout #Backtest #Crypto #Altcoin
🎯
Target: 0.06 🚀
The initial breakout above resistance is now retesting that level as support. If this backtest holds and volume confirms, the measured move targets $0.06 exactly. On the lower timeframes, the pullback has already swept last week's liquidity, which often precedes continuation.
Are you waiting for a clean close above the retest or are you already positioned?
Not financial advice. Always manage your risk.
#BLUAI #Breakout #Backtest #Crypto #Altcoin
🎯
85
·
--
$YB BREAKOUT CONFIRMED WITH CLEAN BACKTEST TO SUPPORT 🔥
Entry: $0.0778 🔥
Target: $0.0817 🚀
Stop Loss: $0.07 ⚠️
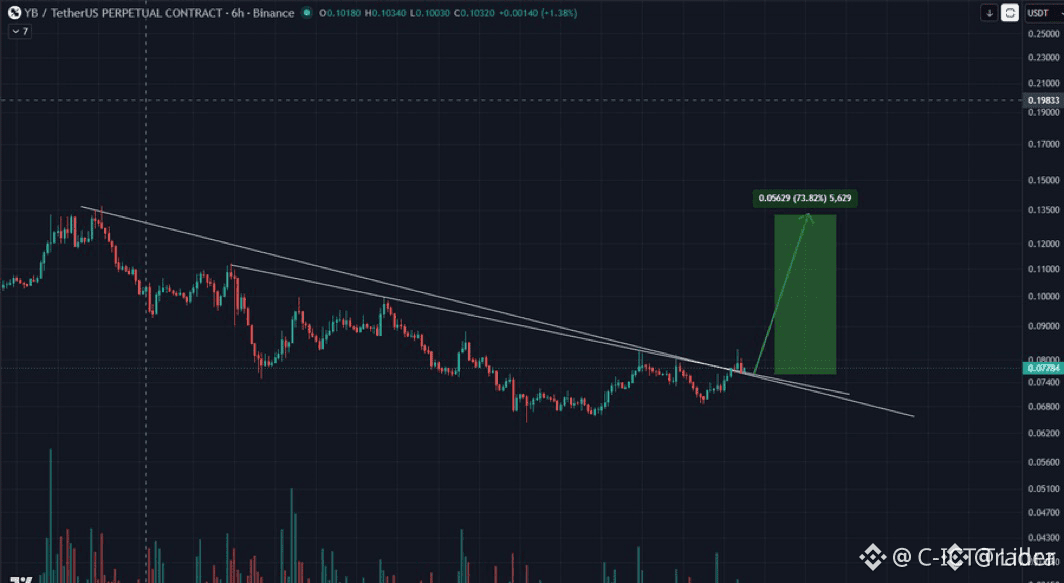
Structure shows a clear breakout above resistance followed by a textbook backtest into the $0.0778 zone. This price rejected the retest with confidence — the same area that previously served as resistance is now acting as support. Volume on the retest was lower than the breakout candle, suggesting sellers are exhausted.
With targets extending to $0.1556, the R:R on the first leg alone sits above 2:1. Momentum aligns, and the microstructure favors continuation. Are you adding size here or scaling in?
Not financial advice. Always manage your risk.
#YB #LongSetup #Breakout #Backtest #Crypto
🔥
$YB BREAKOUT CONFIRMED WITH CLEAN BACKTEST TO SUPPORT 🔥
Entry: $0.0778 🔥
Target: $0.0817 🚀
Stop Loss: $0.07 ⚠️
Structure shows a clear breakout above resistance followed by a textbook backtest into the $0.0778 zone. This price rejected the retest with confidence — the same area that previously served as resistance is now acting as support. Volume on the retest was lower than the breakout candle, suggesting sellers are exhausted.
With targets extending to $0.1556, the R:R on the first leg alone sits above 2:1. Momentum aligns, and the microstructure favors continuation. Are you adding size here or scaling in?
Not financial advice. Always manage your risk.
#YB #LongSetup #Breakout #Backtest #Crypto
🔥
Entry: $0.0778 🔥
Target: $0.0817 🚀
Stop Loss: $0.07 ⚠️
Structure shows a clear breakout above resistance followed by a textbook backtest into the $0.0778 zone. This price rejected the retest with confidence — the same area that previously served as resistance is now acting as support. Volume on the retest was lower than the breakout candle, suggesting sellers are exhausted.
With targets extending to $0.1556, the R:R on the first leg alone sits above 2:1. Momentum aligns, and the microstructure favors continuation. Are you adding size here or scaling in?
Not financial advice. Always manage your risk.
#YB #LongSetup #Breakout #Backtest #Crypto
🔥
100

·
--
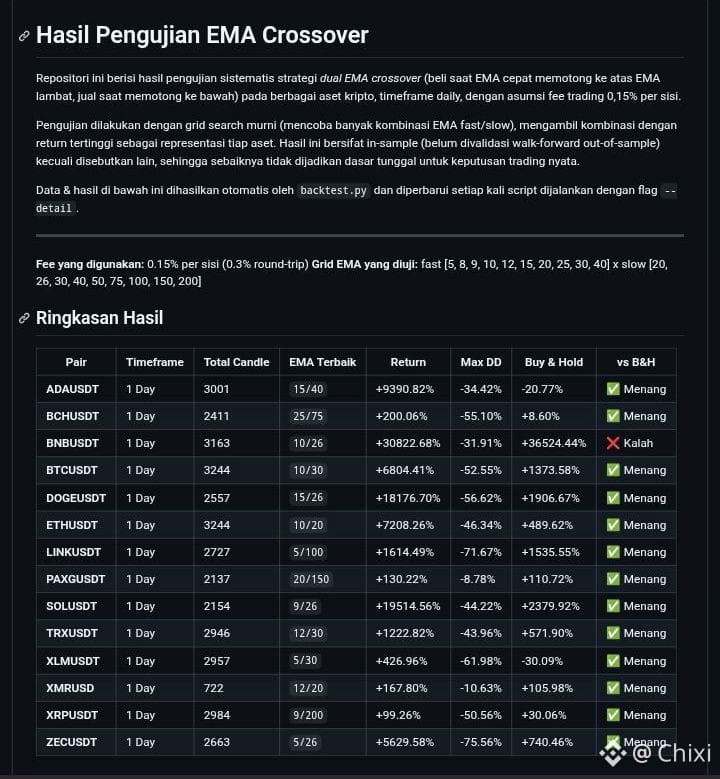
I tried testing the optimization of an EMA Crossover for 14 crypto assets, and here are the results.
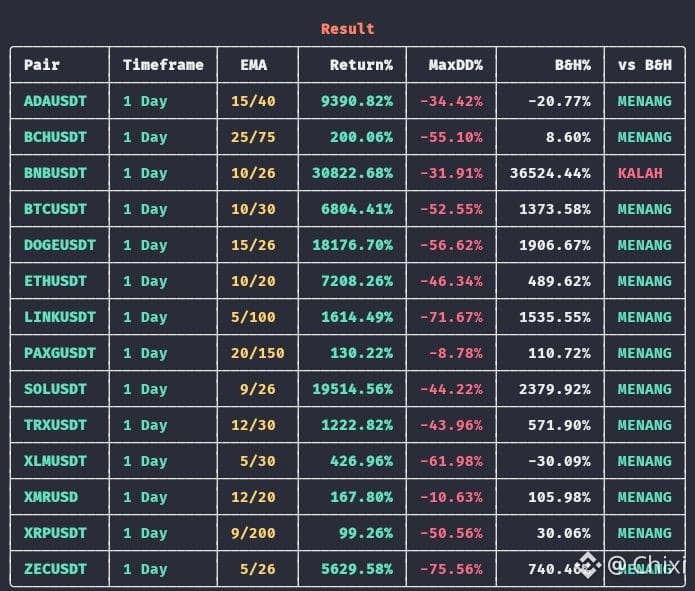
Systematic dual-EMA crossover backtest (buy when the fast EMA crosses above the slow EMA, sell when it crosses below), fee 0.15% per side, for spot, daily timeframe. Tested on 14 assets: BTC, ETH, BNB, SOL, XMR, DOGE, ADA, XRP, LINK, TRX, XLM, ZEC, BCH, PAXG. Most cover complete history since listing (2000–3200+ candles per asset).
Methodology: grid search EMA fast(5-40) x slow(20-200), 90 combinations per asset, take the highest return, compare versus Buy & Hold.
Key findings:
1. 13 out of 14 assets, EMA crossover outperforms Buy & Hold
2. Optimal parameters are NOT universal. Each asset has different combinations (BTC 10/30, ETH 20/26, SOL 9/26, XMR 12/20, etc.). There is no “one setting for all”
3. Win rate is low (25–50%) but still profitable in a typical trend-following way: a few big trades carry the overall return
4. BNB actually LOSSES versus Buy & Hold. This shows the strategy doesn’t always work; it depends on the character of price movements of each asset
Each crypto asset has a different EMA Crossover optimization. This optimization may change as more price data accumulates and continues to grow for testing materials. This method optimizes the EMA Crossover using historical data that has already happened.
Methodological warning (important, don’t skip):
This is purely in-sample optimization; it hasn’t been walk-forwarded to out-of-sample. Large returns in historical backtests DO NOT guarantee the same performance going forward. Overfitting is a real risk. As a comparison, RSI and MACD were also tested using the identical methodology and consistently lost to EMA on the same data.
This is an independent research for learning, not an invitation or trading signal. Screenshots of the results are attached below.
#EMA
#Backtest
#TradingStrategy
#CryptoResearch
#DYOR
I tried testing the optimization of an EMA Crossover for 14 crypto assets, and here are the results.
Systematic dual-EMA crossover backtest (buy when the fast EMA crosses above the slow EMA, sell when it crosses below), fee 0.15% per side, for spot, daily timeframe. Tested on 14 assets: BTC, ETH, BNB, SOL, XMR, DOGE, ADA, XRP, LINK, TRX, XLM, ZEC, BCH, PAXG. Most cover complete history since listing (2000–3200+ candles per asset).
Methodology: grid search EMA fast(5-40) x slow(20-200), 90 combinations per asset, take the highest return, compare versus Buy & Hold.
Key findings:
1. 13 out of 14 assets, EMA crossover outperforms Buy & Hold
2. Optimal parameters are NOT universal. Each asset has different combinations (BTC 10/30, ETH 20/26, SOL 9/26, XMR 12/20, etc.). There is no “one setting for all”
3. Win rate is low (25–50%) but still profitable in a typical trend-following way: a few big trades carry the overall return
4. BNB actually LOSSES versus Buy & Hold. This shows the strategy doesn’t always work; it depends on the character of price movements of each asset
Each crypto asset has a different EMA Crossover optimization. This optimization may change as more price data accumulates and continues to grow for testing materials. This method optimizes the EMA Crossover using historical data that has already happened.
Methodological warning (important, don’t skip):
This is purely in-sample optimization; it hasn’t been walk-forwarded to out-of-sample. Large returns in historical backtests DO NOT guarantee the same performance going forward. Overfitting is a real risk. As a comparison, RSI and MACD were also tested using the identical methodology and consistently lost to EMA on the same data.
This is an independent research for learning, not an invitation or trading signal. Screenshots of the results are attached below.
#EMA
#Backtest
#TradingStrategy
#CryptoResearch
#DYOR
Systematic dual-EMA crossover backtest (buy when the fast EMA crosses above the slow EMA, sell when it crosses below), fee 0.15% per side, for spot, daily timeframe. Tested on 14 assets: BTC, ETH, BNB, SOL, XMR, DOGE, ADA, XRP, LINK, TRX, XLM, ZEC, BCH, PAXG. Most cover complete history since listing (2000–3200+ candles per asset).
Methodology: grid search EMA fast(5-40) x slow(20-200), 90 combinations per asset, take the highest return, compare versus Buy & Hold.
Key findings:
1. 13 out of 14 assets, EMA crossover outperforms Buy & Hold
2. Optimal parameters are NOT universal. Each asset has different combinations (BTC 10/30, ETH 20/26, SOL 9/26, XMR 12/20, etc.). There is no “one setting for all”
3. Win rate is low (25–50%) but still profitable in a typical trend-following way: a few big trades carry the overall return
4. BNB actually LOSSES versus Buy & Hold. This shows the strategy doesn’t always work; it depends on the character of price movements of each asset
Each crypto asset has a different EMA Crossover optimization. This optimization may change as more price data accumulates and continues to grow for testing materials. This method optimizes the EMA Crossover using historical data that has already happened.
Methodological warning (important, don’t skip):
This is purely in-sample optimization; it hasn’t been walk-forwarded to out-of-sample. Large returns in historical backtests DO NOT guarantee the same performance going forward. Overfitting is a real risk. As a comparison, RSI and MACD were also tested using the identical methodology and consistently lost to EMA on the same data.
This is an independent research for learning, not an invitation or trading signal. Screenshots of the results are attached below.
#EMA
#Backtest
#TradingStrategy
#CryptoResearch
#DYOR
2
176
·
--
$XAG RETURNS TO THE TRENDLINE THAT CONTROLLED PRICE FOR 50 YEARS 📉
Entry: $56 🔥
Target: $63 🚀
Stop Loss: $48 ⚠️
Silver is back at the same trendline that defined its largest bull and bear moves for five decades. That line acted as bulletproof resistance in 1980 and 2011 before finally breaking higher. Now the market is retesting it as potential support — a textbook backtest that will tell us if the breakout is real.
The next weekly support zone sits between $52 and $48, and a successful hold above that range opens the path toward $63. Volume on the monthly chart is still elevated compared to the pre-breakout years. Are you buying this retest or waiting for a clearer entry?
Not financial advice. Always manage your risk.
#XAG #Silver #TechnicalAnalysis #Commodities #Backtest
🔥
$XAG RETURNS TO THE TRENDLINE THAT CONTROLLED PRICE FOR 50 YEARS 📉
Entry: $56 🔥
Target: $63 🚀
Stop Loss: $48 ⚠️
Silver is back at the same trendline that defined its largest bull and bear moves for five decades. That line acted as bulletproof resistance in 1980 and 2011 before finally breaking higher. Now the market is retesting it as potential support — a textbook backtest that will tell us if the breakout is real.
The next weekly support zone sits between $52 and $48, and a successful hold above that range opens the path toward $63. Volume on the monthly chart is still elevated compared to the pre-breakout years. Are you buying this retest or waiting for a clearer entry?
Not financial advice. Always manage your risk.
#XAG #Silver #TechnicalAnalysis #Commodities #Backtest
🔥
Entry: $56 🔥
Target: $63 🚀
Stop Loss: $48 ⚠️
Silver is back at the same trendline that defined its largest bull and bear moves for five decades. That line acted as bulletproof resistance in 1980 and 2011 before finally breaking higher. Now the market is retesting it as potential support — a textbook backtest that will tell us if the breakout is real.
The next weekly support zone sits between $52 and $48, and a successful hold above that range opens the path toward $63. Volume on the monthly chart is still elevated compared to the pre-breakout years. Are you buying this retest or waiting for a clearer entry?
Not financial advice. Always manage your risk.
#XAG #Silver #TechnicalAnalysis #Commodities #Backtest
🔥
223
Log in to explore more content
Join global crypto users on Binance Square
⚡️ Get latest and useful information about crypto.
💬 Trusted by the world’s largest crypto exchange.
👍 Discover real insights from verified creators.
Email / Phone number
Trending Topics
1
#USContinuingJoblessClaims1.774M
898 views
83 Discussing
2
#USAugustPPIYoYRisesTo5.4%
927 views
64 Discussing
3
#AppleDebutsFoldablePhone
56,361 views
1,102 Discussing
4
#TSMCAugustRevenueUp53.3%YoY
14,695 views
414 Discussing
5
#IranSaysReadyToEscalateWarWithUS
18,833 views
415 Discussing
6
#EUExtendsCentralContactPointToCASPs
17,145 views
442 Discussing
7
#US10YTreasuryYieldHitsHighestSinceNov2023
42,014 views
661 Discussing
8
#USTreasuryToBuyBackUpTo$6BLongDatedDebt
23,486 views
191 Discussing
9
#BitcoinSurpasses$79K
79,665 views
301 Discussing
10
#BrentCrudeTops$100
138,853 views
431 Discussing