What the chart is saying (4H timeframe)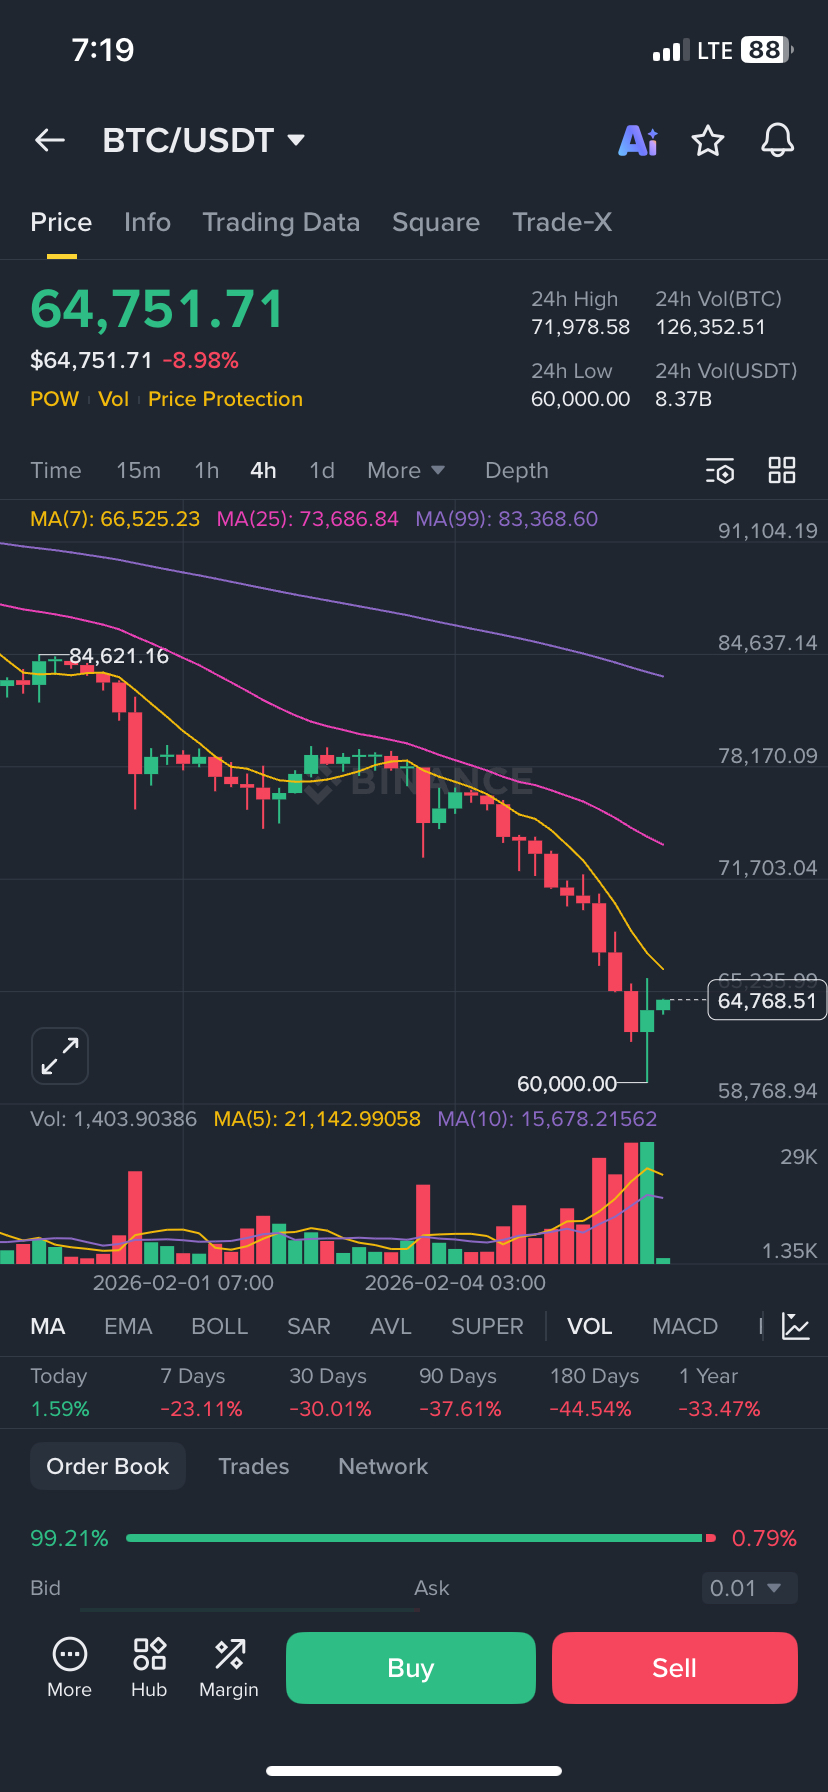
• Strong downtrend: Price is below MA(7), MA(25), and MA(99) → bears are in control.
• Major support tested: ~$60,000 was hit and bounced.
• Current price ~64,700 looks like a dead-cat bounce / relief bounce, not a trend reversal yet.
• High volume on the drop → panic selling, but also big buyers stepped in near 60k.
Key levels to watch
Support
• $60,000 – very strong psychological + technical support
• If this breaks → next zone $56k–58k
Resistance
• $66,500 (MA7 area)
• $71,000–73,000 (very strong, MA25 + previous breakdown)
• Only above $73k does the trend start to look healthier
Short-term future (days–weeks)
• Likely sideways or choppy between $60k–68k
• High volatility ⚠️
• Not a good spot for emotional long entries
Medium-term (weeks–months)
• If BTC holds above $60k → accumulation phase → possible recovery later
• If $60k breaks cleanly → expect another leg down
Big picture truth 🧠
• Trend = bearish
• Structure = damaged
• Long-term BTC is still strong, but this is not a bull confirmation yet
If you’re trading
• ❌ Don’t FOMO long here
• ✅ Wait for higher high + higher low
• ✅ Or buy slowly only near strong supports

