Bitcoin is currently trading around $63K after a heavy daily breakdown candle.
And honestly… this is the kind of move that makes people panic, but for BTC, it’s not really “new”. Before talking about where BTC is going next, let’s quickly understand one thing:BTC doesn’t just move up smoothly.
It moves like a staircase… and sometimes it kicks people off the stairs.
BTC Has Always Moved Like This: Uptrend With Drops in Between
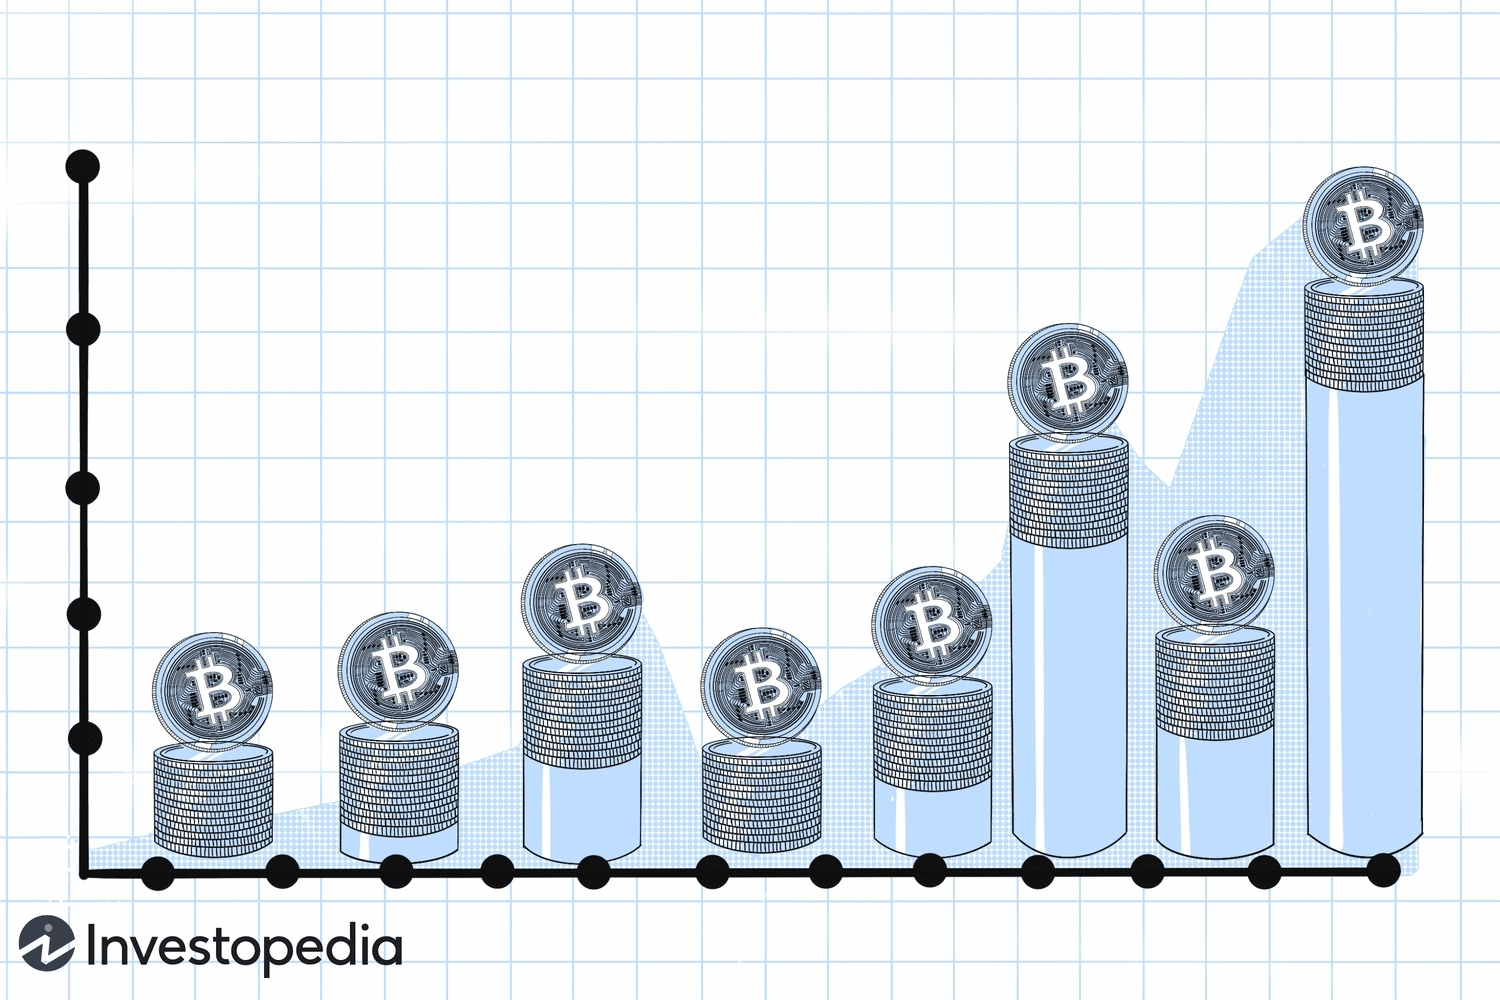
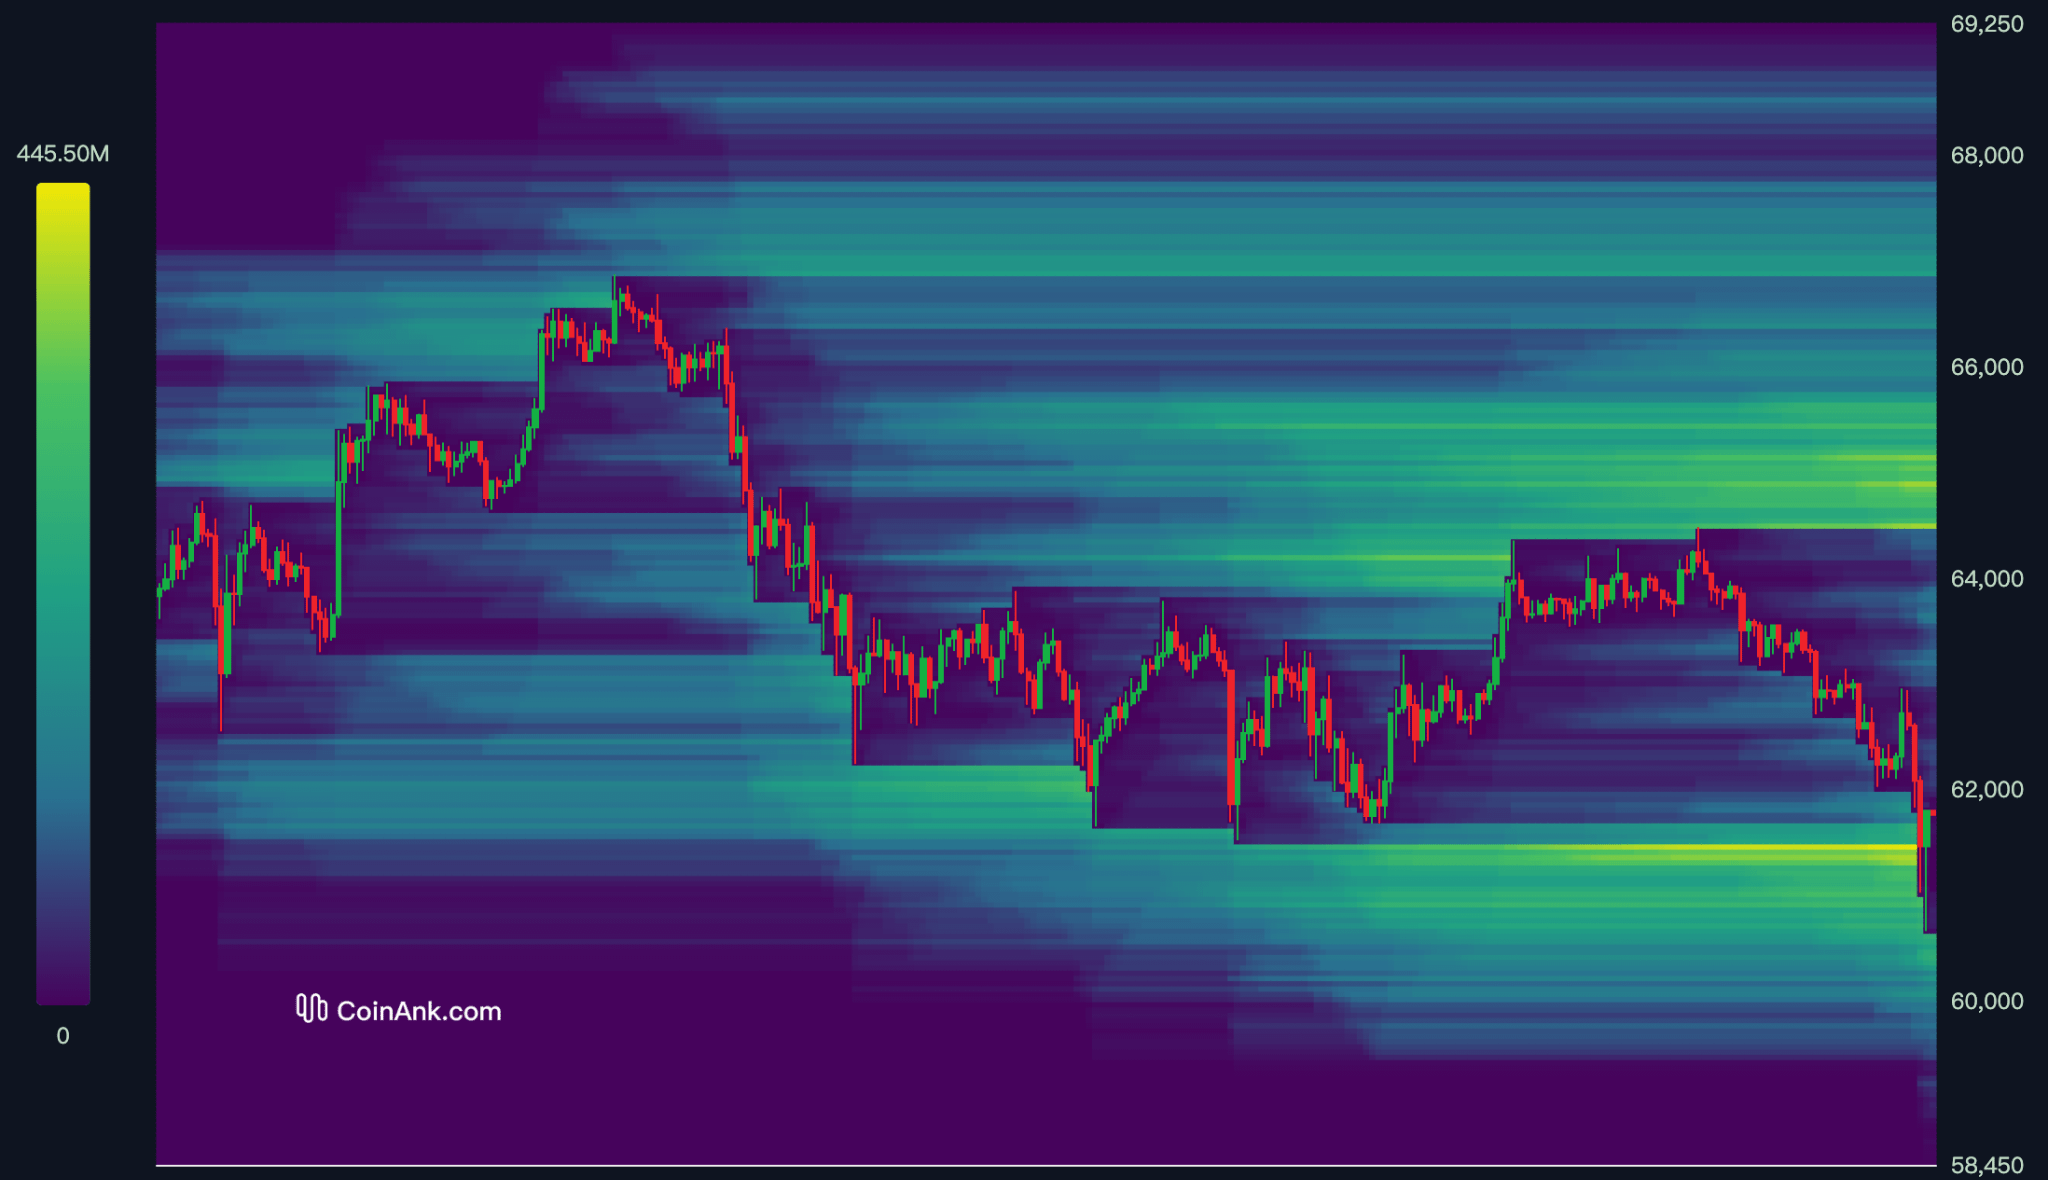
This picture basically explains BTC perfectly.
Bitcoin’s whole history is:
Slow climb
Sudden dump
Sideways chop
Then another big leg up
That’s why BTC rewards patience and destroys overconfidence.
BTC Price History (2009–2025): Drops Are Normal
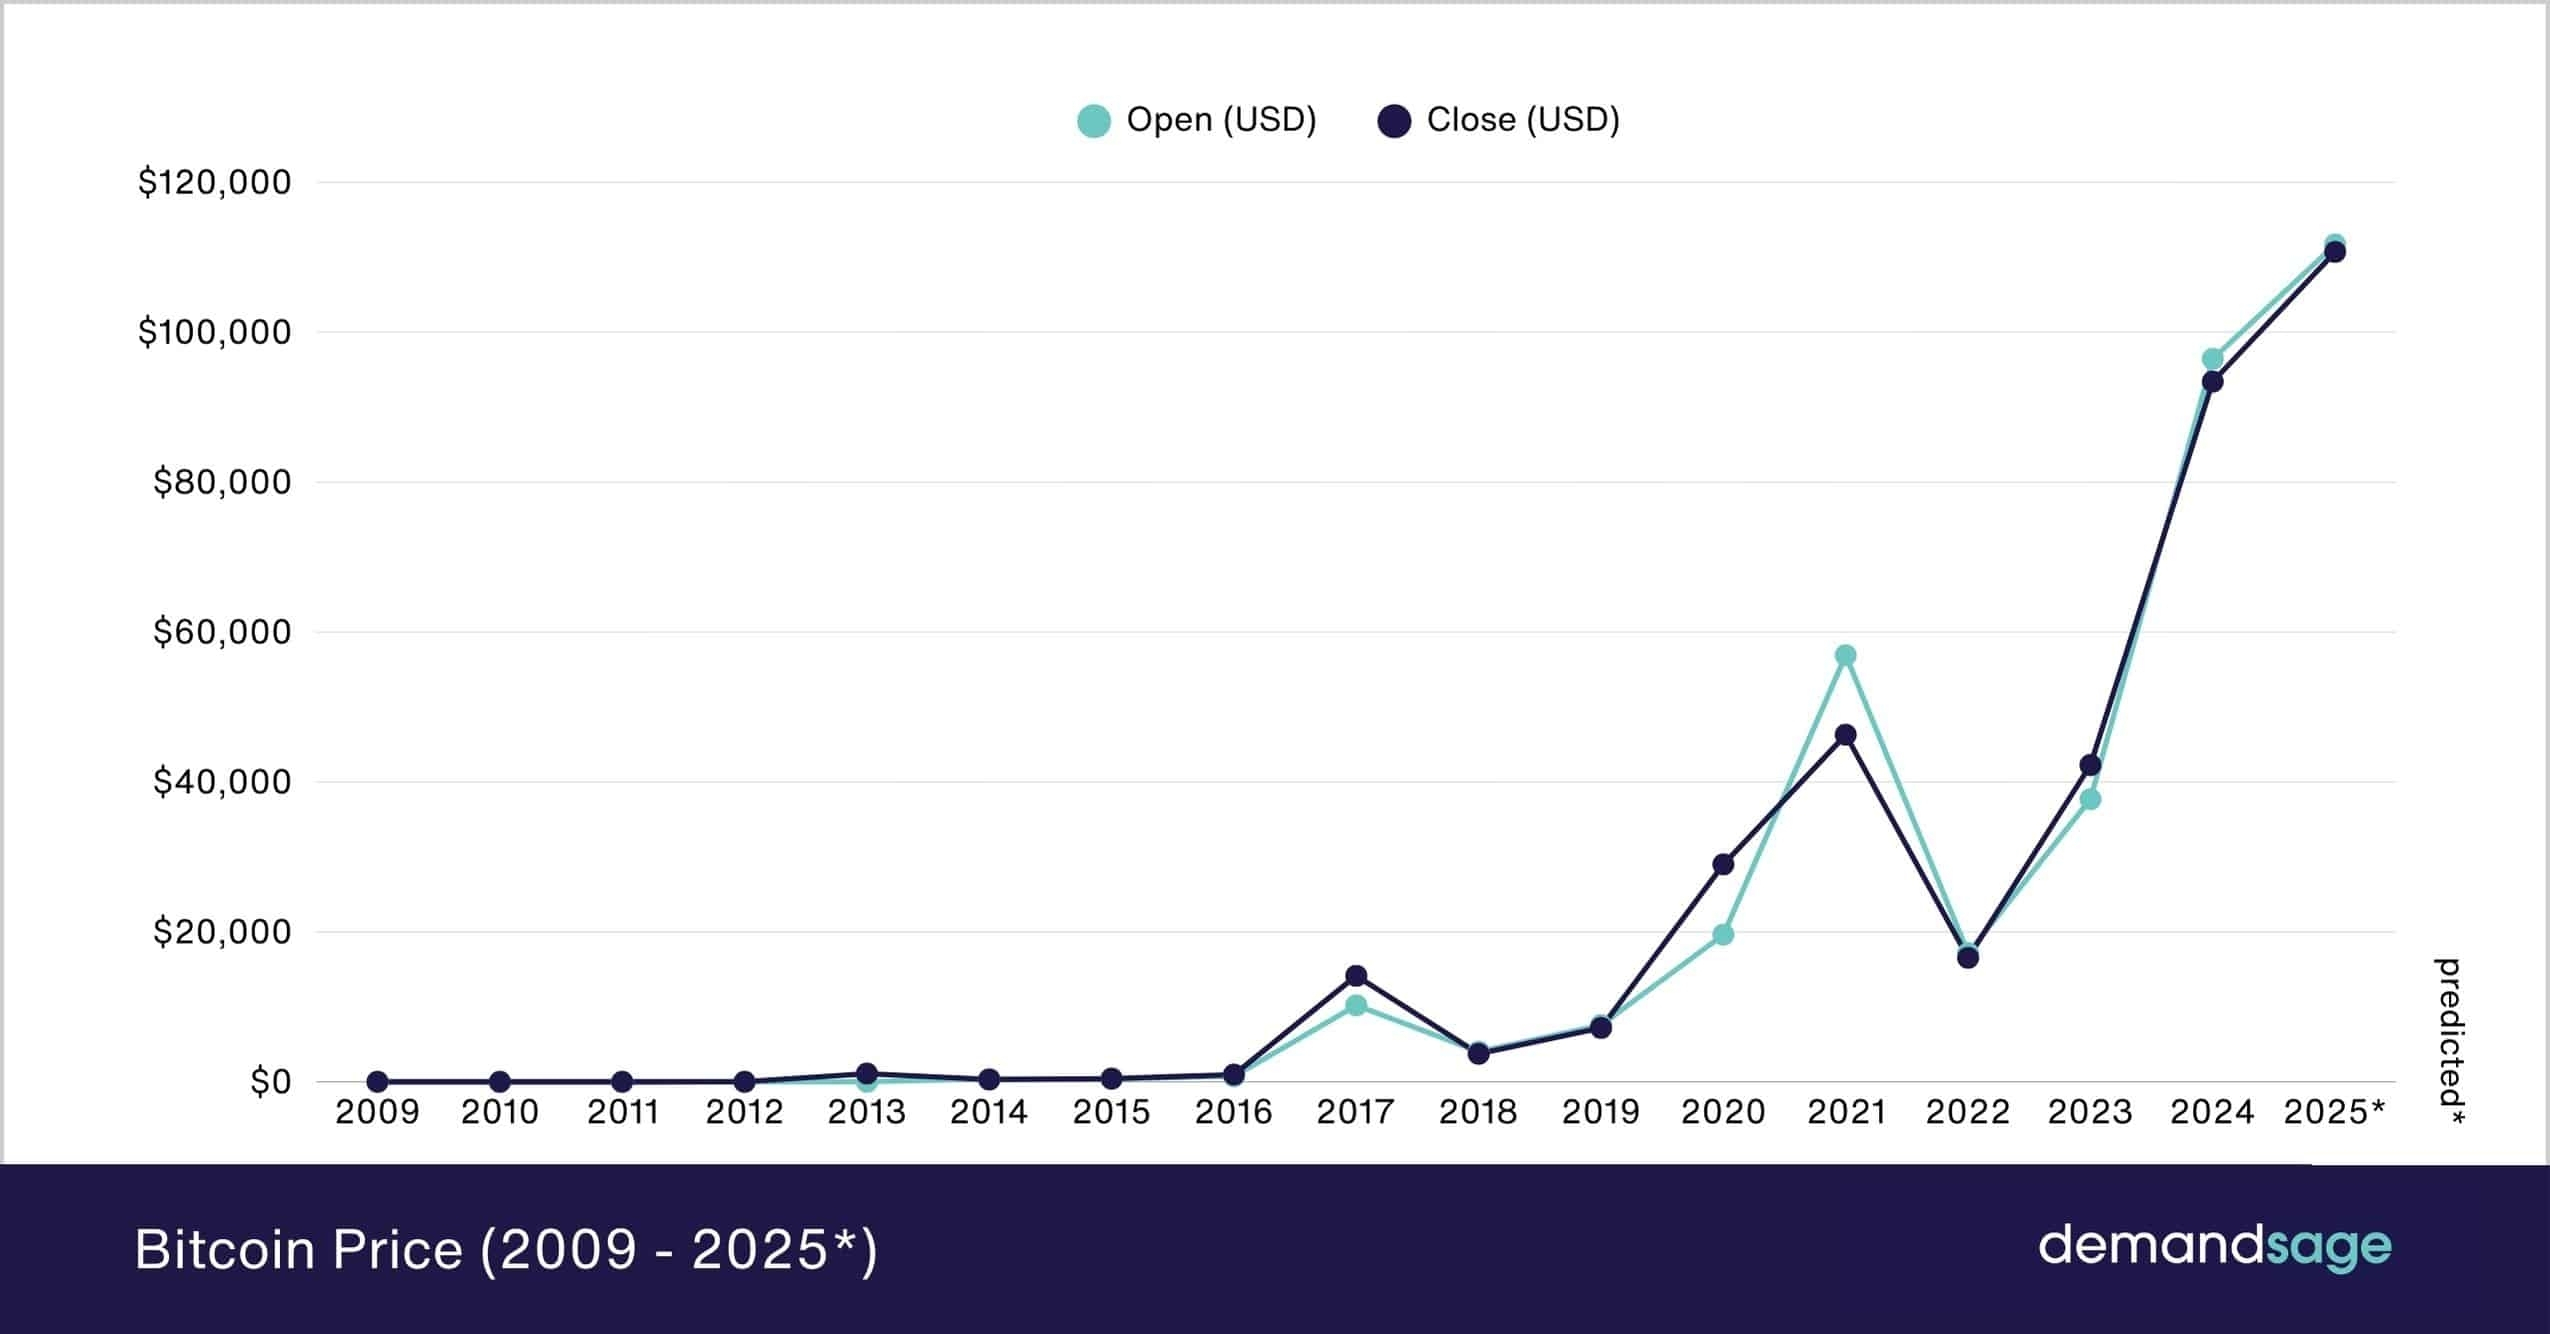
If you look at BTC’s full history, it’s honestly crazy how many times it “looked dead”…
2013 crash
2017 crash
2021 crash
2022 full bear market
And every time, BTC eventually came back stronger.
That’s why I personally never treat a BTC drop like the “end of Bitcoin”.
The real question is always: Is this a normal correction, or a trend shift?
Now Let’s Talk About What’s Happening Right Now
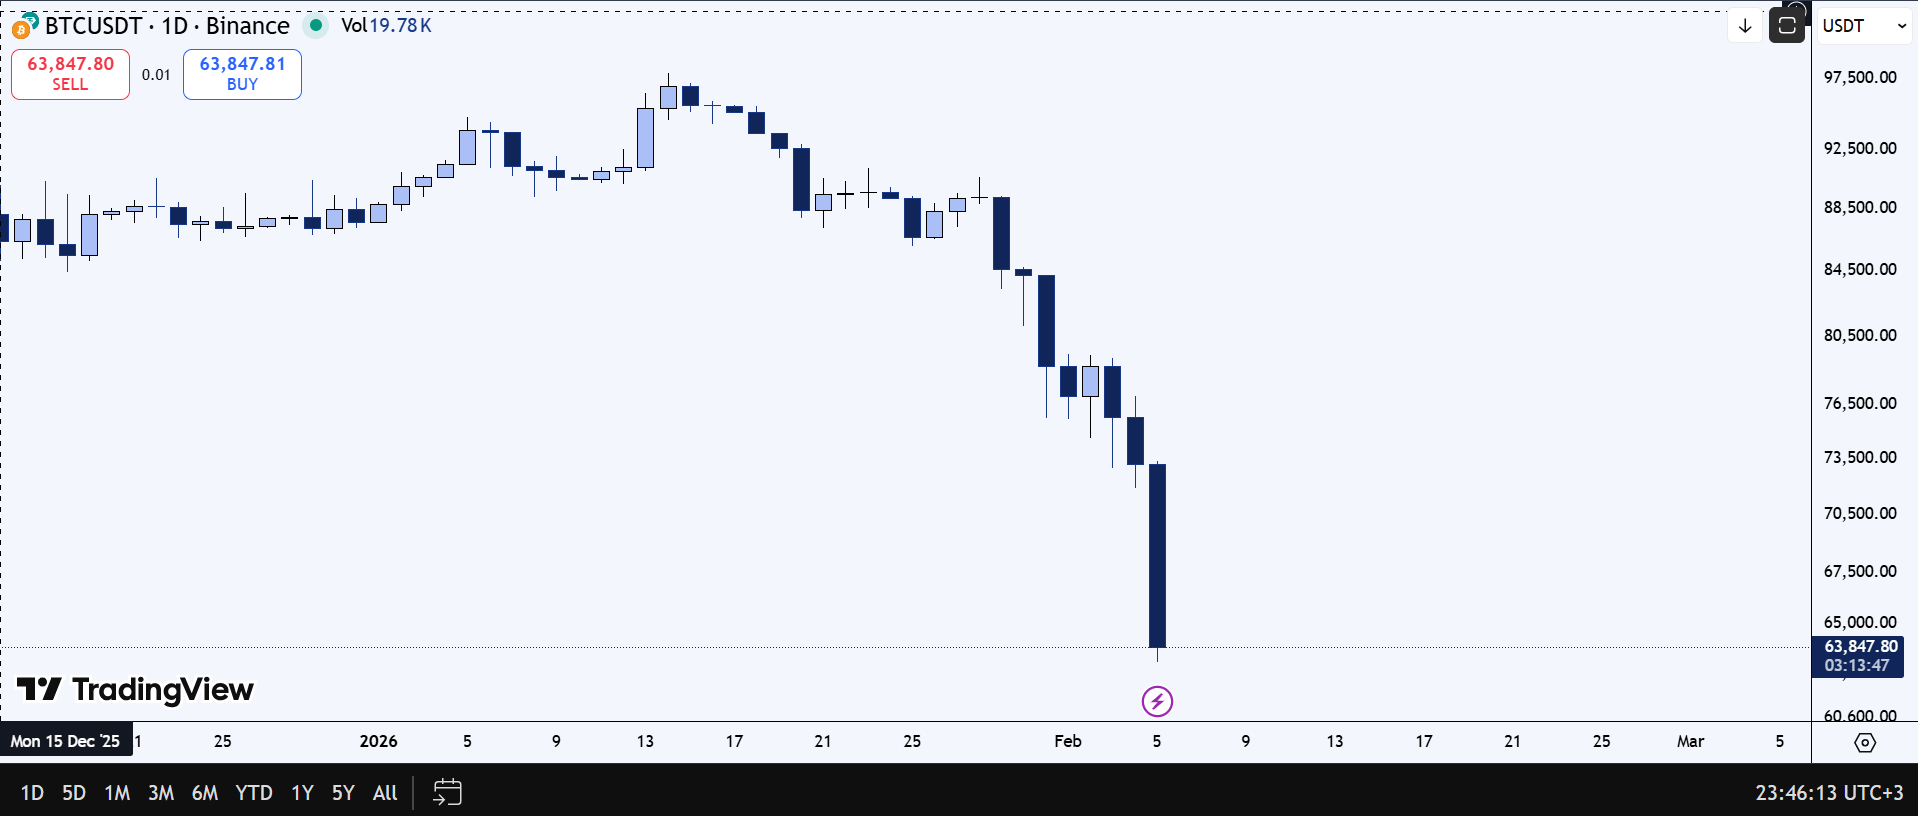
BTC basically printed a clean bearish sequence:
lower highs
weak bounces
then one big breakdown candle straight into $63K
This type of candle usually means: Support levels got smashed + leverage got wiped out.
Why Did BTC Drop This Hard?
Why Did BTC Drop This Hard? (Simple Explanation)
A lot of people will say “BTC dropped because of fear.”
I don’t think that’s the real reason.
Here’s what makes more sense:
Risk-Off Market Mood
When markets turn risk-off, BTC behaves like a high-risk asset.
If stocks and tech are weak, crypto usually gets hit harder.
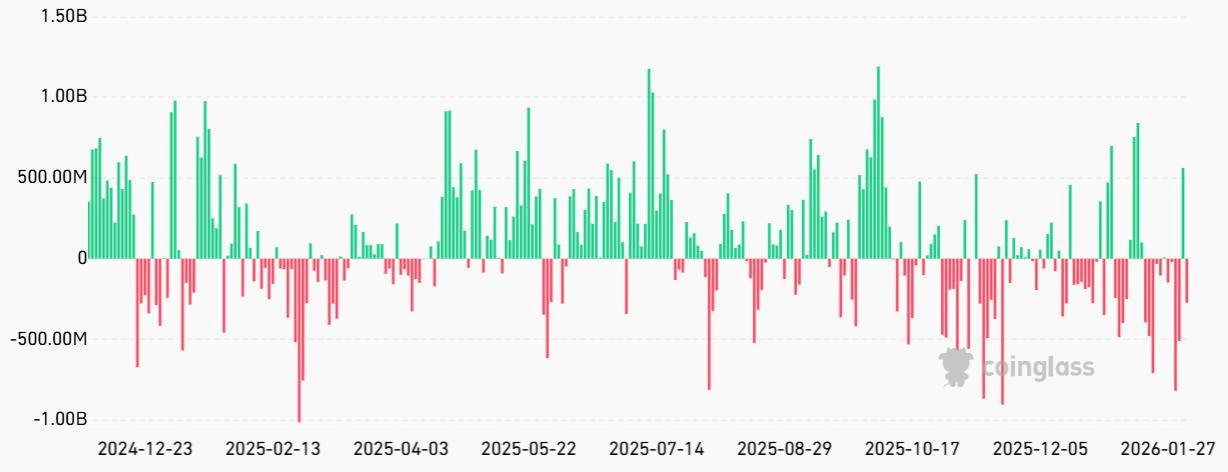
ETF Demand Isn’t Saving the Dip Right Now
Spot Bitcoin ETF flows have been weaker lately, with outflows showing up again.
That means less support on dips.
Liquidations (The Real Killer)
Once BTC broke key support, it likely triggered:
stop losses
liquidation cascades
forced selling
That’s how a normal drop turns into a waterfall.
Key Levels We Should Be Watching
This is the most important part for traders.
🟢 Support Zones (Where Buyers Might Step In)
Support 1: $63K to $65K
This is the current zone BTC is sitting on right now.
If BTC holds here, we can get a relief bounce.
Support 2: $60.6K
This is the next major level on our chart.
If BTC breaks $63K cleanly, I won’t be surprised if price gets dragged toward $60K.
Psychological numbers always attract liquidity.
🔴 Resistance Zones (Where Bounces Will Get Sold)
Resistance 1: $67.5K
If BTC can reclaim this level, short-term bounce becomes realistic.
Resistance 2: $70.5K
This is where sellers will likely defend hard.
Resistance 3: $73.5K
This one is huge.
It was supported before the breakdown, so now it has become resistant.
If BTC gets back above $73.5K and holds, then the panic narrative cools down.
Where BTC Is Going Next (3 Scenarios)
I don’t like making one prediction, because BTC doesn’t care about opinions.
So here’s the clean way to think:
✅ Scenario A: Relief Bounce (Most Likely Short-Term)
If BTC holds $63K–$65K, then we can easily see a bounce toward:
$67.5K
then $70.5K
This would mostly be a short squeeze + dip buyers stepping in.
⚠️ Scenario B: Sideways Chop (Market Reset)
If BTC can’t reclaim $67.5K quickly, it might just chop in a range:
$63K to $70K range
This is the worst phase because people overtrade and lose slowly.
🚨 Scenario C: Deeper Dump (If $63K Breaks)
If BTC closes daily below $63K, then the next magnet becomes:
$60.6K
That’s the next major “where liquidity sits” zone.
So… Should you buy BTC here?
Personally, I’m not going all-in here.
This is what I’m doing instead:
My Plan:
If BTC holds $63K and stabilizes, I’ll consider scaling small buys
If BTC loses $63K, I’ll wait for $60K area
If BTC reclaims $67.5K with strength, then I’ll start thinking bullish short-term again
I’d rather miss the first 3% move than catch a falling knife.
Share your thoughts and hit the like button if you have enjoyed the reading...
