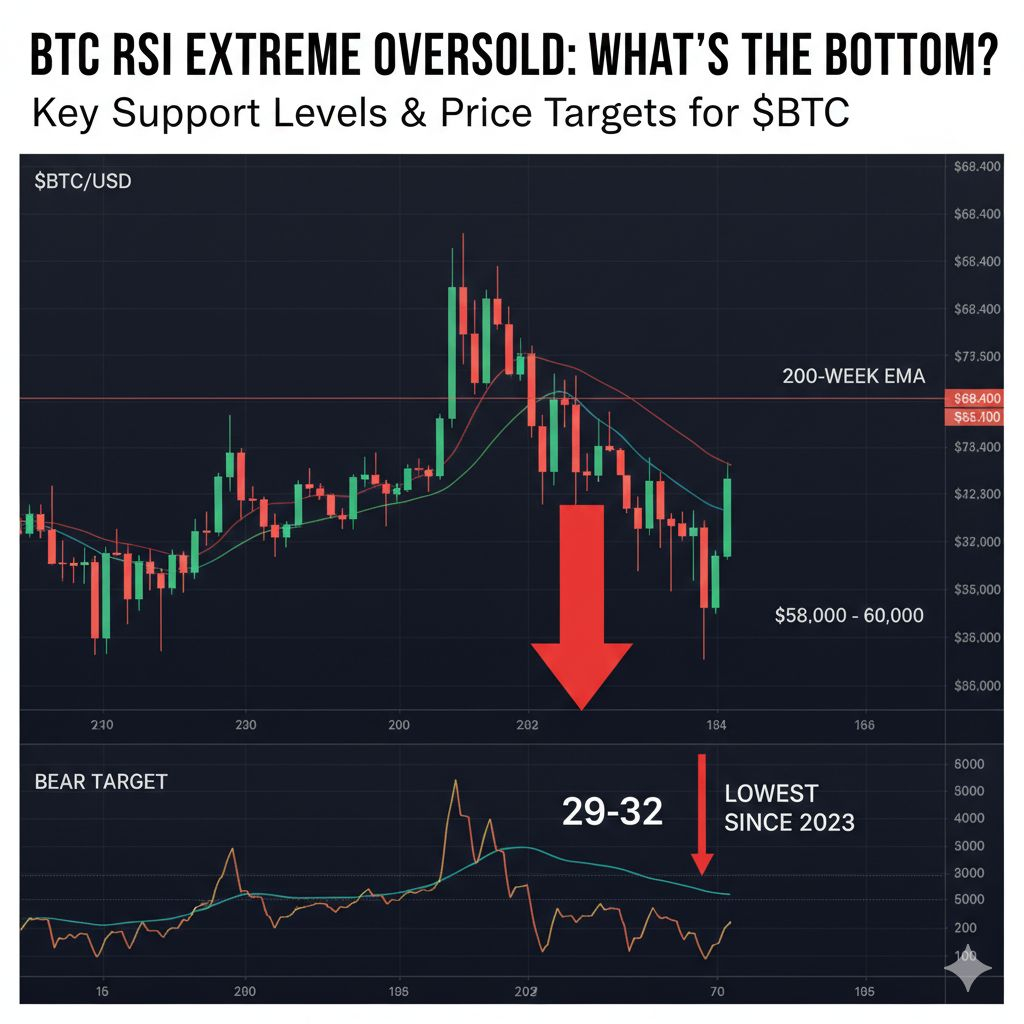
The fear is palpable. As of February 2026, Bitcoin's Weekly RSI has plummeted to levels not seen since the 2023 consolidation phase, hovering around the 29-32 mark. Historically, when the RSI hits these Oversold levels, we are either at a generational bottom or very close to a massive relief bounce.
The Technical Breakdown:
🔍 Currently,$BTC is testing the psychological 69,000$ - $70,000 zone. This area is critical because it aligns with the previous 2024 All-Time High support.
Where is the Real Bottom? While many are panic selling, seasoned analysts are eyeing two primary Bottom Targets:
The Bull Case ($68,400):This is the 200-week EMA. Historically, this moving average has acted as the ultimate floor for Bitcoin in every major correction. If we bounce here, the RSI will form a classic bullish divergence.
The Bear Case ($58,000 - $60,000):If the $68k support fails, the next high-liquidity zone lies near the mid-$50k range. This would represent a ~50% drawdown from our $126k peak a standard correction in crypto cycles.
My Take:💡 The RSI doesn't lie; momentum is extremely exhausted. We are in the Max Pain phase where weak hands are flushed out. I am looking for a bottom formation between $68k and $65k before a trend reversal attempt back toward $80k.
What is your move? Are you catching the falling knife at $69k, or waiting for the 200-week EMA at $68k? Let me know your targets! 👇
#Bitcoin #RSI #CryptoAnalysis #MarketBottom #TradingStrategy
