WAL/USDT Technical Analysis: Key Levels, Trend Outlook, and Market Scenarios


Introduction
The cryptocurrency market remains highly volatile, offering both risks and opportunities for traders. WAL/USDT has recently attracted attention after bouncing from a key support level. In this article, we will take a detailed look at WAL/USDT using short-term technical analysis, focusing on price action, support and resistance levels, and possible bullish and bearish scenarios.
This analysis is based on the 15-minute timeframe, which is commonly used by intraday and short-term traders.
Current Market Overview
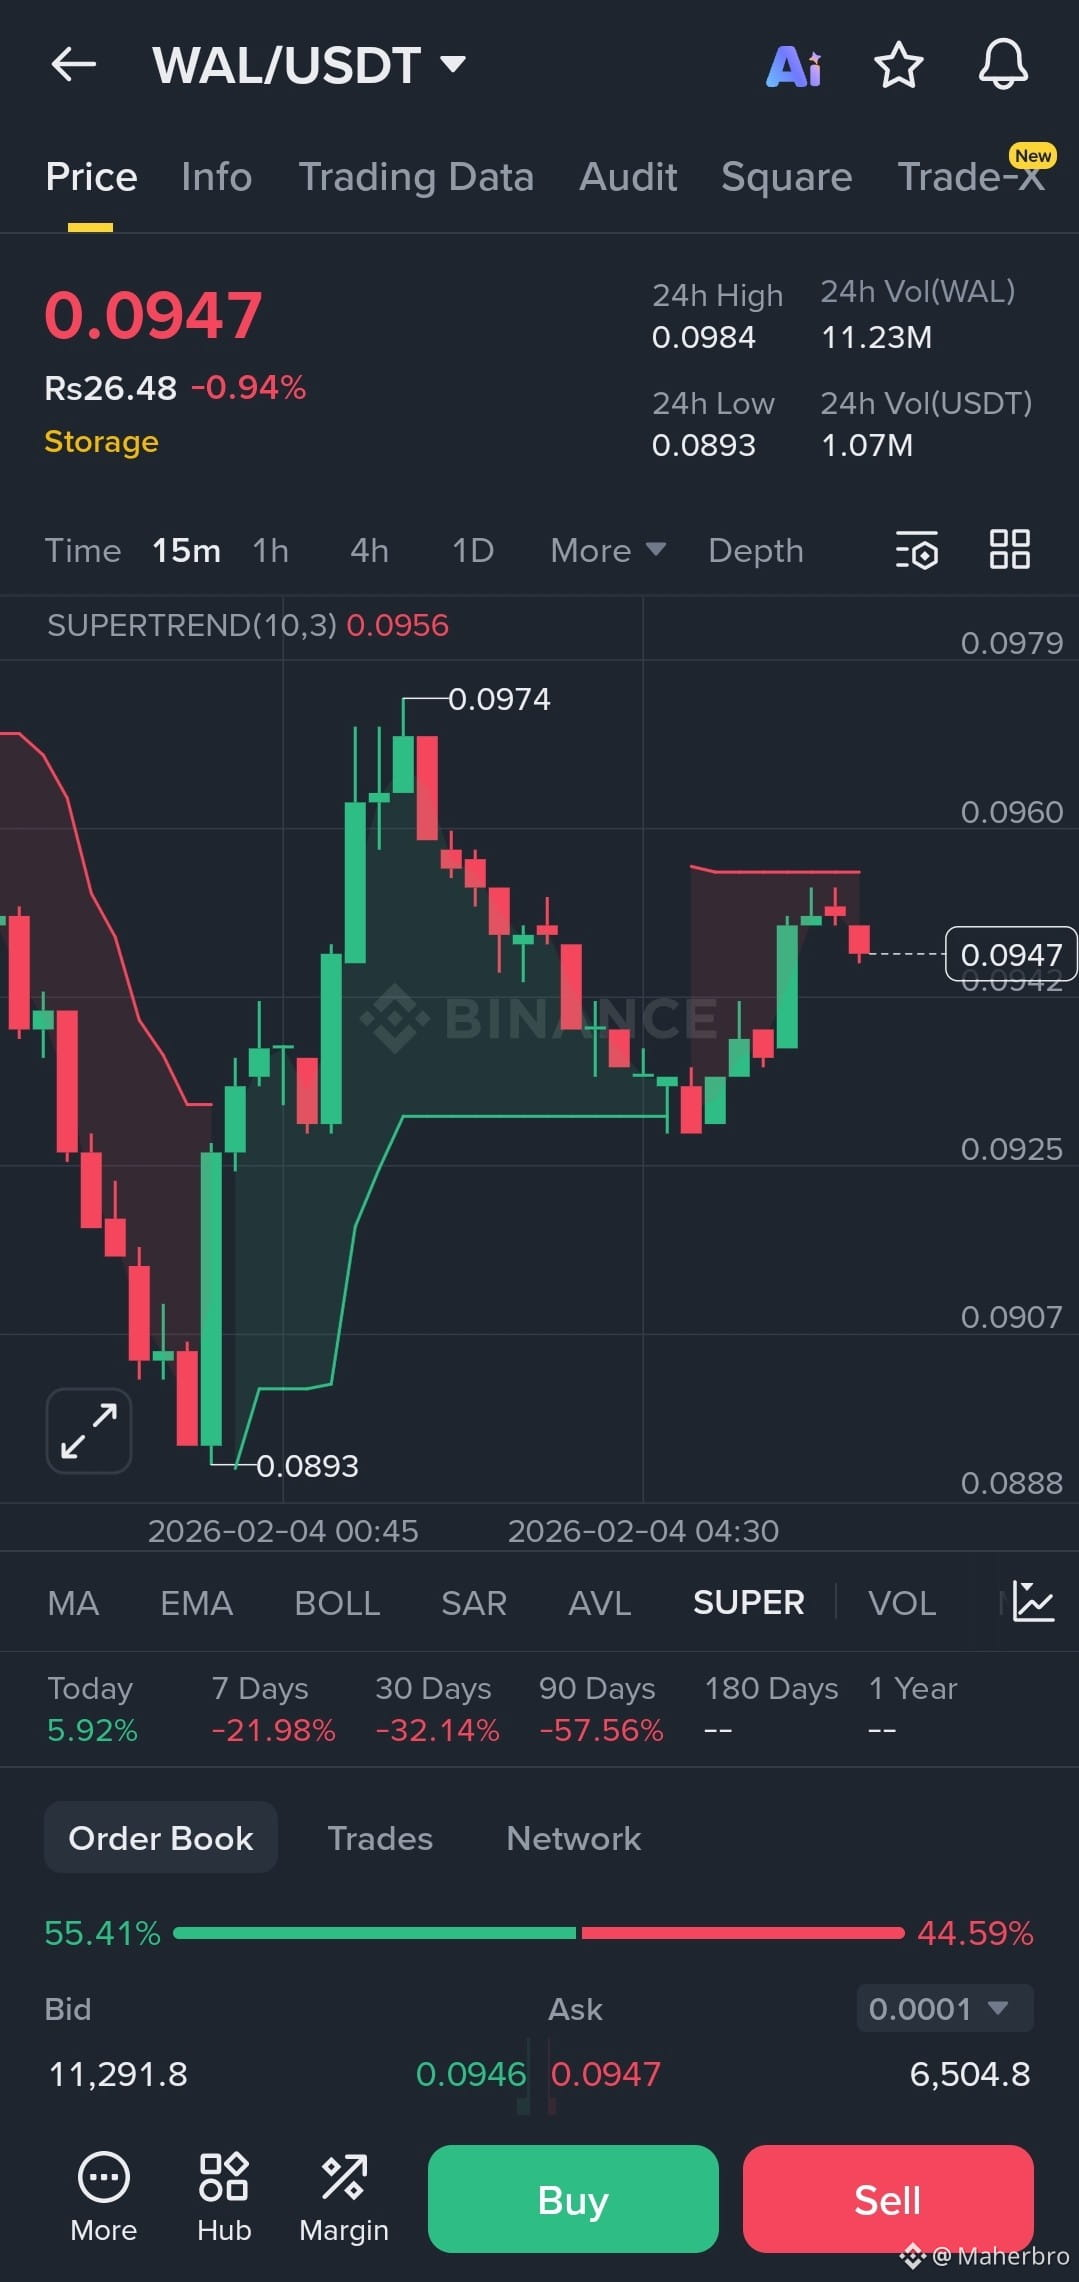
Trading Pair: WAL/USDT
Current Price: 0.0947
Timeframe: 15 minutes
Indicator Used: Supertrend (10,3)
WAL/USDT is currently moving in a consolidation phase after a sharp bounce from recent lows. The price is struggling to gain strong momentum, indicating uncertainty among traders.
Price Action Analysis
The most notable recent move was the bounce from 0.0893, which acted as a strong support zone. Buyers stepped in aggressively at this level, pushing the price upward toward 0.097–0.098.
However, after reaching near 0.0974, the price faced rejection and started moving sideways. This suggests that sellers are active near higher levels and are not allowing price to break out easily.
A higher low has formed on the chart, which is generally considered a positive sign. Higher lows often indicate that buyers are gradually gaining strength, even if the price is not yet breaking resistance.
Indicator Analysis: Supertrend (10,3)
The Supertrend indicator is currently positioned above the price, which signals that the market is still under short-term selling pressure.
When price trades below Supertrend, the trend is considered bearish.
When price moves above Supertrend, it often confirms a trend reversal or bullish continuation.
At the moment, WAL/USDT has not yet flipped the Supertrend to bullish. This means traders should wait for confirmation rather than entering trades based purely on anticipation.
Key Support and Resistance Levels
🔹 Support Zones
Primary Support: 0.089 – 0.090
Minor Support: 0.092 – 0.093
If the price drops below current levels, these zones will be critical to watch. A breakdown below 0.089 could lead to further downside.
🔹 Resistance Zones
Immediate Resistance: 0.097 – 0.098
Next Resistance: 0.101 – 0.105
The 0.098 level is the most important resistance. A strong breakout above this area with volume could trigger a bullish move.
Bullish Scenario
In a bullish case:
Price breaks above 0.098
Candle closes above resistance on the 15m timeframe
Volume increases
Supertrend flips below price
If these conditions are met, WAL/USDT could move toward the 0.101 – 0.105 range in the short term. This would confirm that buyers are back in control.
Bearish Scenario
In a bearish case:
Price fails to break 0.097 – 0.098
Rejection candles form near resistance
Selling volume increases
This could result in a pullback toward 0.092, and possibly a retest of 0.089. A clean breakdown below 0.089 would weaken the structure and could lead to further losses.
Risk Management and Trading Strategy
Due to current market uncertainty, traders should:
Avoid entering trades without confirmation
Use stop-loss orders
Manage position size carefully
Avoid FOMO during sudden price spikes
Waiting for a confirmed breakout or breakdown is safer than guessing the direction.
Conclusion
WAL/USDT is currently at a decision-making zone. The strong bounce from 0.0893 shows buyer interest, but resistance near 0.098 is still holding the price back. Until a clear breakout occurs, the market is likely to remain volatile and range-bound.