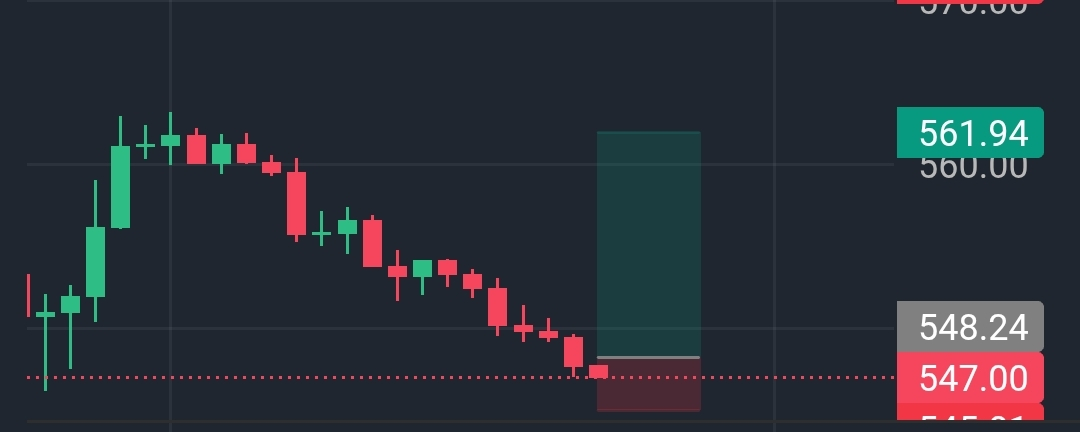

BNB is currently trading around $547, extending its short-term downtrend after a series of consecutive bearish candles. The hourly chart reflects steady selling pressure, with lower highs and lower lows confirming that bears remain in control. However, the price is now approaching an important support area where buyers may begin defending the market. The slowing pace of the decline suggests that selling momentum could be weakening, making this a key level to watch.
The $545–$547 range has become a major support zone. If buyers successfully protect this area, BNB could attempt a rebound toward $555, followed by a potential move to the $560–$562 resistance region. A confirmed breakout above this level would improve the short-term outlook and signal renewed bullish momentum. On the other hand, if support fails, the price could continue its decline before establishing a stronger base.
For traders, patience is more valuable than chasing price movements during periods of uncertainty. Waiting for confirmation through bullish candle formations, increased trading volume, and clear reactions at key support levels can improve trade quality and reduce unnecessary risk. Strong risk management, disciplined position sizing, and a structured trading plan remain essential. Whether BNB rebounds or extends its correction, staying focused on technical levels rather than emotions provides the best chance for consistent long-term trading success.