

Today we analyze the $XAU USD structure shown in the images. This setup is a clear example of Smart Money execution using liquidity sweep, market structure shift, order block entry, and continuation toward liquidity targets. If you understand this pattern deeply, you stop reacting emotionally and start trading structurally.
Higher Time Frame Bias and Context
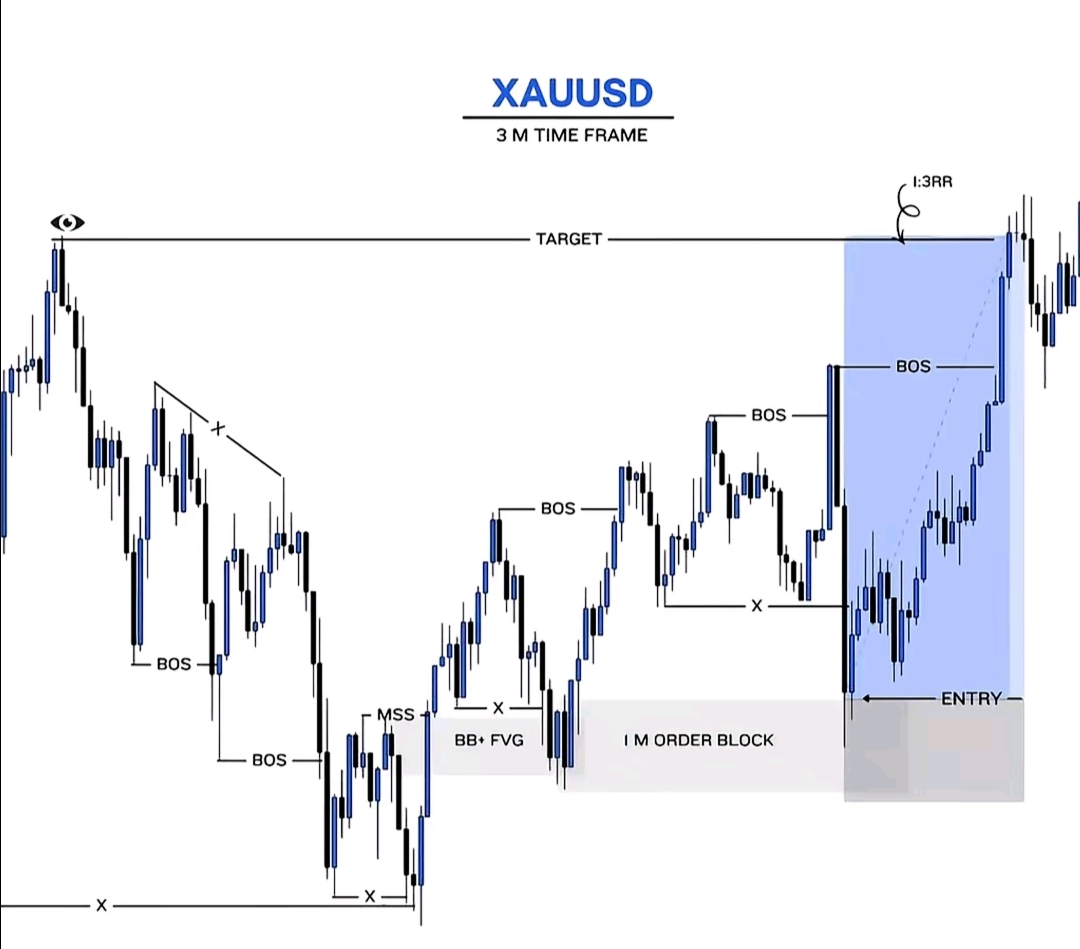
In the 3M chart, price was initially in a bearish structure making lower lows and lower highs. Multiple BOS (Break of Structure) to the downside confirmed continuation of bearish pressure. BOS means price breaks a previous swing low or high confirming trend continuation. This tells us institutions were still in control.
However, after a strong bearish leg, price formed a low and then created an MSS (Market Structure Shift). MSS is stronger than simple CHOCH because it includes displacement. Displacement means a strong impulsive candle that breaks prior structure aggressively. This is not retail movement; this is institutional participation.
The moment MSS occurred, the bearish control weakened and potential bullish reversal started forming.
Liquidity Sweep – The Real Trigger
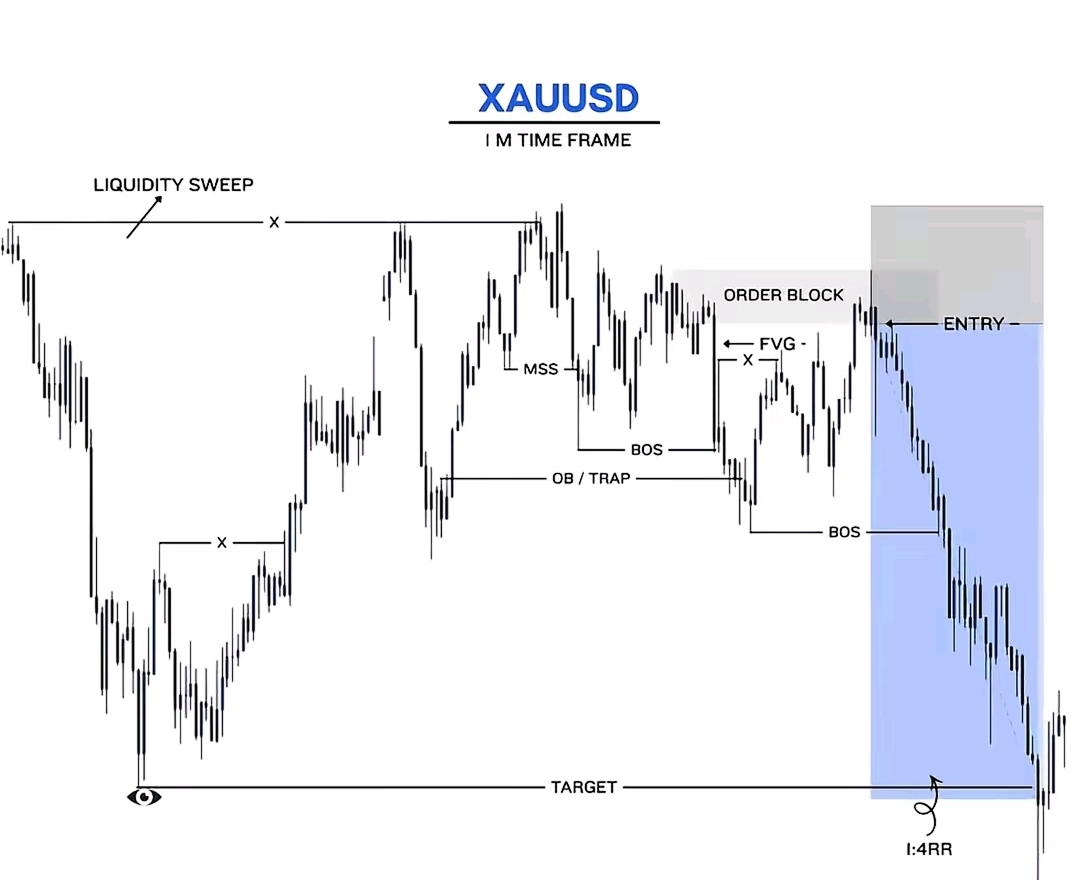
In the 1M chart, price first performed a Liquidity Sweep. Liquidity sweep happens when price moves above equal highs or below equal lows to trigger stop losses of retail traders. The eye symbol in the image marks liquidity.
Technically, liquidity is fuel for institutions. Psychologically, it traps emotional traders who enter breakout trades. After sweeping liquidity, price reverses sharply because the market no longer has pending stop orders to collect.
In the second image, price sweeps upper liquidity before moving aggressively downward toward the target.
Order Block Identification
After MSS and liquidity sweep, the key zone becomes the Order Block (OB). An Order Block is the last opposing candle before a strong displacement move. It represents the area where institutions placed heavy orders.
In the bullish example (first image), price returns to the 1M Order Block after displacement. That retest provides high-probability entry.
In the bearish example (second image), price returns to a bearish Order Block after sweeping liquidity and breaking structure. That becomes the sell entry zone.
Order Blocks are not random rectangles. They are institutional footprints.
Fair Value Gap (FVG) – Imbalance Confirmation
You can see FVG (Fair Value Gap) marked in the structure. FVG forms when price creates a strong imbalance between buyers and sellers, leaving a gap between candles.
Technically, price often returns to fill these inefficiencies. Psychologically, it reflects aggressive entry from institutions.
When FVG aligns with Order Block, probability increases significantly.
Break of Structure (BOS) Continuation
After entry, price forms additional BOS in the direction of the trade. This confirms continuation.
In the bullish setup: Liquidity sweep
MSS
Displacement
Order Block retest
Entry
BOS
Continuation to target
In the bearish setup: Liquidity sweep
MSS
Displacement
Order Block retest
Entry
BOS
Continuation to lower liquidity
BOS confirms you are aligned with institutional flow.
Entry and Risk Management
The entry in both setups is taken after confirmation, not before.
In the bullish case: Entry is placed at the Order Block retest. Stop loss is below the Order Block. Target is previous high liquidity.
In the bearish case: Entry is placed at bearish Order Block retest. Stop loss is above the Order Block. Target is previous low liquidity.
The blue shaded area shows reward. The red shaded area shows risk. The setup shows clear Risk-to-Reward Ratio (RRR) of approximately 1:3 or 1:4.
This is professional execution. Defined risk. Logical target. Structural confirmation.
Psychological Edge of This Pattern
Most traders lose because they: Chase candles
Trade without structure
Enter before confirmation
Ignore liquidity
This model forces patience.
You wait for: Liquidity sweep
Structure shift
Displacement
Retest
Confirmation
This removes emotional entries.
Fear disappears because risk is predefined. Greed disappears because target is structural.
Technical Flow Summary
For bullish XAUUSD: Bearish structure
Liquidity sweep of lows
MSS to upside
Strong displacement
Order Block formation
Retest of Order Block
Entry
BOS confirmation
Target at previous highs
For bearish XAUUSD: Bullish structure
Liquidity sweep of highs
MSS to downside
Strong displacement
Bearish Order Block
Retest
Entry
BOS confirmation
Target at previous lows
This is structured institutional trading.
Why This Pattern Works on Gold (XAUUSD)
Gold is highly liquid and heavily influenced by institutional players. Because of high liquidity, Smart Money Concepts work effectively on XAUUSD.
Institutions move gold using liquidity hunts and structured displacement. Retail traders react emotionally to news. Institutions position before news.
If you follow structure instead of headlines, your probability improves.
Final Perspective
This XAUUSD pattern is not about indicators. It is about understanding liquidity, structure, and institutional intent.
Liquidity provides fuel.
MSS shows shift.
Order Block provides entry.
BOS confirms continuation.
Target is liquidity.
Master this sequence and your trading becomes systematic.
Watch the market closely. Structure always tells the story before the move happens.