The crypto market is currently a battlefield of emotions. With the Crypto Fear & Greed Index hitting 13, we are deep in Extreme Fear territory. While the panic is palpable, experienced traders know that these are the moments where the most significant opportunities—or the most painful lessons—are born.
Today, we dive into the FOGO/USDT 1H chart to see if this asset can reignite its flame or if we are looking at a further cool-down.
1. The Moving Average Gauntlet
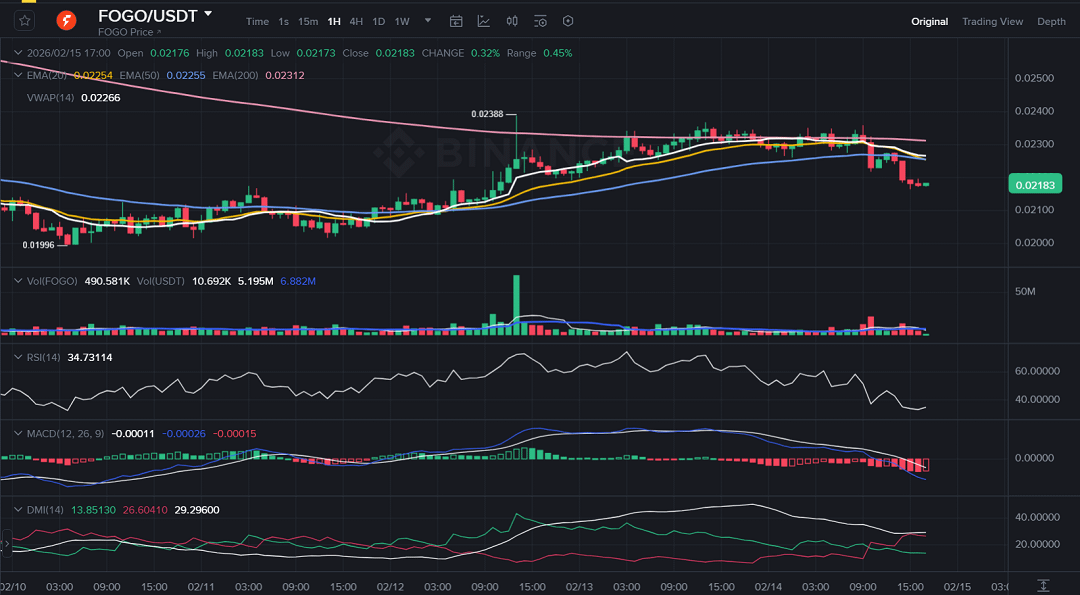
The technical structure on the 1H timeframe is currently a challenge for bulls. FOGO is trading at $0.02183, positioned well below our key dynamic resistances:
The EMA Resistance: The price is trading under the EMA 20 (Yellow - $0.02254) and the EMA 50 (Light Blue - $0.02255). The fact that these two are so close together creates a "hard ceiling" that FOGO must break to regain any short-term momentum.
The Long-Term Trend: We have also slipped below the EMA 200 (Pink - $0.02312). In technical terms, staying below the pink line suggests the path of least resistance remains to the downside.
VWAP (White - $0.02266): Being below the VWAP confirms that the intraday selling pressure is dominant.
2. Momentum Indicators: Oversold, but not Divergent
When we look at the oscillators, we see a market that is exhausted but still under pressure:
RSI (White): Currently sitting at 34.73. We are hovering just above the oversold boundary (30). While this suggests a "relief bounce" is statistically overdue, the RSI hasn't formed a "higher low" yet to confirm a reversal.
MACD Analysis: The DIF (Blue) is sliding below the DEA (White). The red histogram bars are expanding, showing that the bearish momentum actually gained strength in the last few hours. We need to see these bars begin to shrink (fade to light red) before eyeing a potential entry.
3. The Macro Culprit: Why the Shock?
This drop isn't happening in a vacuum. The #RiskAssetsMarketShock is a direct result of the #WarshFedPolicyOutlook . The market is pricing in a more hawkish Federal Reserve, which naturally drains liquidity from high-growth assets like FOGO. With the Fear Index at 13, we are seeing a "de-risking" event where investors are fleeing to cash until the dust settles.
4. The DMI & Volume Verdict
The DMI shows a clear picture: The +DI (Green) is languishing at 13.85, while the bearish indicator is dominant.
Volume Check: We saw a significant spike in volume (MAVOL lines) during the initial drop, which suggests a high-conviction sell-off. For a reversal, we need to see a similar "buying spike" that pushes the price back above the EMA 20 (Yellow).
The Strategy: What’s Next?
Bearish Scenario: If FOGO fails to hold the $0.02100 psychological support, we could see a quick slide toward the $0.0199 zone.
Bullish Scenario: A confirmed close above $0.02260 (VWAP) would be the first sign of life. This would likely trigger a "short squeeze" back toward the EMA 200 (Pink) at $0.02312.
Final Thought: Trading in a Fear Index 13 environment requires iron discipline. Don't chase the candles. Wait for the MACD to cross or for the price to flip the Yellow EMA into support.
What is your move during this "Extreme Fear" phase? Are you accumulating FOGO at these levels, or are you waiting for a confirmed breakout above the EMA 20? Let me know your strategy in the comments! 👇
This content is for informational purposes only and does not constitute financial advice. Crypto assets are highly volatile. Always conduct your own research (DYOR) and manage your risk responsibly before making any investment decisions.