Hey crypto fam, Mr Curious 👑 here kicking off a new educational series on technical analysis (TA) tools that can help you navigate the wild rides of 2026 markets. With BTC swinging from highs near $90K to recent dips around $78K amid Fed uncertainty and alt rotations, volatility is the name of the game. Today, we're diving into three powerhouse indicators: RSI Divergences, MACD Crosses, and Bollinger Bands. This is a pure step-by-step guide with real February 2026 examples from BTC's chart—because nothing beats actionable insights with fresh data. I'll break it down simply for beginners, add pro tips for traders, and include spots for chart screenshots to make it visual. Let's level up your trading game—no fluff, just value. 🚀
1. The Basics of TA in Volatile Markets
Before we jump in, quick context: Technical analysis uses price history, volume, and patterns to predict future moves. In volatile times like now (Crypto Fear & Greed Index at "Fear" levels in early Feb), indicators help spot overbought/oversold conditions, momentum shifts, and potential breakouts. We'll use BTC as our example since it's the market leader—its recent pullback from $89K (Jan 31) to $78K (Feb 5) amid ETF outflows is a perfect case study.
Key rule:
No indicator is foolproof.
Always combine with fundamentals, risk management (e.g., stop-losses at 5-10% below entry), and multiple timeframes (daily for swings, 4H for entries).
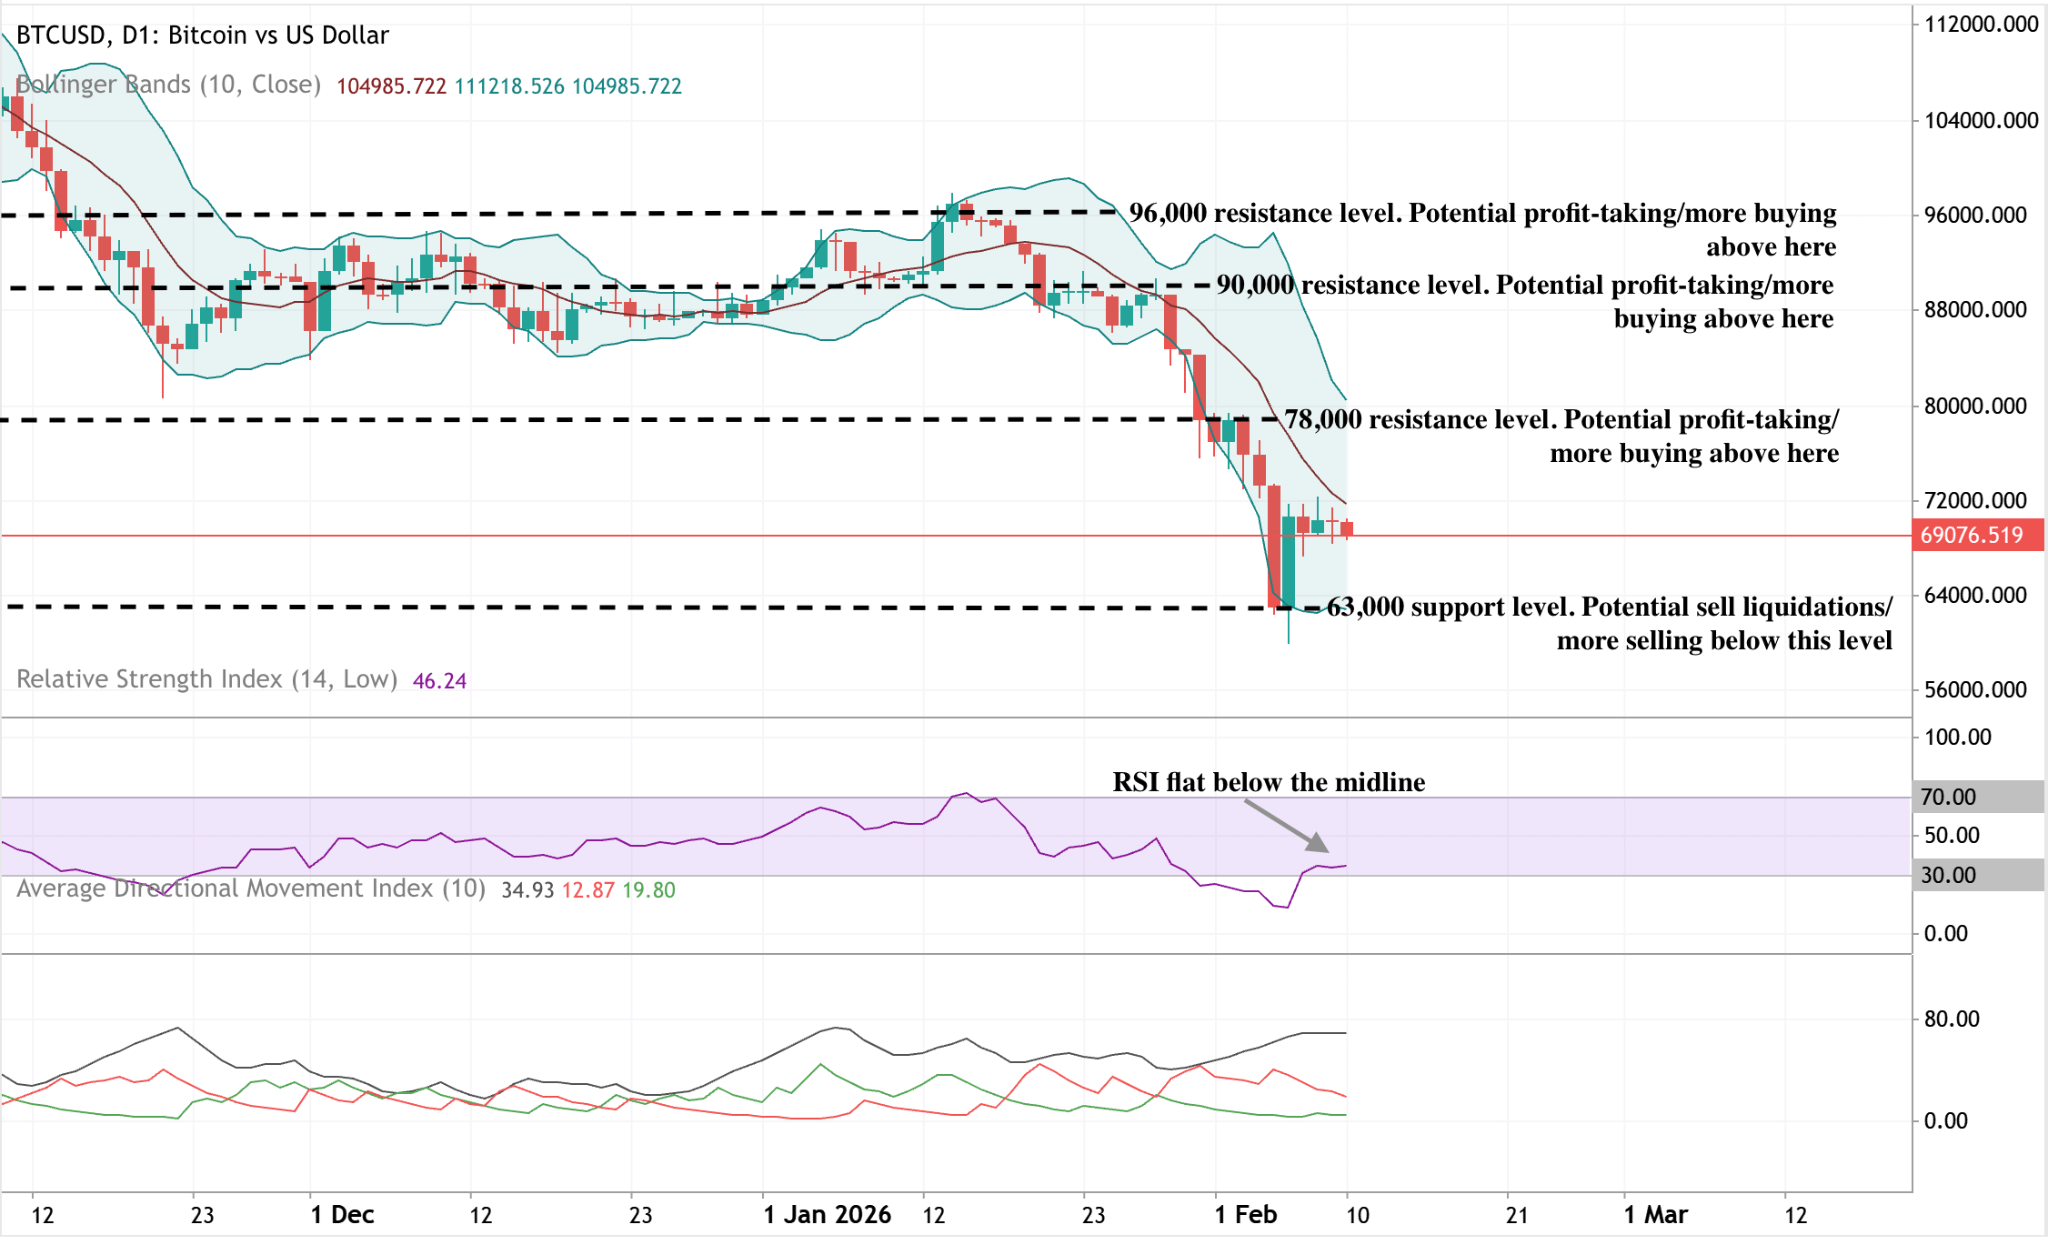
2. RSI Divergences – Spotting Exhaustion and Reversals
What is RSI?
The Relative Strength Index (RSI) measures momentum on a 0-100 scale. Above 70 = overbought (potential sell), below 30 = oversold (potential buy). But the real magic is in *divergences*: When price makes a new low but RSI makes a higher low (bullish divergence) or vice versa (bearish).
Step-by-Step Guide:
Calculate RSI (default 14 periods): Tracks average gains vs. losses.
Scan for extremes: RSI <30 signals oversold—buyers may step in.
Hunt divergences: Compare price highs/lows to RSI highs/lows.
Confirm with volume or other indicators.
Real 2026 Example: BTC's Oversold RSI Rebound
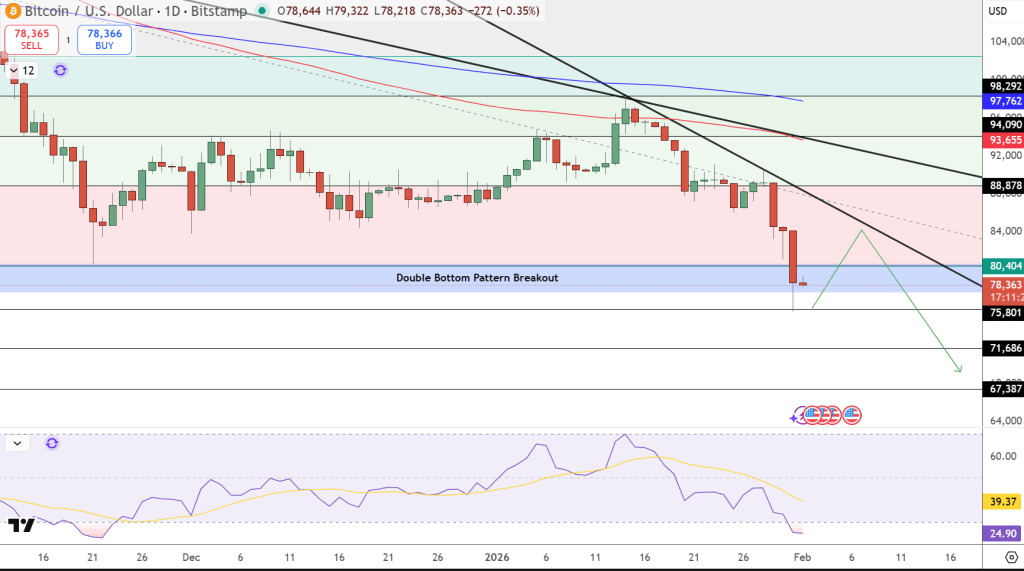
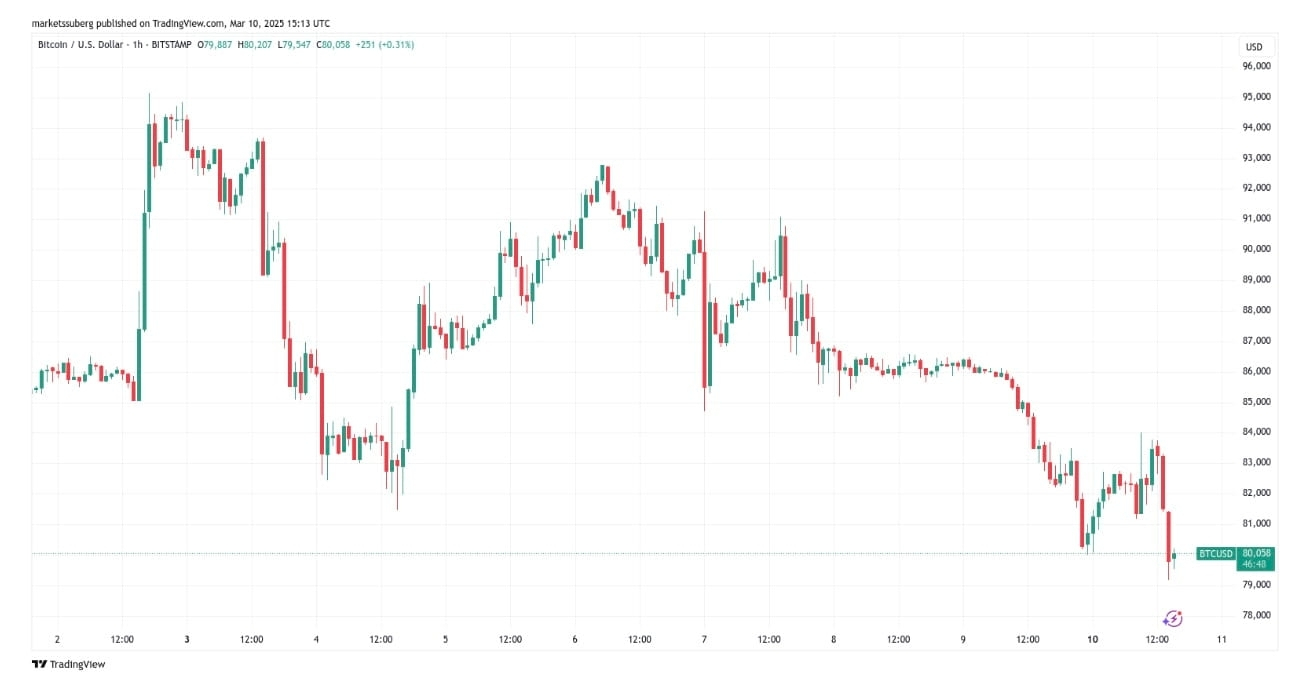
In early February 2026, BTC dipped to ~$78,000 (Feb 5 low), with RSI plunging to 25 (deep oversold). But notice the bullish divergence: While price hit a lower low than Jan 28's $82K, RSI formed a higher low (25 vs. previous 22). This hinted at weakening sellers—sure enough, BTC rebounded to $85K by Feb 12. Traders who bought the dip with a tight stop below $77K caught a quick 9% gain.
Pro Tip:
In volatiles like now, wait for RSI to cross back above 30 for confirmation. Avoid solo use—pair with support levels (BTC's $78K was a key Fib retracement).
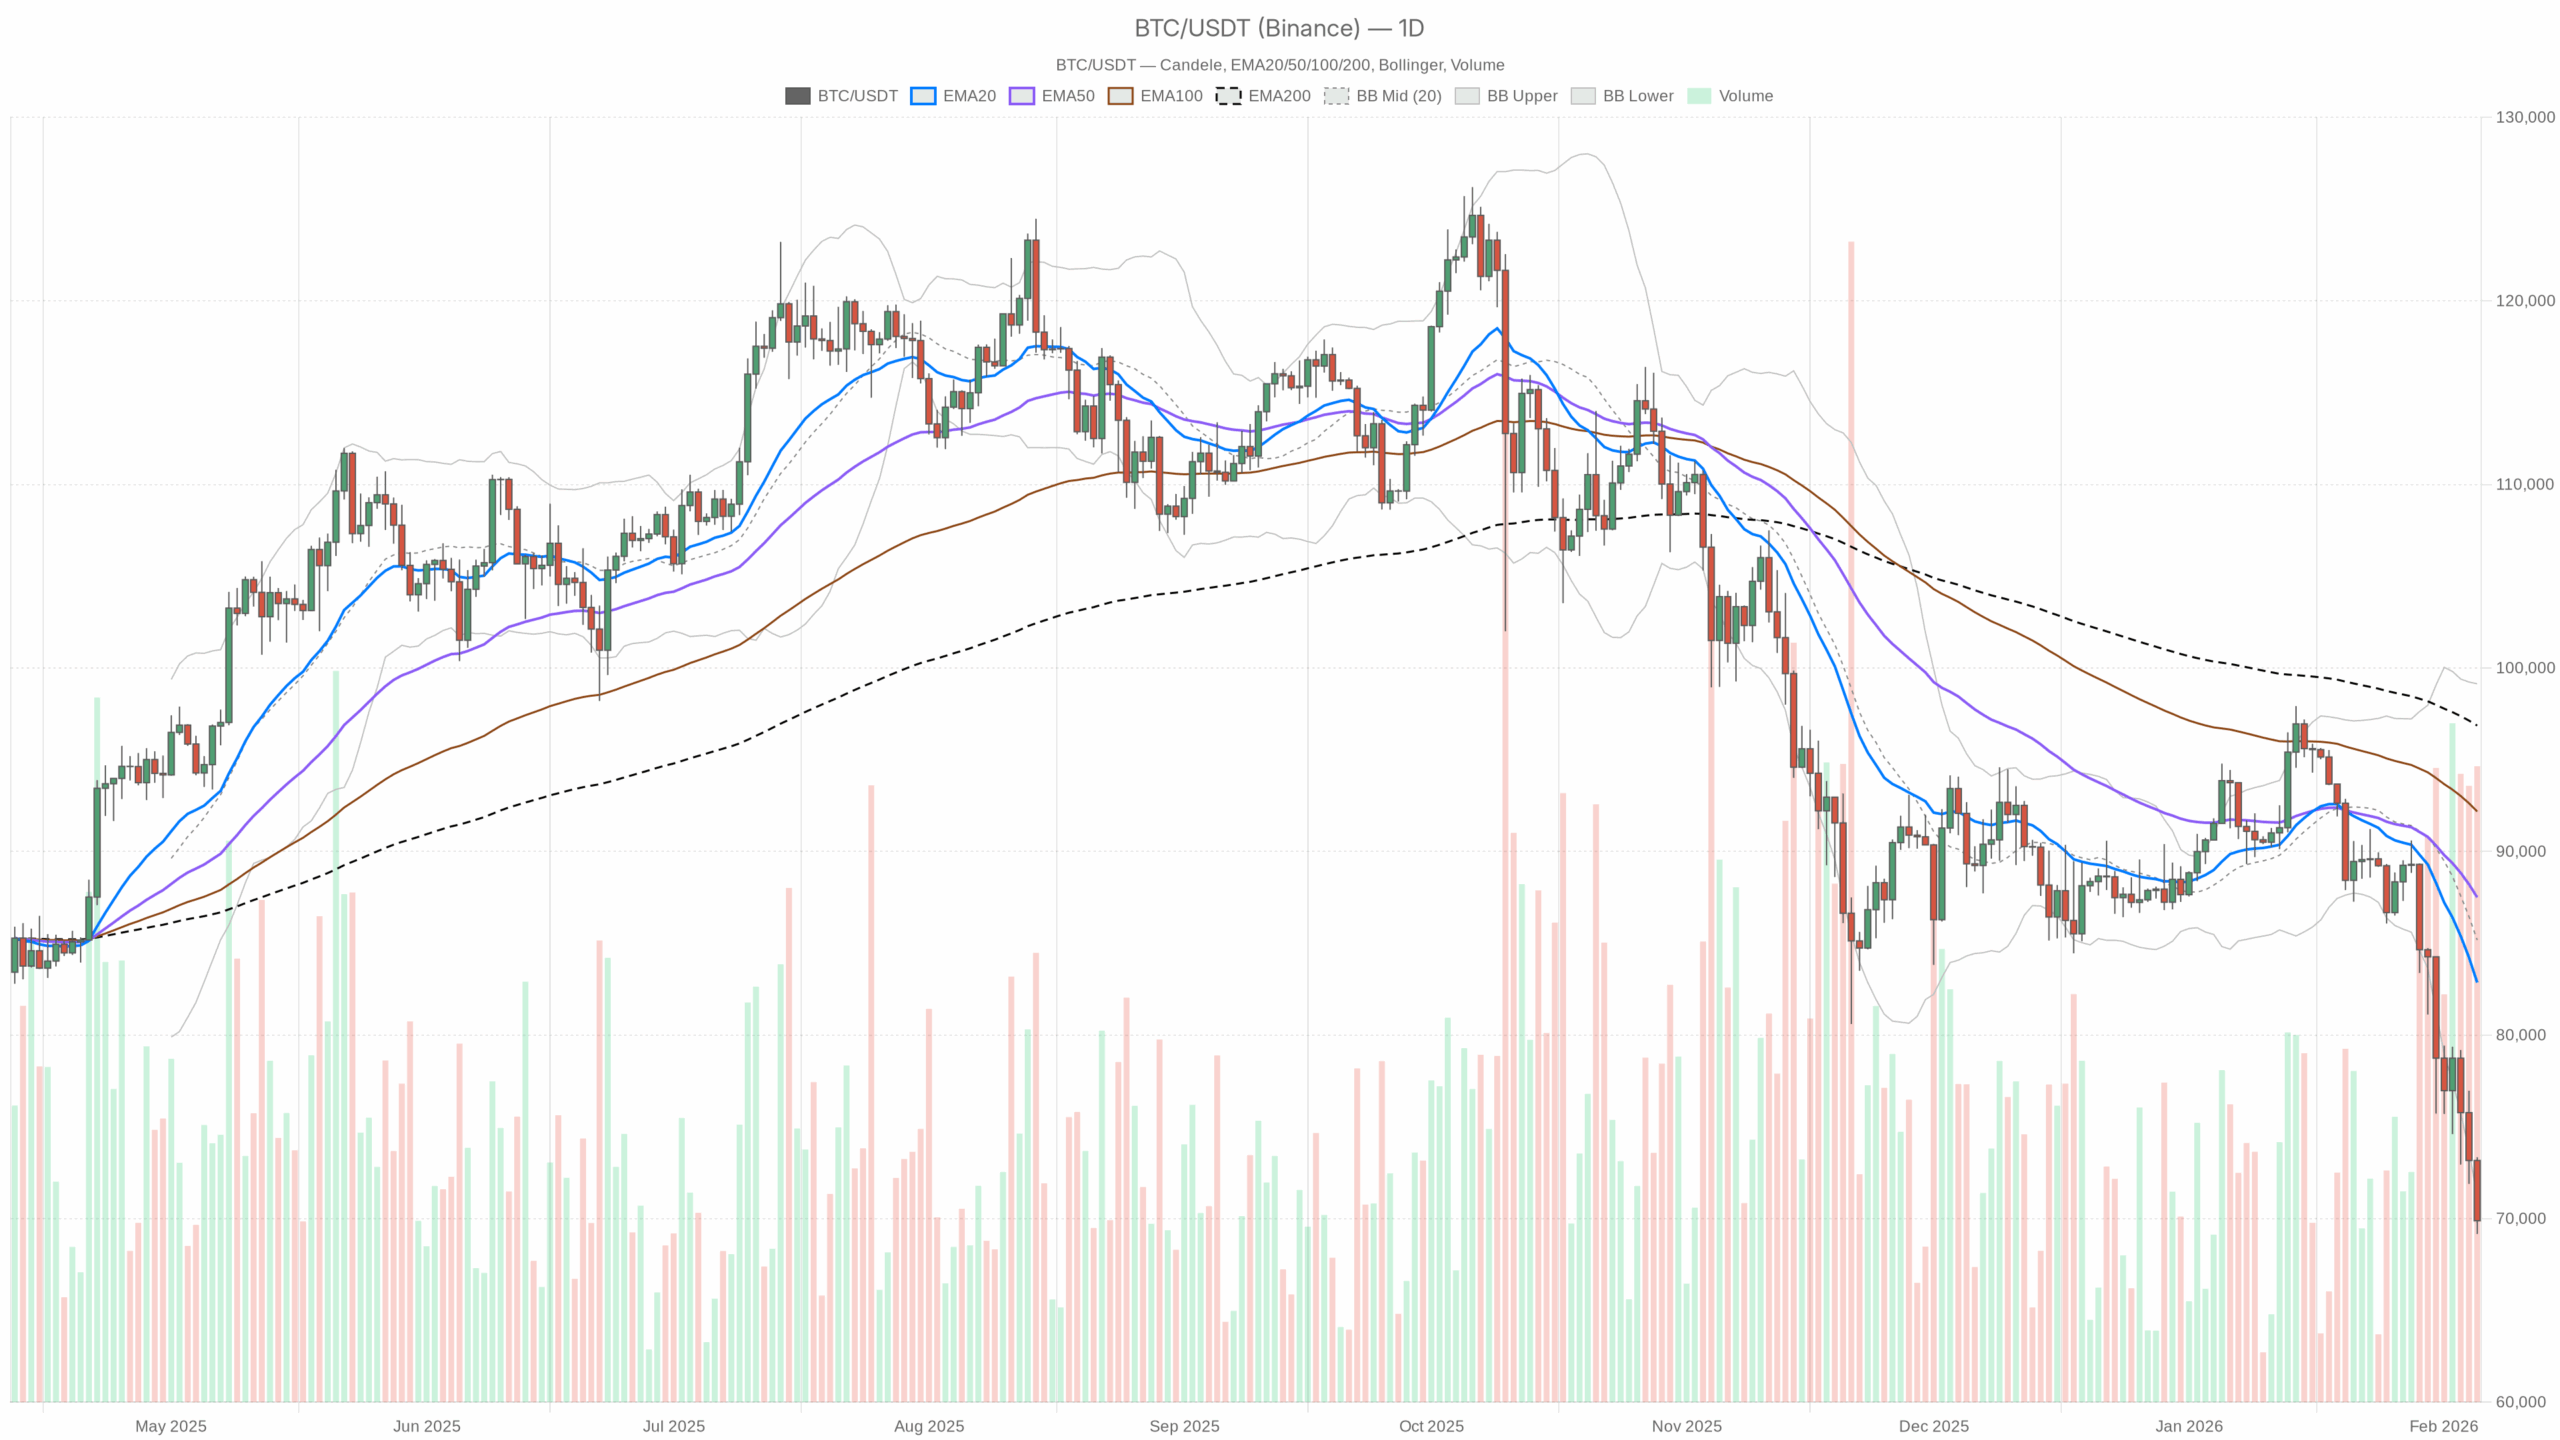
3. MACD Crosses – Catching Momentum Shifts
What is MACD?
Moving Average Convergence Divergence tracks the relationship between two EMAs (12 and 26 periods). It has a histogram, MACD line, and signal line. Crosses signal buy/sell: MACD above signal = bullish momentum, below = bearish.
Step-by-Step Guide:
Plot MACD: Subtract 26-EMA from 12-EMA (MACD line), then add 9-EMA signal.
Watch crosses: Bullish when MACD crosses up over signal; bearish down.
Check histogram: Growing bars confirm strength.
Use in trends: Best in ranging or early trend reversals.
Real 2026 Example: BTC's Bearish MACD Cross
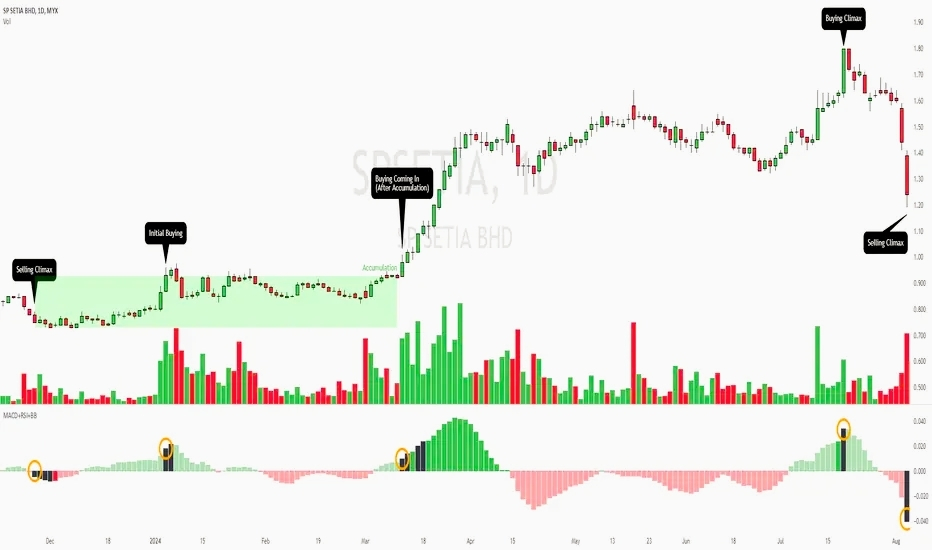
Mid-Jan 2026, BTC rallied to $89K with a bullish MACD cross (Jan 20: MACD up over signal, histogram expanding). But on Feb 10, a bearish cross happened at $82K—MACD dipped below signal amid shrinking histogram. This foreshadowed the drop to $78K. Smart traders shorted or exited longs here, avoiding a 5% loss.
Pro Tip:
In high vol, false crosses happen—filter with volume (look for spikes on real moves). For BTC now, watch for a bullish cross above zero line for $90K+ targets.
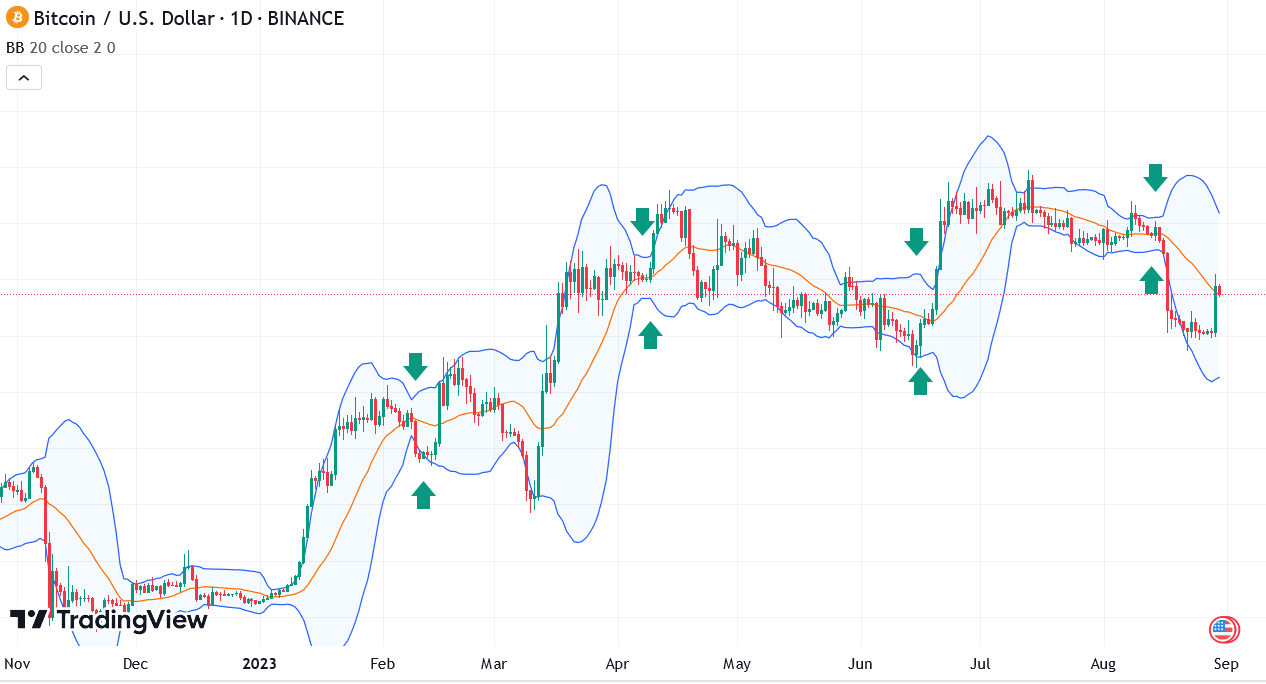
4. Bollinger Bands – Trading Volatility Squeezes and Breakouts
What are Bollinger Bands?
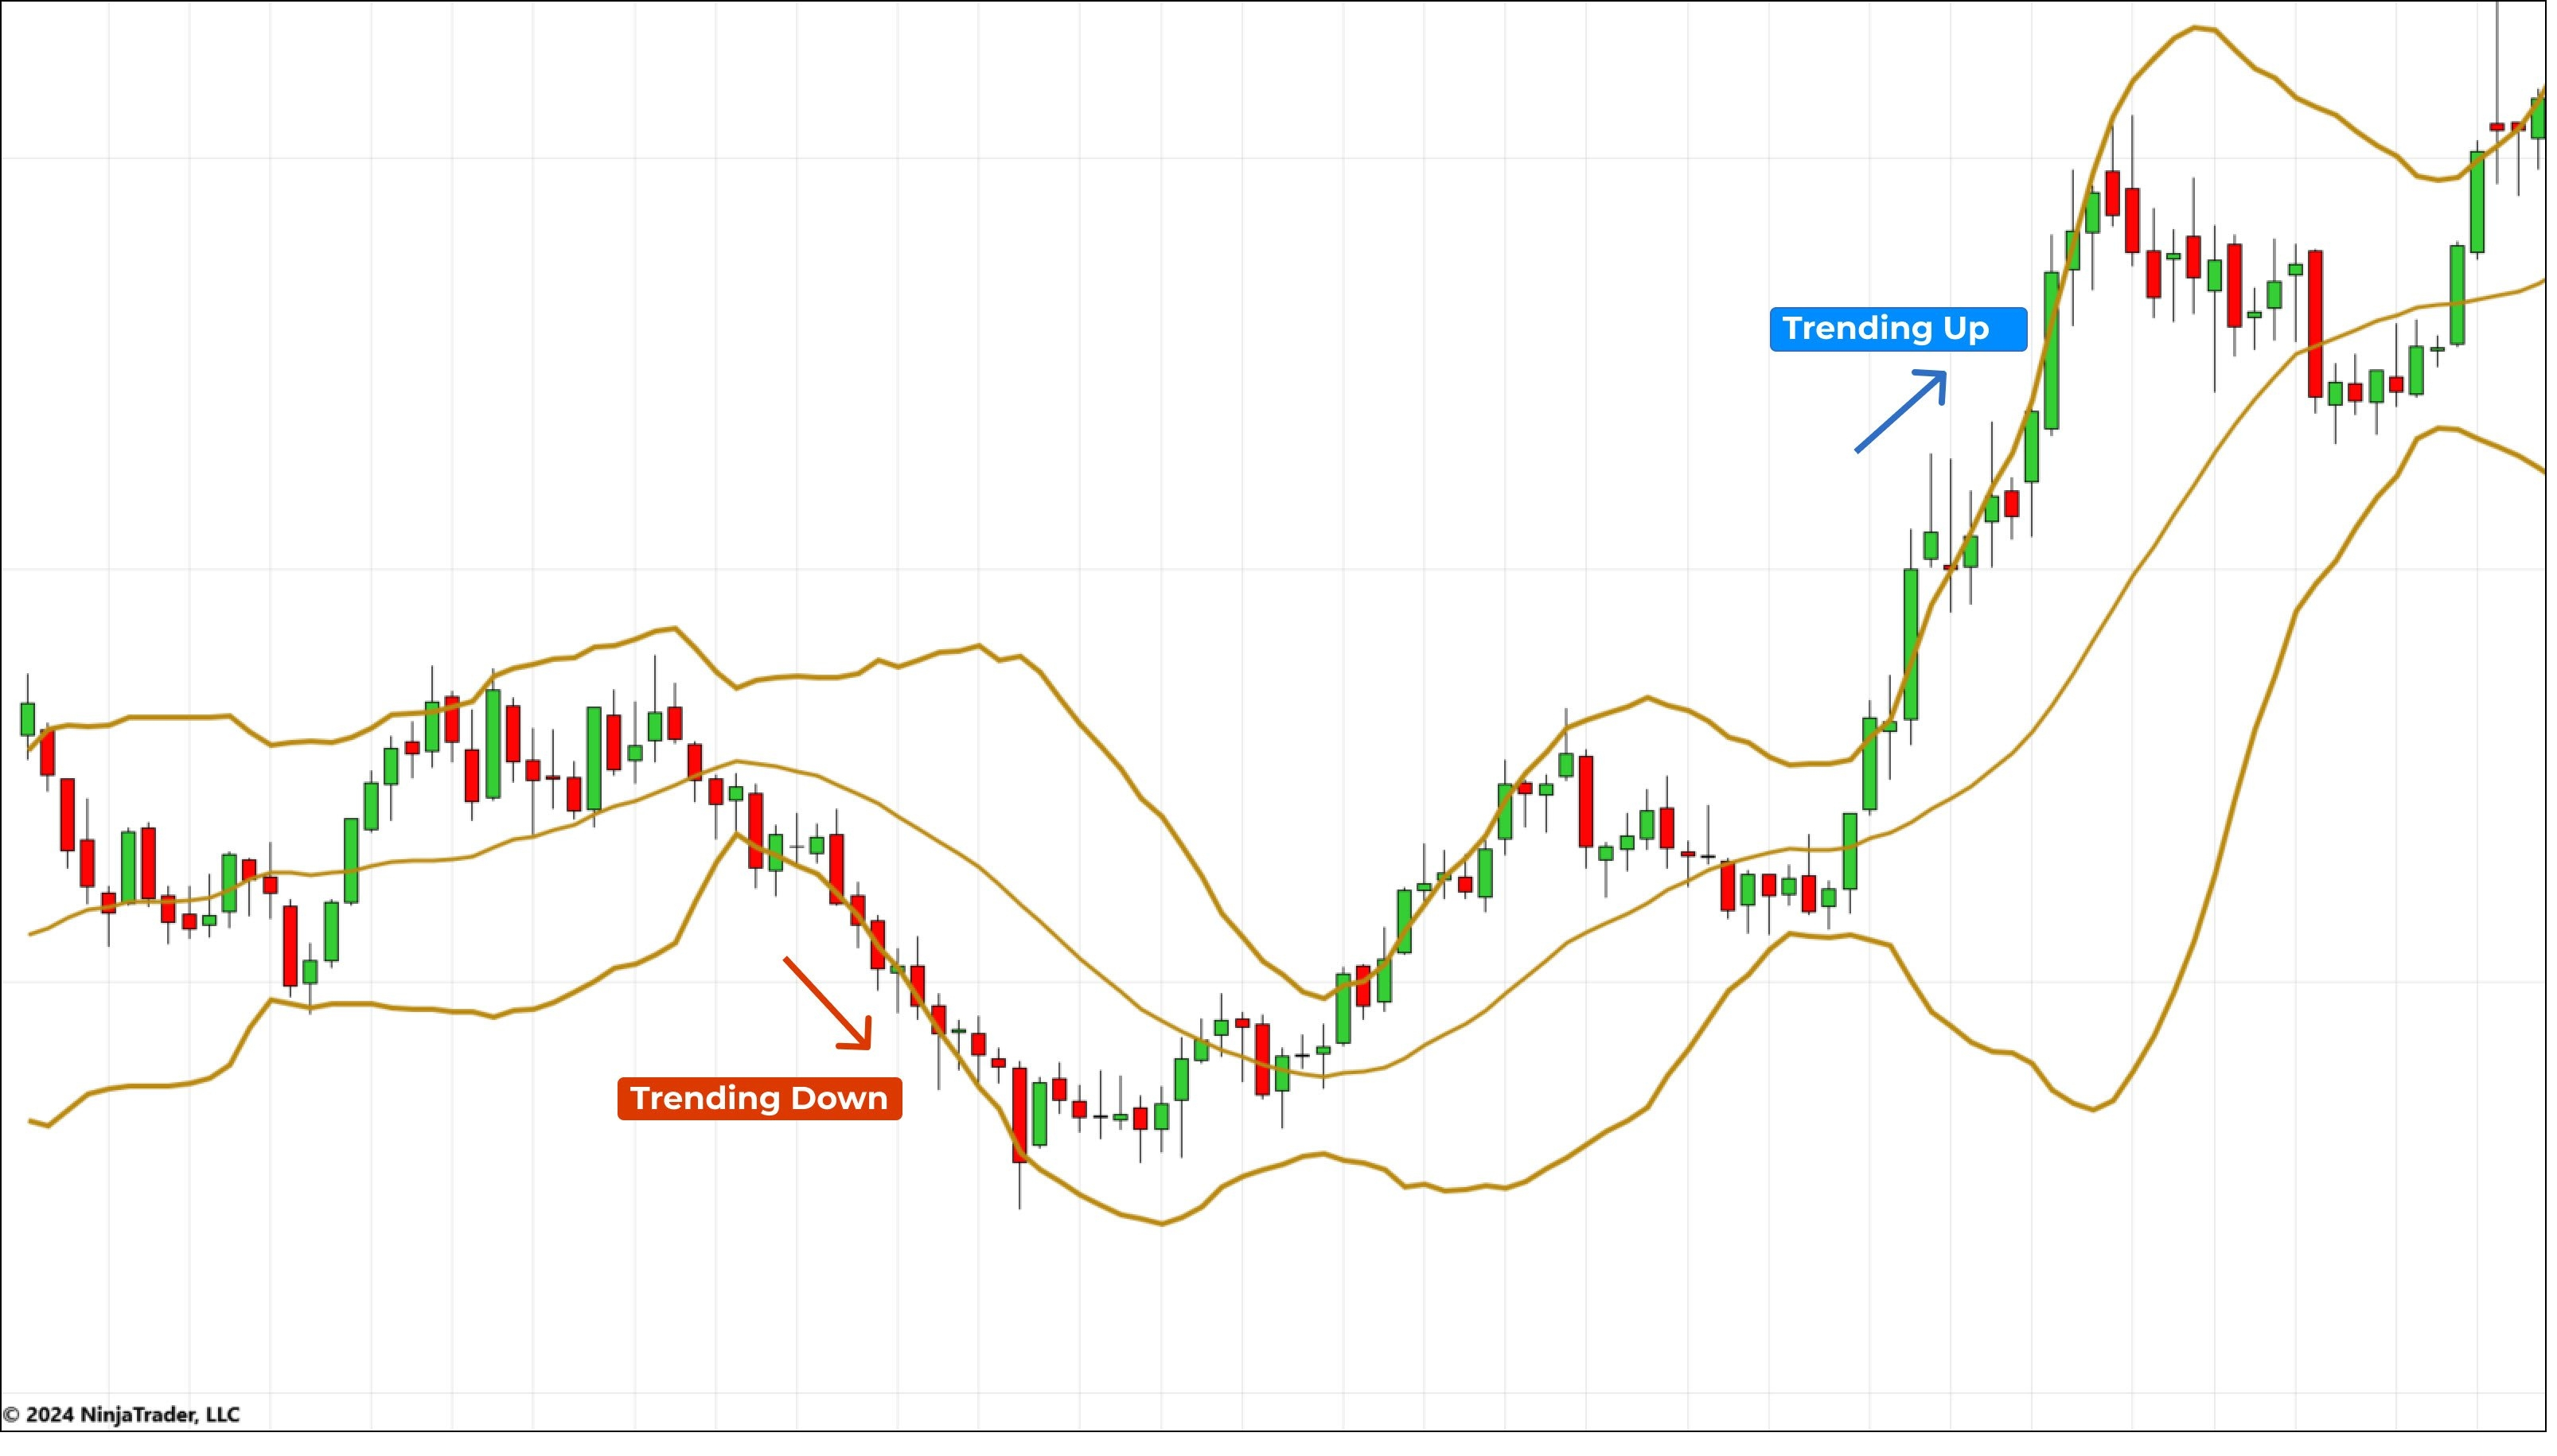
Three lines: Middle (20-period SMA), Upper/Lower (2 std devs from middle). Bands widen in vol, contract in calm— "squeezes" often precede big moves.
Step-by-Step Guide:
Plot bands: Use default 20/2 settings.
Spot squeezes: When bands tighten (bandwidth <4% of middle), expect expansion.
Trade breakouts: Price close above upper = buy; below lower = sell.
Walk the bands: In trends, price "walks" the upper/lower—ride until reversal.
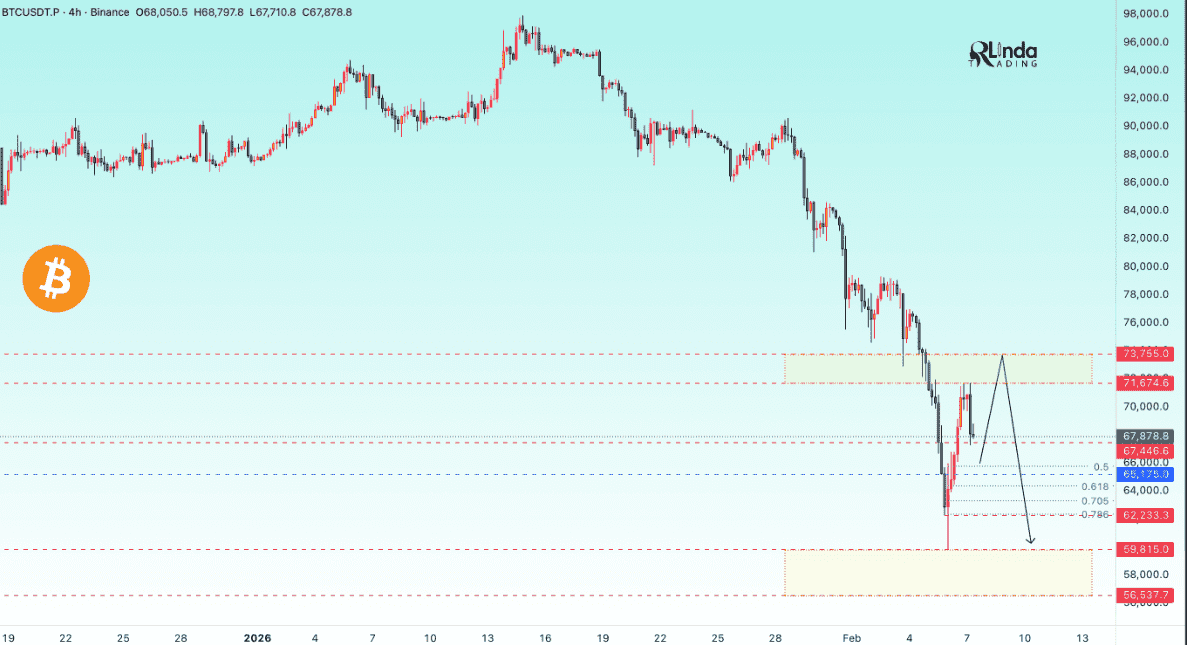
Real 2026 Example: BTC's Bollinger Squeeze Breakout
Late Jan 2026, BTC's bands squeezed tight (bandwidth ~3.2% at $85K), signaling low vol after a range. On Feb 3, price broke below the lower band to $80K, confirming downside expansion—leading to the $78K low. Now (Feb 13), bands are widening again; a close above upper (~$87K) could spark a rally.
Pro Tip:
Combine with RSI/MACD for confirmation (e.g., squeeze + oversold RSI = strong buy). In 2026's macro uncertainty, use on higher timeframes to avoid whipsaws.
Pros/Cons and Putting It All Together
Pros:
These indicators are free on platforms like TradingView.
Work across assets (try on ETH or SOL).
Provide objective signals.
Cons:
Lagging in fast markets.
Over-reliance leads to losses—always backtest (e.g., BTC's 2025 data shows 65% win rate on RSI <30 buys).
Combo Strategy:
Look for confluence, like BTC's Feb oversold RSI + bullish MACD cross + Bollinger lower touch = high-prob buy.
This is just the starter—next up, advanced combos like Fibonacci + Volume. Apply these to your charts today and backtest on historical 2026 dips for confidence.


