The crypto market never sleeps, and today, ATM (Atletico De Madrid Fan Token) has officially woken up the bulls! If you’ve been watching the charts on Binance, you’ve witnessed a textbook "accumulation to breakout" transition that has sent the price soaring by over 42.86% in a matter of hours.
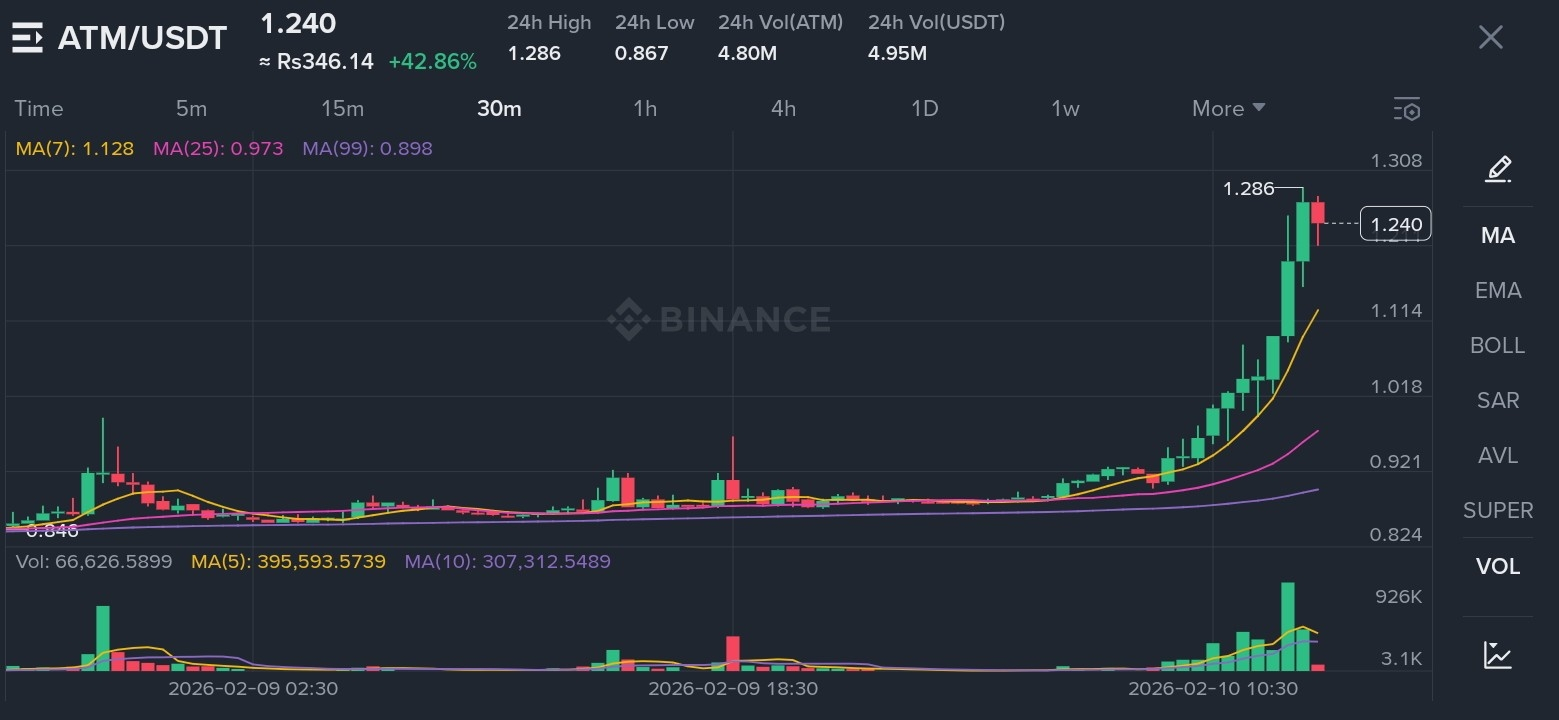
Currently trading at $1.240, ATM/USDT has moved from a period of extreme compression into a high-velocity vertical expansion. Let’s dive deep into the technicals of this chart to understand the "why" behind the move and what could happen next. 📈💹
🔍 The Anatomy of the Breakout
Looking at the 30-minute timeframe, the story of this pump is written in the candles. For the better part of the last 24 hours, $ATM was hugging a tight range between $0.867 and $0.921. This phase is what traders call "The Quiet Zone" or accumulation. During this time, the Moving Averages (MA) were tightly coiled, acting as a spring being compressed.
Once the price cleared the $1.00 psychological barrier, the floodgates opened. 🌊
📊 Technical Indicator Analysis
Moving Averages (The Golden Alignment): We see a perfect bullish fan-out. The MA(7) (Yellow line at 1.128) is leading the charge, positioned well above the MA(25) (Purple) and MA(99) (Violet). When the short-term average creates such a wide gap from the long-term averages, it signals immense momentum. However, keep an eye on that gap—mathematically, prices eventually like to "revert to the mean."
Volume Explosion: The volume bars at the bottom of the chart tell the real story. Notice the massive green spikes coinciding with the price jump. High volume on an uptrend confirms that this isn't just a "fake-out" driven by a few bots, but a genuine influx of capital and buyer interest. The 24h Volume sits at a healthy 4.95M USDT. 💰📊
Price Action & Resistance: The token hit a 24h high of $1.286 before seeing a tiny bit of red in the most recent candle. This is natural profit-taking. The bulls are now fighting to flip the $1.20 level into solid support.
🏃♂️ Momentum: FOMO or Fundamental?
In the world of Fan Tokens, volatility is the name of the game. A +42% move in a single day catches the eyes of "scalpers" and "momentum traders." While the RSI (not shown but implied by the steep angle) is likely in overbought territory, the sheer strength of the trend suggests that dips are being bought up aggressively. 🐂✨
The "step-ladder" formation of the green candles indicates a healthy trend where buyers are stepping in at every micro-pullback. This isn't just a straight line up; it's a structural climb.
⚠️ Risk Management & Strategy
As exciting as these "God Candles" look, professional trading requires a cool head. Here is the outlook:
The Bull Case: If ATM can consolidate above $1.20, the next leg could target the $1.45 - $1.50 zone. The momentum is clearly with the buyers.
The Bear Case: If the price falls back below the MA(7) ($1.12), we might see a deeper correction toward the MA(25) near $0.97.
Pro Tip: Never "market buy" at the very top of a vertical wick. Wait for a retest of the 7-period moving average to find a safer entry point. 🛡️💡
🏁 Final Thoughts
The ATM/USDT pair has provided a masterclass in how volatility returns to a stagnant asset. Whether this is driven by upcoming sports news or a technical rotation into the Fan Token sector, the charts don't lie: Volatility is back.
Stay sharp, set your stop-losses, and enjoy the ride! 🎢💎
#ATM #CryptoTrading #Binance #TechnicalAnalysis #Altcoins