
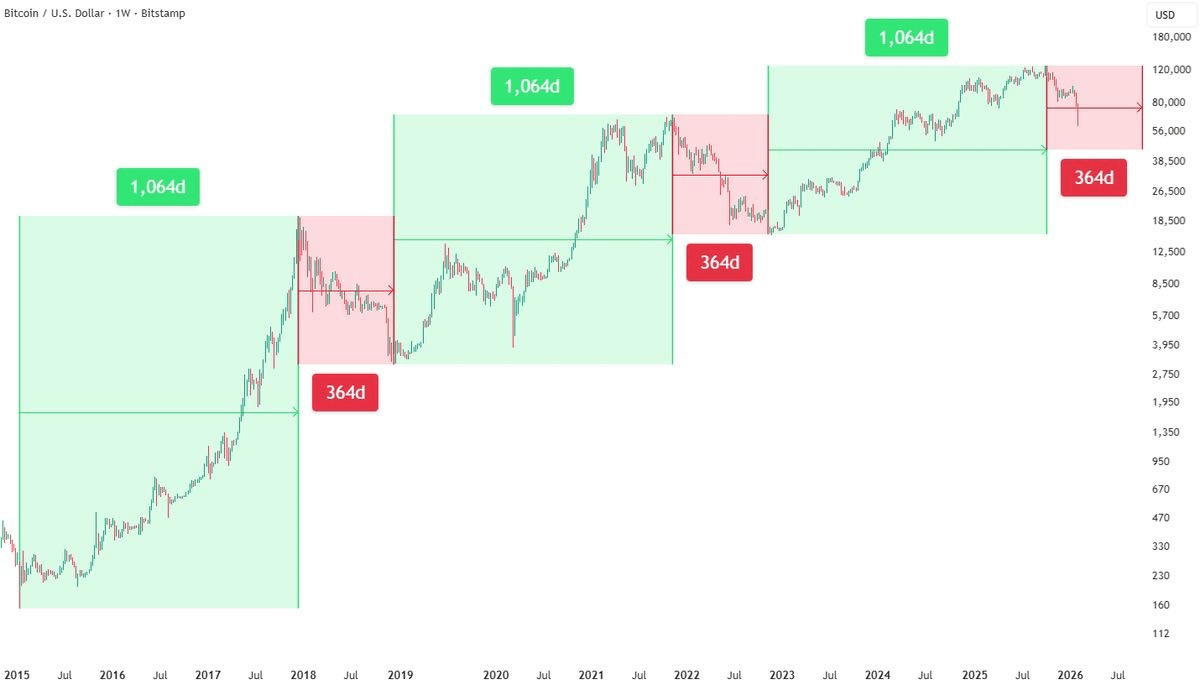
When viewed from a long-term perspective, $BTC price action reveals a recurring macro structure. Across the last three major cycles, BTC has followed a relatively consistent time-based rhythm:
Approximately 1,064 days of expansion
Followed by roughly 364 days of compression and correction
This behavior suggests more than random volatility. During each expansion phase, price advanced as liquidity, adoption, and market expectations aligned. These phases were typically followed by a contained reset period, serving as a structural cooldown rather than an extended macro downturn.
What stands out is the symmetry of this pattern. The current cycle continues to track closely with the historical tempo. Since the most recent cycle low, price action has remained within the broader expansion range, while recent pullbacks resemble prior mid-cycle consolidations rather than signals of a macro top.
Historically, the most aggressive upside moves have tended to occur later in the expansion phase, rather than during early or mid-cycle corrections.
In this context, time-based structure continues to exert more influence over market behavior than short-term narratives. While headlines change, the underlying cycle structure has shown a tendency to repeat.
If the 1,064-day rhythm remains intact, current price action appears consistent with an ongoing expansion phase rather than the conclusion of the cycle.
