
币圈周帮主
964 Posts

币圈周帮主
Report
Block User
公众号:加密夏森,邀请码注册,可享受免费指导,反手续费。邀请码:BN2025888
5 Following
18.7K+ Followers
63.9K+ Liked
Posts
All
Videos
·
--
Bearish
On the ETH hourly chart, price is rising while pressing against the upper band; on the 4-hour chart, it is being suppressed by the upper band. On the daily chart, the mid-band is also capping around 2540. You missed the low long entry, so don’t chase higher. The upside for chasing is limited—if price pulls back from a high level, you’re likely to get trapped. First look for short at the high.
Bias: Short
Entry: 2520-2560
Targets: 2470-2420-2350
Stop loss: 2600
Personal view only, for reference! #NEAR涨超26%突破3.45美元
$ETH
{future}(ETHUSDT)
On the ETH hourly chart, price is rising while pressing against the upper band; on the 4-hour chart, it is being suppressed by the upper band. On the daily chart, the mid-band is also capping around 2540. You missed the low long entry, so don’t chase higher. The upside for chasing is limited—if price pulls back from a high level, you’re likely to get trapped. First look for short at the high.
Bias: Short
Entry: 2520-2560
Targets: 2470-2420-2350
Stop loss: 2600
Personal view only, for reference! #NEAR涨超26%突破3.45美元
$ETH
Bias: Short
Entry: 2520-2560
Targets: 2470-2420-2350
Stop loss: 2600
Personal view only, for reference! #NEAR涨超26%突破3.45美元
$ETH
1.6k
·
--
BTC hourly chart, 4-hour chart prices are pushing upward along the upper band, and the daily K line has reached the mid-band where it is being pressured. Chasing the rally is risky; at higher levels, first look for a pullback.
Bias: Go short on the high
Entry: 78500-79500
Targets: 77500-76500-75000
Add to position: 80500
Stop loss: 81500
My personal view is for reference only!#NEAR涨超26%突破3.45美元 $BTC
{future}(BTCUSDT)
BTC hourly chart, 4-hour chart prices are pushing upward along the upper band, and the daily K line has reached the mid-band where it is being pressured. Chasing the rally is risky; at higher levels, first look for a pullback.
Bias: Go short on the high
Entry: 78500-79500
Targets: 77500-76500-75000
Add to position: 80500
Stop loss: 81500
My personal view is for reference only!#NEAR涨超26%突破3.45美元 $BTC
Bias: Go short on the high
Entry: 78500-79500
Targets: 77500-76500-75000
Add to position: 80500
Stop loss: 81500
My personal view is for reference only!#NEAR涨超26%突破3.45美元 $BTC
948
·
--
K-line Knowledge: Evening Star Q Baby Deception Above and Below
K-line Knowledge: Evening Star Q Baby Deception Above and Below
2
2.8k
·
--
K-line Knowledge: Mother and Child Night Stars Disappear
K-line Knowledge: Mother and Child Night Stars Disappear
7
2.4k
·
--
K Line Knowledge: Nine S Double Shoulders Sitting Together
K Line Knowledge: Nine S Double Shoulders Sitting Together
1.6k
·
--
K-line Knowledge: Descending Three Methods Three Bright Sandwiches
K-line Knowledge: Descending Three Methods Three Bright Sandwiches
1
1.6k
·
--
K Line Knowledge: Three Crows Hanging Skyward Reversal Dive
K Line Knowledge: Three Crows Hanging Skyward Reversal Dive
2
1.5k
·
--
K-line Knowledge: Internal Struggle of Three Black Candles Turning Bearish
K-line Knowledge: Internal Struggle of Three Black Candles Turning Bearish
8
1.5k
·
--
K-Line Knowledge: Three-Line Reverse Black Break Line Reversal
K-Line Knowledge: Three-Line Reverse Black Break Line Reversal
8
1.2k
·
--
K Line Knowledge: Outside Three Black Start of Decline
K Line Knowledge: Outside Three Black Start of Decline
4
1.8k
·
--
K Line Knowledge: One Star Two Shadows Halfway Abandoned #干货满满
K Line Knowledge: One Star Two Shadows Halfway Abandoned #干货满满
8
1.6k
·
--
K-Line Knowledge: Inverted Hammer, Few Days to Come
K-Line Knowledge: Inverted Hammer, Few Days to Come
4
1.3k
·
--
K-line Knowledge: A thousand miles of leakage, no one can defeat#Financial Knowledge
K-line Knowledge: A thousand miles of leakage, no one can defeat#Financial Knowledge
1
1k
·
--
Global Financial Breakfast
Market Review
On Wednesday, the US Dollar Index rebounded to above 98.6 during the European session but then gave back most of its gains, ultimately closing up 0.18% at 98.39; the benchmark 10-year US Treasury yield ultimately closed at 4.163%, while the 2-year Treasury yield, sensitive to Federal Reserve policy rates, closed at 3.493%.
Spot gold briefly returned to around $4340, then began to fluctuate widely, ultimately closing up 0.84% at $4338.44 per ounce; spot silver refreshed its historical high to above $66, ultimately closing up 3.87% at $66.19 per ounce.
Due to Trump's easing of the blockade on Venezuela, concerns about global oversupply eased, leading to a significant rebound in oil prices. WTI crude oil ultimately closed up 3.03% at $56.70 per barrel; Brent crude oil returned to above $60, ultimately closing up 2.95% at $60.79 per barrel.
Global Financial Breakfast
Market Review
On Wednesday, the US Dollar Index rebounded to above 98.6 during the European session but then gave back most of its gains, ultimately closing up 0.18% at 98.39; the benchmark 10-year US Treasury yield ultimately closed at 4.163%, while the 2-year Treasury yield, sensitive to Federal Reserve policy rates, closed at 3.493%.
Spot gold briefly returned to around $4340, then began to fluctuate widely, ultimately closing up 0.84% at $4338.44 per ounce; spot silver refreshed its historical high to above $66, ultimately closing up 3.87% at $66.19 per ounce.
Due to Trump's easing of the blockade on Venezuela, concerns about global oversupply eased, leading to a significant rebound in oil prices. WTI crude oil ultimately closed up 3.03% at $56.70 per barrel; Brent crude oil returned to above $60, ultimately closing up 2.95% at $60.79 per barrel.
Market Review
On Wednesday, the US Dollar Index rebounded to above 98.6 during the European session but then gave back most of its gains, ultimately closing up 0.18% at 98.39; the benchmark 10-year US Treasury yield ultimately closed at 4.163%, while the 2-year Treasury yield, sensitive to Federal Reserve policy rates, closed at 3.493%.
Spot gold briefly returned to around $4340, then began to fluctuate widely, ultimately closing up 0.84% at $4338.44 per ounce; spot silver refreshed its historical high to above $66, ultimately closing up 3.87% at $66.19 per ounce.
Due to Trump's easing of the blockade on Venezuela, concerns about global oversupply eased, leading to a significant rebound in oil prices. WTI crude oil ultimately closed up 3.03% at $56.70 per barrel; Brent crude oil returned to above $60, ultimately closing up 2.95% at $60.79 per barrel.

6
2.3k
·
--
These doji reversal signals must be known
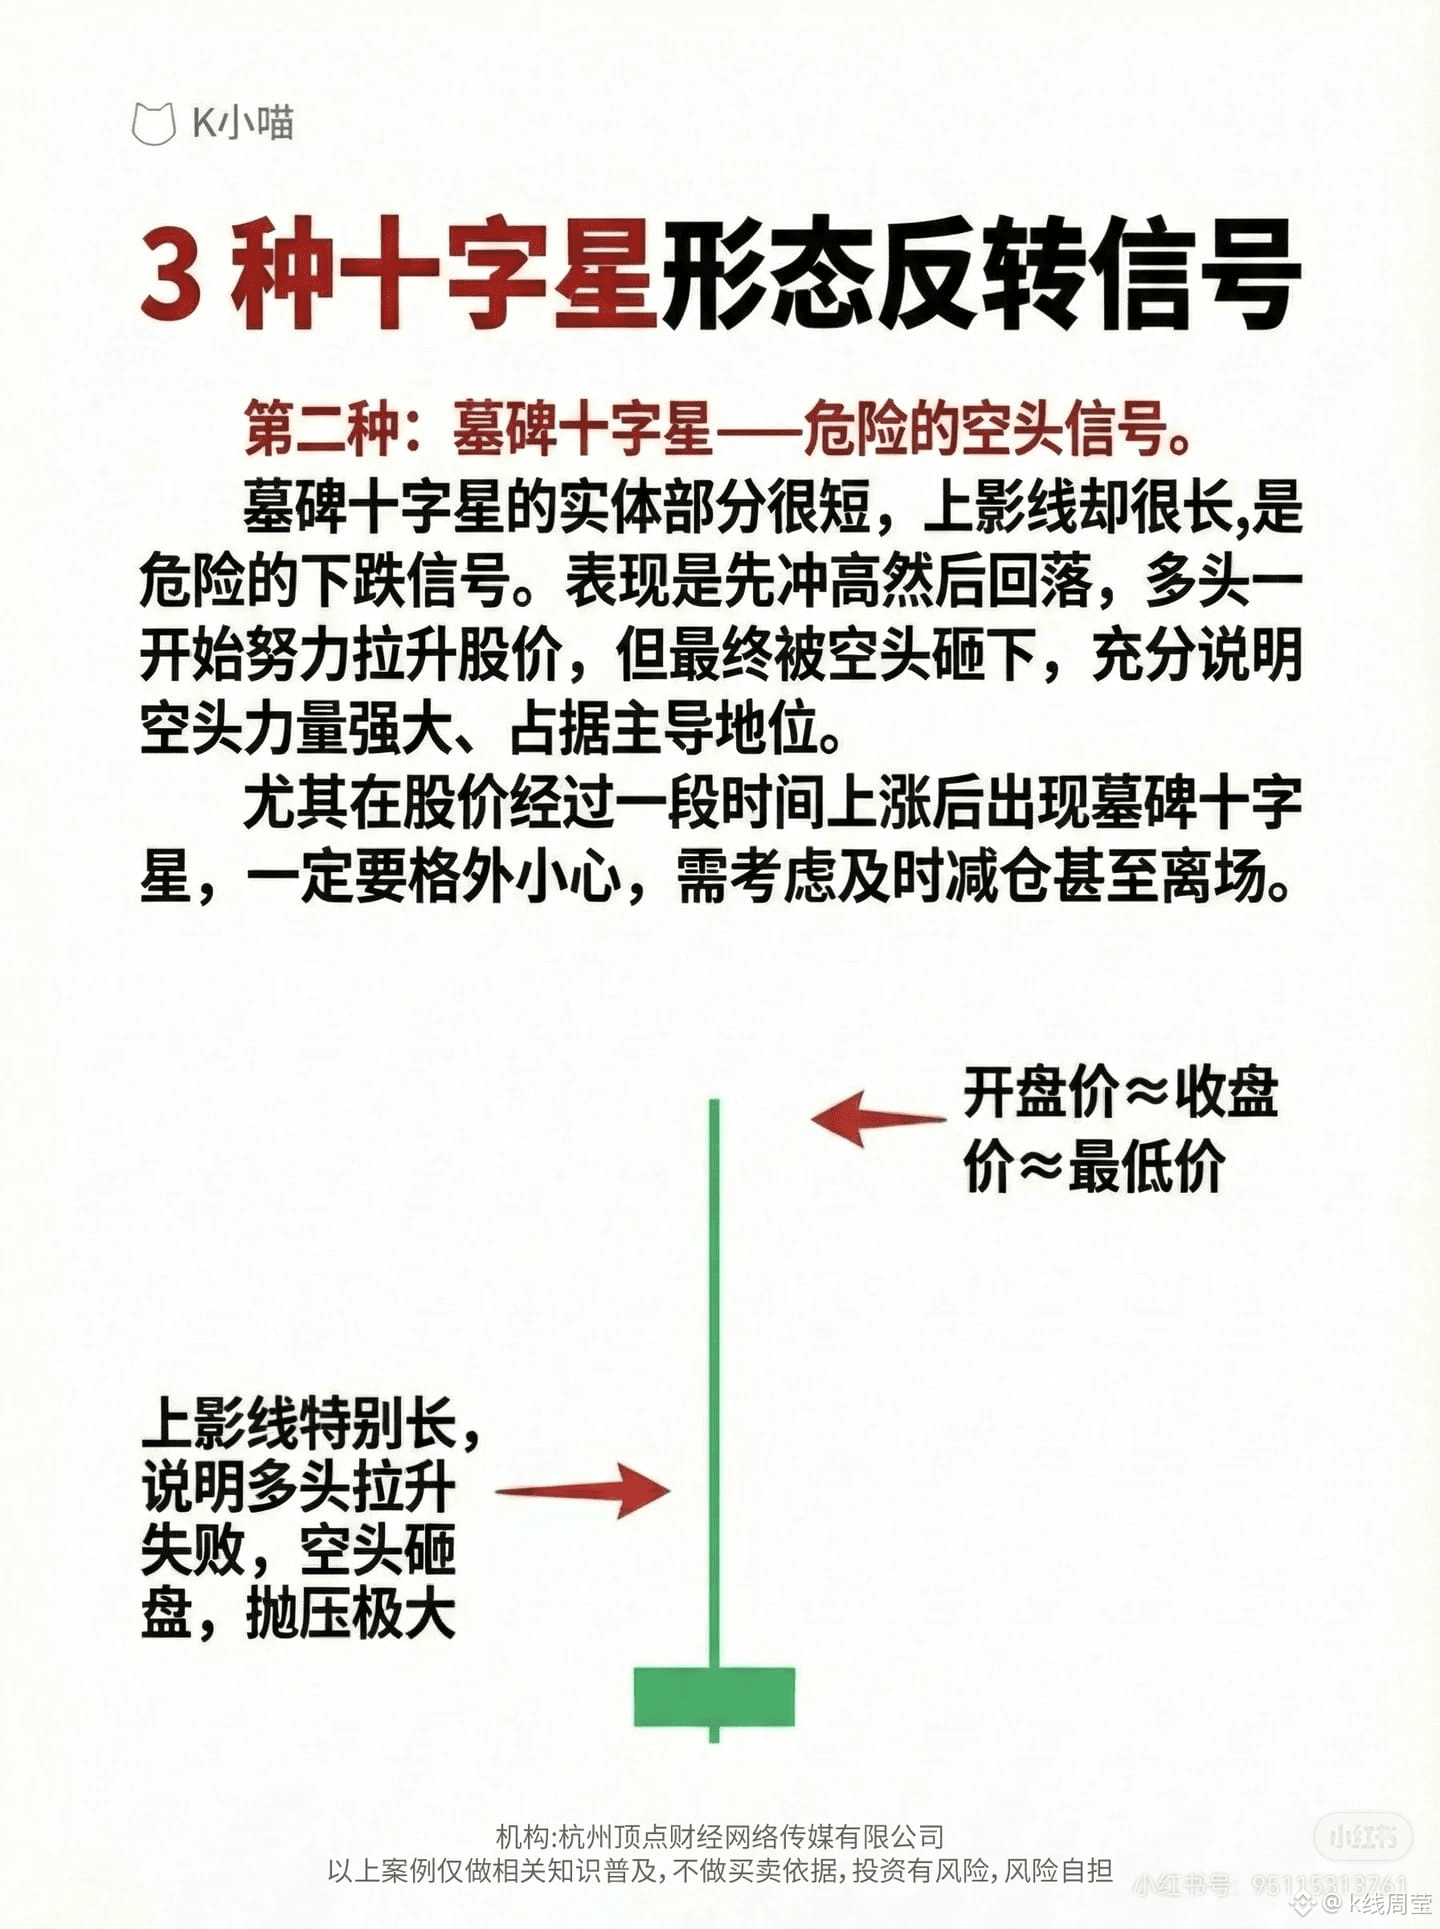
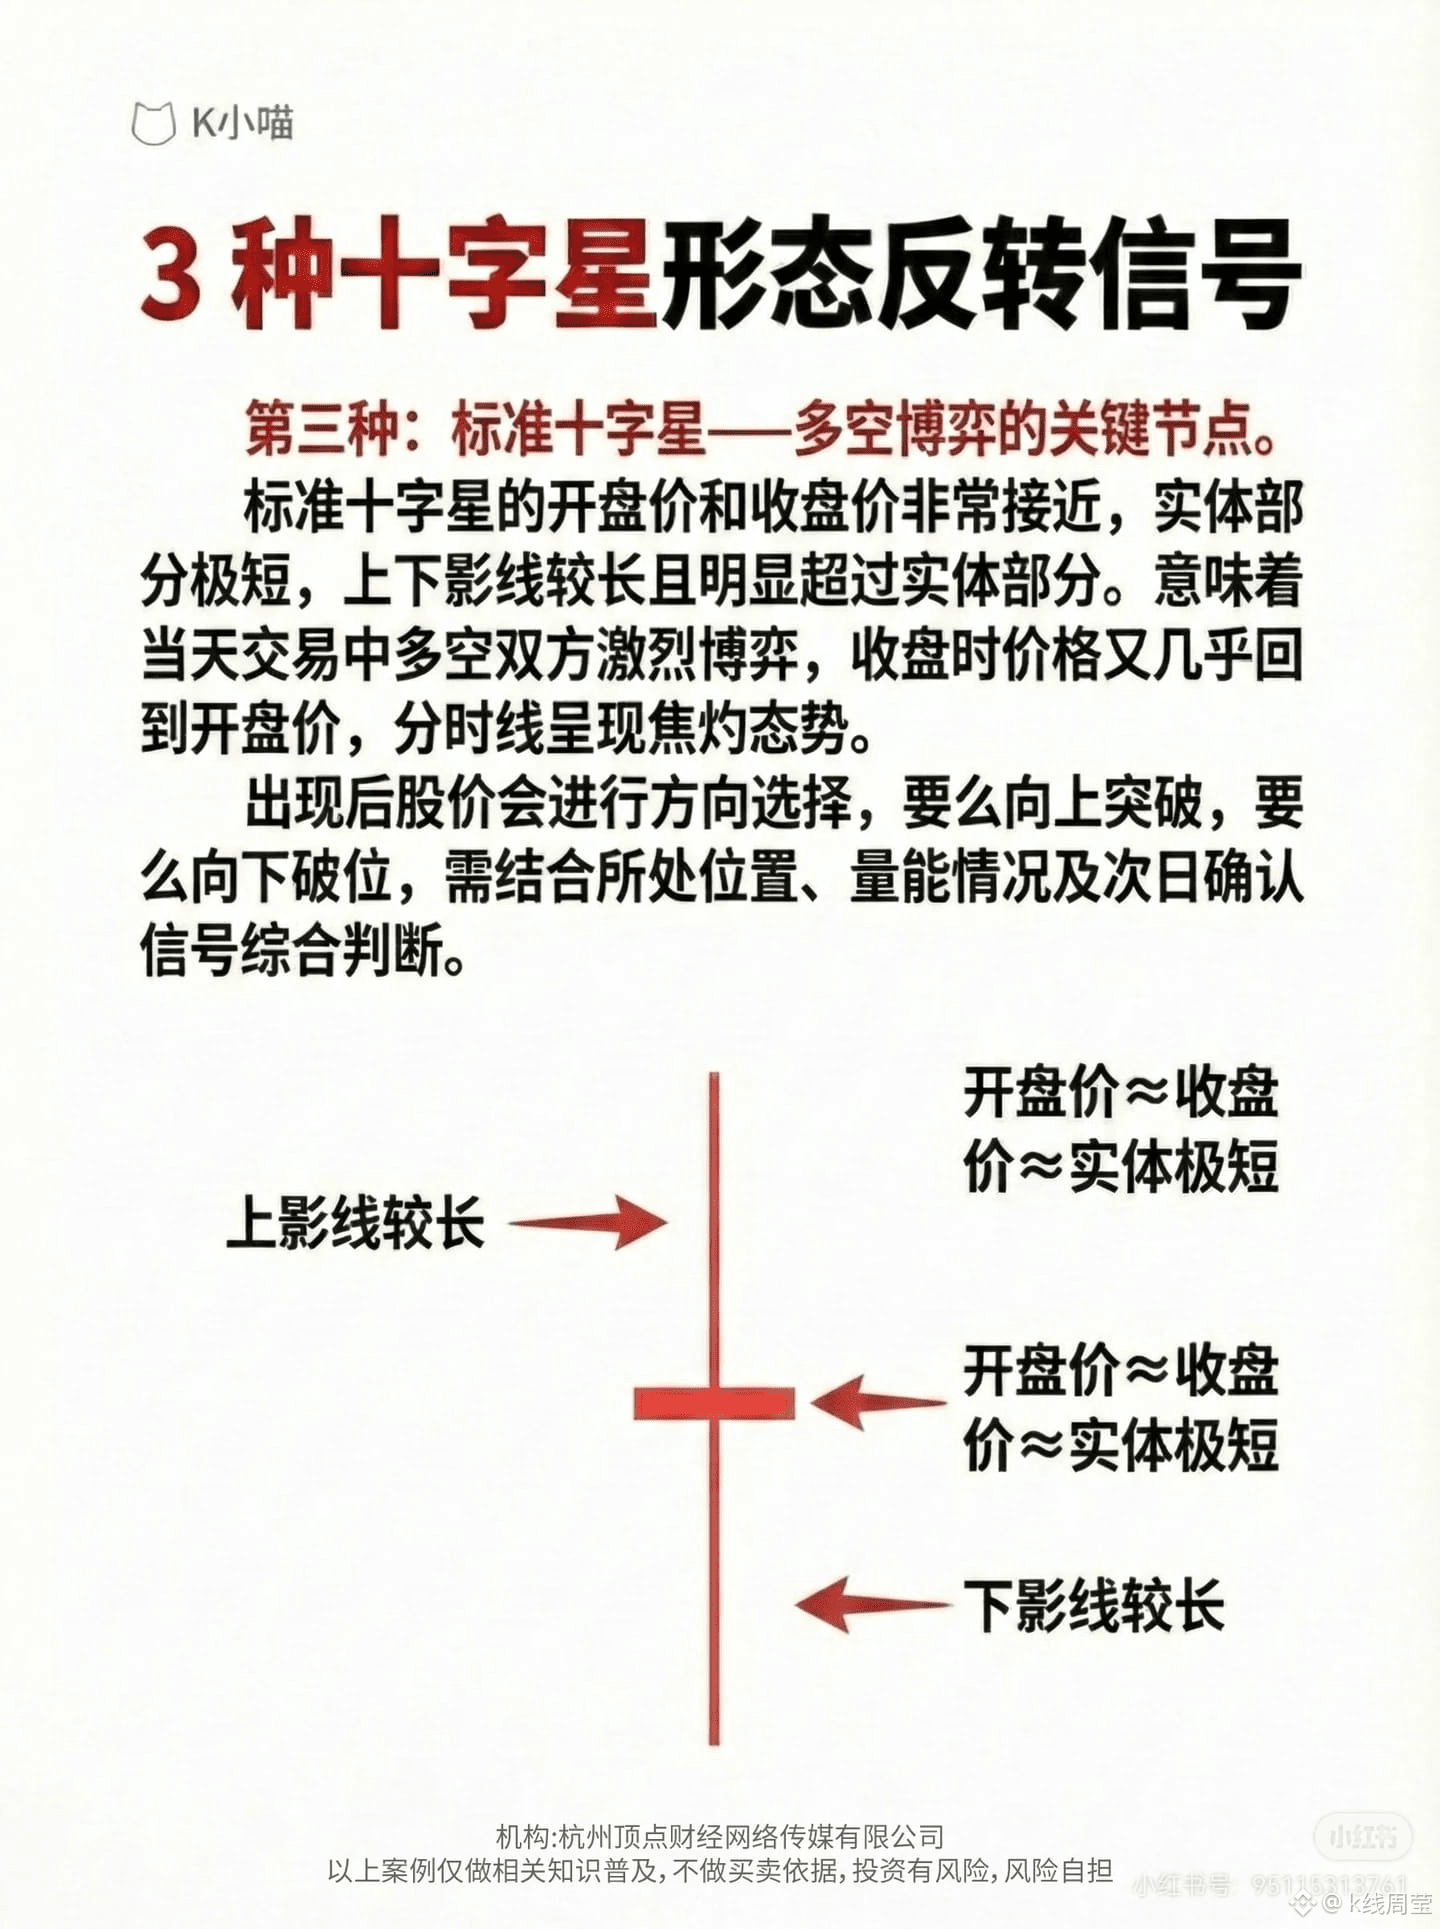
These doji reversal signals must be known! The doji can be said to be a simple yet effective trend reversal signal in the market, indicating that the divergence between bulls and bears has reached a boiling point, and is at a critical juncture for trend reversal. Today, I will share three common doji patterns and their specific applications in practice.
1. T-shaped doji -- strong reversal signal 2. Gravestone doji -- dangerous bearish signal Standard doji -- key juncture for bull-bear struggle
Note: In a standard doji, if the price rises from the bottom to a high and then a standard doji appears, the probability of a downward trend reversal is high, especially if a large bearish candle appears the next day, indicating that the bulls are losing strength, and profit-taking leads to selling, which will exacerbate the decline; if a standard doji appears during a downtrend, and a bullish engulfing candle appears the next day, the probability of an upward rebound increases significantly, indicating that the bears can no longer push down, and the bulls begin to gain the upper hand. If a large volume is released below at this time, the reversal signal will be even clearer.
These doji reversal signals must be known
These doji reversal signals must be known! The doji can be said to be a simple yet effective trend reversal signal in the market, indicating that the divergence between bulls and bears has reached a boiling point, and is at a critical juncture for trend reversal. Today, I will share three common doji patterns and their specific applications in practice.
1. T-shaped doji -- strong reversal signal 2. Gravestone doji -- dangerous bearish signal Standard doji -- key juncture for bull-bear struggle
Note: In a standard doji, if the price rises from the bottom to a high and then a standard doji appears, the probability of a downward trend reversal is high, especially if a large bearish candle appears the next day, indicating that the bulls are losing strength, and profit-taking leads to selling, which will exacerbate the decline; if a standard doji appears during a downtrend, and a bullish engulfing candle appears the next day, the probability of an upward rebound increases significantly, indicating that the bears can no longer push down, and the bulls begin to gain the upper hand. If a large volume is released below at this time, the reversal signal will be even clearer.
These doji reversal signals must be known! The doji can be said to be a simple yet effective trend reversal signal in the market, indicating that the divergence between bulls and bears has reached a boiling point, and is at a critical juncture for trend reversal. Today, I will share three common doji patterns and their specific applications in practice.
1. T-shaped doji -- strong reversal signal 2. Gravestone doji -- dangerous bearish signal Standard doji -- key juncture for bull-bear struggle
Note: In a standard doji, if the price rises from the bottom to a high and then a standard doji appears, the probability of a downward trend reversal is high, especially if a large bearish candle appears the next day, indicating that the bulls are losing strength, and profit-taking leads to selling, which will exacerbate the decline; if a standard doji appears during a downtrend, and a bullish engulfing candle appears the next day, the probability of an upward rebound increases significantly, indicating that the bears can no longer push down, and the bulls begin to gain the upper hand. If a large volume is released below at this time, the reversal signal will be even clearer.

2
589
·
--
The underlying logic and meaning of moving averages:
Today we will learn about moving averages, which are officially known as moving averages in English, abbreviated as MA. This is one of the essential indicators in technical analysis.
It calculates the average price of a stock over a specific period, forming a continuous curve to show the trend and direction of the stock price.
From the daily level:
For short-term trading, one can observe MA5 and MA10. The 5-day moving average represents the average price over the last week, while the 10-day moving average represents the average price over the last two weeks;
For medium-term trading, one can observe MA20 and MA60. The 20-day moving average represents the average price over the last month, while the 60-day moving average represents the average price over the last quarter;
For long-term trading, one can observe MA120 and MA250. The 120-day moving average represents the average price over the last six months, while the 250-day moving average represents the average price over the last year.
The underlying logic and meaning of moving averages:
Today we will learn about moving averages, which are officially known as moving averages in English, abbreviated as MA. This is one of the essential indicators in technical analysis.
It calculates the average price of a stock over a specific period, forming a continuous curve to show the trend and direction of the stock price.
From the daily level:
For short-term trading, one can observe MA5 and MA10. The 5-day moving average represents the average price over the last week, while the 10-day moving average represents the average price over the last two weeks;
For medium-term trading, one can observe MA20 and MA60. The 20-day moving average represents the average price over the last month, while the 60-day moving average represents the average price over the last quarter;
For long-term trading, one can observe MA120 and MA250. The 120-day moving average represents the average price over the last six months, while the 250-day moving average represents the average price over the last year.
Today we will learn about moving averages, which are officially known as moving averages in English, abbreviated as MA. This is one of the essential indicators in technical analysis.
It calculates the average price of a stock over a specific period, forming a continuous curve to show the trend and direction of the stock price.
From the daily level:
For short-term trading, one can observe MA5 and MA10. The 5-day moving average represents the average price over the last week, while the 10-day moving average represents the average price over the last two weeks;
For medium-term trading, one can observe MA20 and MA60. The 20-day moving average represents the average price over the last month, while the 60-day moving average represents the average price over the last quarter;
For long-term trading, one can observe MA120 and MA250. The 120-day moving average represents the average price over the last six months, while the 250-day moving average represents the average price over the last year.


2
388

·
--
Global FinanceMarket Inventory
On Monday, the US dollar index fluctuated downwards, briefly falling close to the 98 mark, then recovering some ground, ultimately closing down 0.13% at 98.28; the benchmark 10-year US Treasury yield ultimately closed at 4.181%, while the 2-year US Treasury yield, sensitive to Federal Reserve policy rates, closed at 3.516%.
Due to the weakening of the US dollar and the decline in US Treasury yields, spot gold briefly returned above $4,350 during the session but was unable to hold this level, retracting over $60, and ultimately closed up 0.12% at $4,305.54 per ounce; spot silver returned near historical highs, ultimately closing up 3.4% at $64.07 per ounce.
Global Finance
Market Inventory
On Monday, the US dollar index fluctuated downwards, briefly falling close to the 98 mark, then recovering some ground, ultimately closing down 0.13% at 98.28; the benchmark 10-year US Treasury yield ultimately closed at 4.181%, while the 2-year US Treasury yield, sensitive to Federal Reserve policy rates, closed at 3.516%.
Due to the weakening of the US dollar and the decline in US Treasury yields, spot gold briefly returned above $4,350 during the session but was unable to hold this level, retracting over $60, and ultimately closed up 0.12% at $4,305.54 per ounce; spot silver returned near historical highs, ultimately closing up 3.4% at $64.07 per ounce.
On Monday, the US dollar index fluctuated downwards, briefly falling close to the 98 mark, then recovering some ground, ultimately closing down 0.13% at 98.28; the benchmark 10-year US Treasury yield ultimately closed at 4.181%, while the 2-year US Treasury yield, sensitive to Federal Reserve policy rates, closed at 3.516%.
Due to the weakening of the US dollar and the decline in US Treasury yields, spot gold briefly returned above $4,350 during the session but was unable to hold this level, retracting over $60, and ultimately closed up 0.12% at $4,305.54 per ounce; spot silver returned near historical highs, ultimately closing up 3.4% at $64.07 per ounce.
1
453
Log in to explore more content
Join global crypto users on Binance Square
⚡️ Get latest and useful information about crypto.
💬 Trusted by the world’s largest crypto exchange.
👍 Discover real insights from verified creators.
Email / Phone number
Trending Topics
BTCBreaks80K
92,824 views
1,622 Discussing
$BTC
What price is BTC going to hit in 2026?
Spot is sitting at $80,748. 104 days to go
↑ $90k - 58%
↑ $100k - 24%
↓ $70k dip first - 48%
The bull case floating around the floor:
>August had a proper run from $62,275 up to $81,479 — up 31% bottom to top
>The CLARITY Act flopped its Senate cloture vote 49-50 on 15 Sept. BTC was already sliding well before the vote, touched $74,968 in that hour, and won it all back inside three days
>The Fed hiked rates on 16 Sept — first time since July 2023. Spot is currently floating 7.4% above that day's low
>The altcoins are proper outrunning it. 30-day view: SOL up 38%, XRP up 35%, ETH up 32% versus BTC up 23%
>The timeline is still packed with reasons why this ought to break down — and that’s precisely the wall of worry bull markets tend to climb
>The midterms land on 3 Nov, right smack in the middle of this market window
So, what would you put down for a punt at +24% in 104 days?
$ETH
$SOL
#BTCBreaks80K #solonapumping #ETH🔥🔥🔥🔥🔥🔥 #BullMarket📈
Wealthy bloke
·5 Likes
·5k views
BuffettBecomesBerkshireChairmanEmeritus
24,063 views
566 Discussing
ZcashSpotETFTops$230MMonthlyInflow
6,298 views
83 Discussing