📈 The week closed at $27,992#BTC#week #toptraders
A trip for external liquidity or a bull trap?
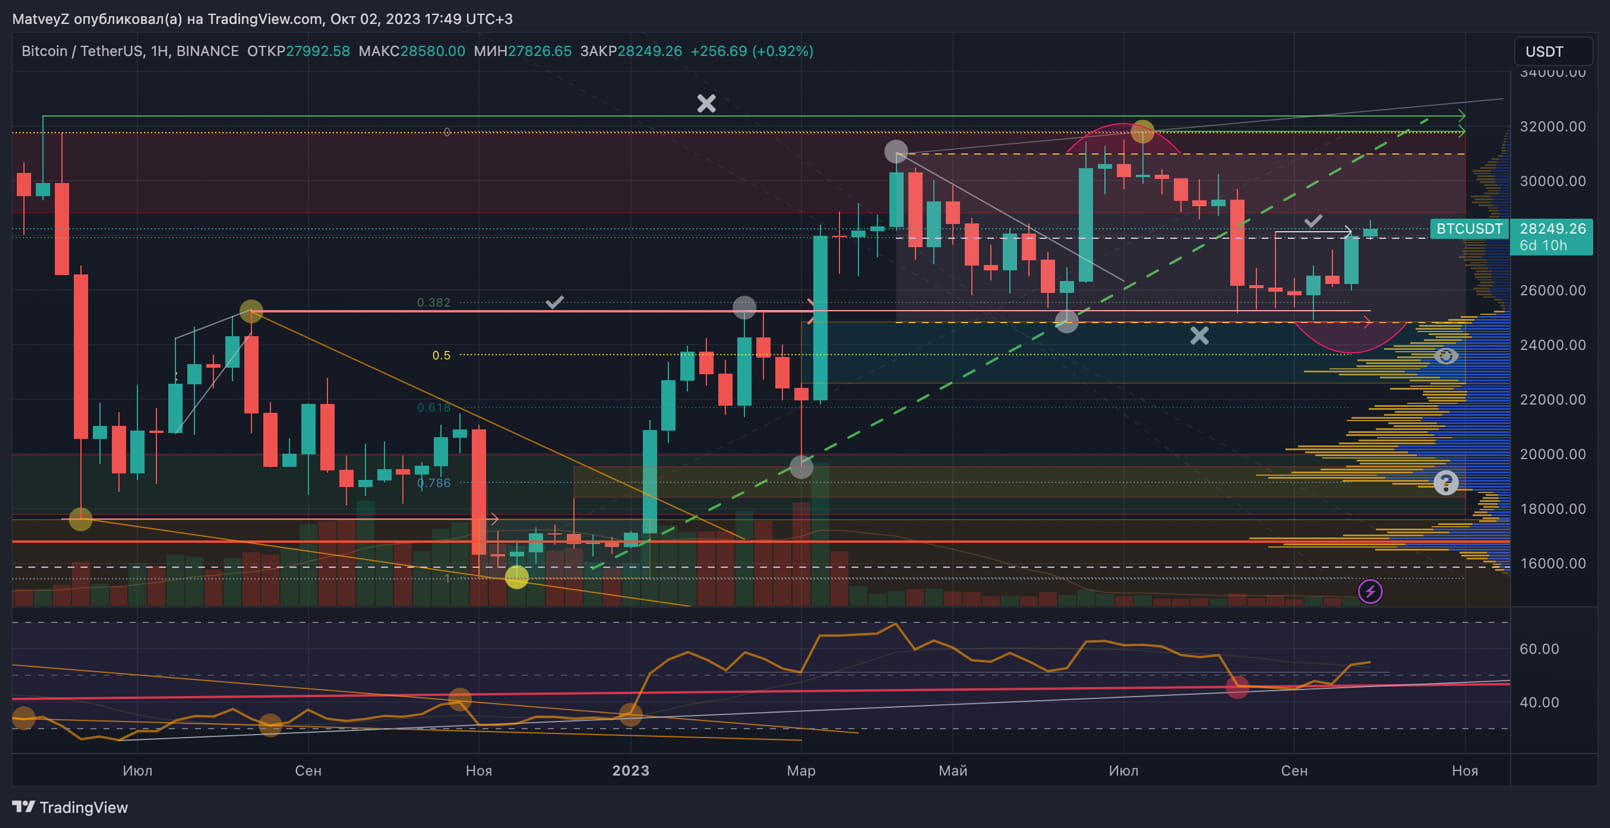
🔎For the third time we return to the resistance zone of $29,000 - $31,000
🔎Impulsively fell under the upward trend (green dotted line)
🔎Partially removed liquidity for sale in the range of $24,800 - $25,400
✅Local liquidity for purchase was removed from the level of $28,150
🔎Remained above the local and global trend for RSI from July 2023 (gray line) and from December 2018 (red line)
❗️Equal lows at $24,800, coinciding with the mirror support level, act as a large pool of liquidity for sale. The price will tend towards this area.
🔵 Areas of interest for the global correction are areas coinciding with Fibonacci levels ($23,000 - $24,000; $21,000 - $22,000; $18,000 - $20,000). The nearest zone of interest for medium- and long-term purchases is $23,000 - $24,000.
✅ Conclusions:
The weakness of the S&P500 and minimal volumes on the rise increase the likelihood of further plunging. Volumetric removal of stops and, therefore, collection of liquidity for sale has not yet been observed, which means there are not enough reasons for a reversal. A scenario with a local range, as was 28, is not excluded.06.2023.
https://www.tradingview.com/x/K29BY28V/
A trip for external liquidity or a bull trap?
🔎For the third time we return to the resistance zone of $29,000 - $31,000
🔎Impulsively fell under the upward trend (green dotted line)
🔎Partially removed liquidity for sale in the range of $24,800 - $25,400
✅Local liquidity for purchase was removed from the level of $28,150
🔎Remained above the local and global trend for RSI from July 2023 (gray line) and from December 2018 (red line)
❗️Equal lows at $24,800, coinciding with the mirror support level, act as a large pool of liquidity for sale. The price will tend towards this area.
🔵 Areas of interest for the global correction are areas coinciding with Fibonacci levels ($23,000 - $24,000; $21,000 - $22,000; $18,000 - $20,000). The nearest zone of interest for medium- and long-term purchases is $23,000 - $24,000.
✅ Conclusions:
The weakness of the S&P500 and minimal volumes on the rise increase the likelihood of further plunging. Volumetric removal of stops and, therefore, collection of liquidity for sale has not yet been observed, which means there are not enough reasons for a reversal. A scenario with a local range, as was 28, is not excluded.06.2023.
https://www.tradingview.com/x/K29BY28V/