

Jack_TheAnalyst
6 Paylaşımlar

Jack_TheAnalyst
Şikayət et
İstifadəçini blokla
4 İzlənilir
4 İzləyicilər
8 Bəyəndi
Postlar
BƏRKİDİLDİ
·
--
Artım
Binance Square-ə salam!
Jack_TheAnalyst buradadır
Mən aydın, qərəzsiz bazar məlumatlılığı təqdim etməyə yönəlmiş peşəkar kontent yaradıcısıyam.
Ağıllı, analitik treyderlərdən və investorlardan ibarət bir icma qurmaq üçün buradayam.
Gündəlik bazar şərhləri, strukturlaşdırılmış qrafiklər və real-time analizlərdən xəbərdar olmaq üçün Follow düyməsini sıxın.
$NVDAB $AAPLB $LSK
{future}(LSKUSDT)
#BinanceWillListHyperliquid(HYPE) #FedOctoberRateHikeOddsRiseTo69.7%
Binance Square-ə salam!
Jack_TheAnalyst buradadır
Mən aydın, qərəzsiz bazar məlumatlılığı təqdim etməyə yönəlmiş peşəkar kontent yaradıcısıyam.
Ağıllı, analitik treyderlərdən və investorlardan ibarət bir icma qurmaq üçün buradayam.
Gündəlik bazar şərhləri, strukturlaşdırılmış qrafiklər və real-time analizlərdən xəbərdar olmaq üçün Follow düyməsini sıxın.
$NVDAB $AAPLB $LSK
#BinanceWillListHyperliquid(HYPE) #FedOctoberRateHikeOddsRiseTo69.7%
Jack_TheAnalyst buradadır
Mən aydın, qərəzsiz bazar məlumatlılığı təqdim etməyə yönəlmiş peşəkar kontent yaradıcısıyam.
Ağıllı, analitik treyderlərdən və investorlardan ibarət bir icma qurmaq üçün buradayam.
Gündəlik bazar şərhləri, strukturlaşdırılmış qrafiklər və real-time analizlərdən xəbərdar olmaq üçün Follow düyməsini sıxın.
$NVDAB $AAPLB $LSK
#BinanceWillListHyperliquid(HYPE) #FedOctoberRateHikeOddsRiseTo69.7%
2
151
Məqalə
Tərcüməyə bax
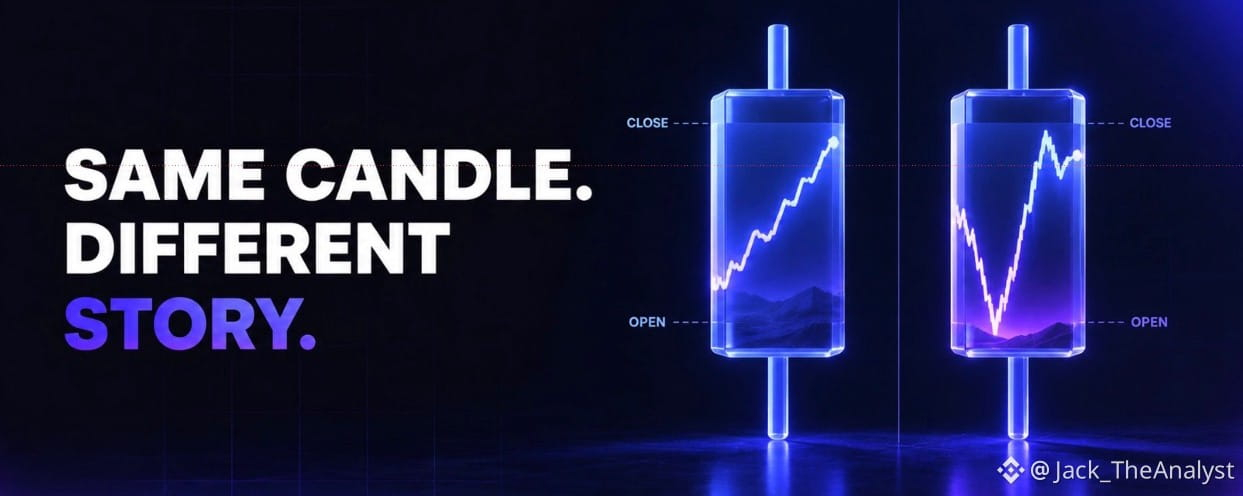
What a Candle Can Hide?Higher-timeframe candles are useful because they compress a large amount of price action into something easy to read. The problem is that two candles with almost identical opens, highs, lows and closes can be created through very different sequences of events.
That sequence can matter when evaluating what actually happened during the session.
Suppose BTC opens at $80,000 and closesat $82,000. In the first scenario, price gradually moves higher throughout the day, pullbacks remain shallow, and most of the final hours are spent near $82,000. Buyers gained ground and were able to maintain it.
Now imagine the same open and close, but BTC first drops to $77,500, aggressively recovers to $83,000 and then falls back to $82,000 before the daily close.
Both sessions finish bullish, but they tell different stories. The second contained a failed move lower, a strong recovery and then selling above the eventual closing price. None of that is fully explained by simply calling the daily candle bullish.
This becomes especially useful around important levels.
Imagine a daily candle closes slightly above resistance. Looking only at the daily chart, it may appear to be a successful breakout. But a lower timeframe might show that price broke resistance early, spent most of the session back below it and only recovered during the final hour.
Compare that with a session that breaks resistance early, retests it from above and spends the remainder of the day building higher. The daily candles could eventually look similar, but the second shows much clearer acceptance above the level.
Lower timeframes can therefore be used as a diagnostic tool rather than simply as another place to search for entries.
When a higher-timeframe candle forms at an important area, look inside it and ask a few basic questions. Which side moved first? Was that move sustained or rejected? Where did price spend most of the session? Did the close confirm the dominant behavior of the day, or did a late move dramatically change the final candle?
You do not need to dissect every daily candle.
Most of the time, the higher timeframe provides enough information on its own.
But around major breakouts, failed moves and turning points, understanding how the candle was built can reveal information that its final shape compresses away.
The candle shows the result.
Sometimes the sequence explains how meaningful that result actually was.
#BTC走势分析 $BTC #PolymarketBankFailureBetsDrawFDICConcern #BlackRockBuildsTokenizedPortfoliosForOndo
{future}(BTCUSDT)
What a Candle Can Hide?
Higher-timeframe candles are useful because they compress a large amount of price action into something easy to read. The problem is that two candles with almost identical opens, highs, lows and closes can be created through very different sequences of events.
That sequence can matter when evaluating what actually happened during the session.
Suppose BTC opens at $80,000 and closesat $82,000. In the first scenario, price gradually moves higher throughout the day, pullbacks remain shallow, and most of the final hours are spent near $82,000. Buyers gained ground and were able to maintain it.
Now imagine the same open and close, but BTC first drops to $77,500, aggressively recovers to $83,000 and then falls back to $82,000 before the daily close.
Both sessions finish bullish, but they tell different stories. The second contained a failed move lower, a strong recovery and then selling above the eventual closing price. None of that is fully explained by simply calling the daily candle bullish.
This becomes especially useful around important levels.
Imagine a daily candle closes slightly above resistance. Looking only at the daily chart, it may appear to be a successful breakout. But a lower timeframe might show that price broke resistance early, spent most of the session back below it and only recovered during the final hour.
Compare that with a session that breaks resistance early, retests it from above and spends the remainder of the day building higher. The daily candles could eventually look similar, but the second shows much clearer acceptance above the level.
Lower timeframes can therefore be used as a diagnostic tool rather than simply as another place to search for entries.
When a higher-timeframe candle forms at an important area, look inside it and ask a few basic questions. Which side moved first? Was that move sustained or rejected? Where did price spend most of the session? Did the close confirm the dominant behavior of the day, or did a late move dramatically change the final candle?
You do not need to dissect every daily candle.
Most of the time, the higher timeframe provides enough information on its own.
But around major breakouts, failed moves and turning points, understanding how the candle was built can reveal information that its final shape compresses away.
The candle shows the result.
Sometimes the sequence explains how meaningful that result actually was.
#BTC走势分析 $BTC #PolymarketBankFailureBetsDrawFDICConcern #BlackRockBuildsTokenizedPortfoliosForOndo
That sequence can matter when evaluating what actually happened during the session.
Suppose BTC opens at $80,000 and closesat $82,000. In the first scenario, price gradually moves higher throughout the day, pullbacks remain shallow, and most of the final hours are spent near $82,000. Buyers gained ground and were able to maintain it.
Now imagine the same open and close, but BTC first drops to $77,500, aggressively recovers to $83,000 and then falls back to $82,000 before the daily close.
Both sessions finish bullish, but they tell different stories. The second contained a failed move lower, a strong recovery and then selling above the eventual closing price. None of that is fully explained by simply calling the daily candle bullish.
This becomes especially useful around important levels.
Imagine a daily candle closes slightly above resistance. Looking only at the daily chart, it may appear to be a successful breakout. But a lower timeframe might show that price broke resistance early, spent most of the session back below it and only recovered during the final hour.
Compare that with a session that breaks resistance early, retests it from above and spends the remainder of the day building higher. The daily candles could eventually look similar, but the second shows much clearer acceptance above the level.
Lower timeframes can therefore be used as a diagnostic tool rather than simply as another place to search for entries.
When a higher-timeframe candle forms at an important area, look inside it and ask a few basic questions. Which side moved first? Was that move sustained or rejected? Where did price spend most of the session? Did the close confirm the dominant behavior of the day, or did a late move dramatically change the final candle?
You do not need to dissect every daily candle.
Most of the time, the higher timeframe provides enough information on its own.
But around major breakouts, failed moves and turning points, understanding how the candle was built can reveal information that its final shape compresses away.
The candle shows the result.
Sometimes the sequence explains how meaningful that result actually was.
#BTC走势分析 $BTC #PolymarketBankFailureBetsDrawFDICConcern #BlackRockBuildsTokenizedPortfoliosForOndo
71
·
--
Artım
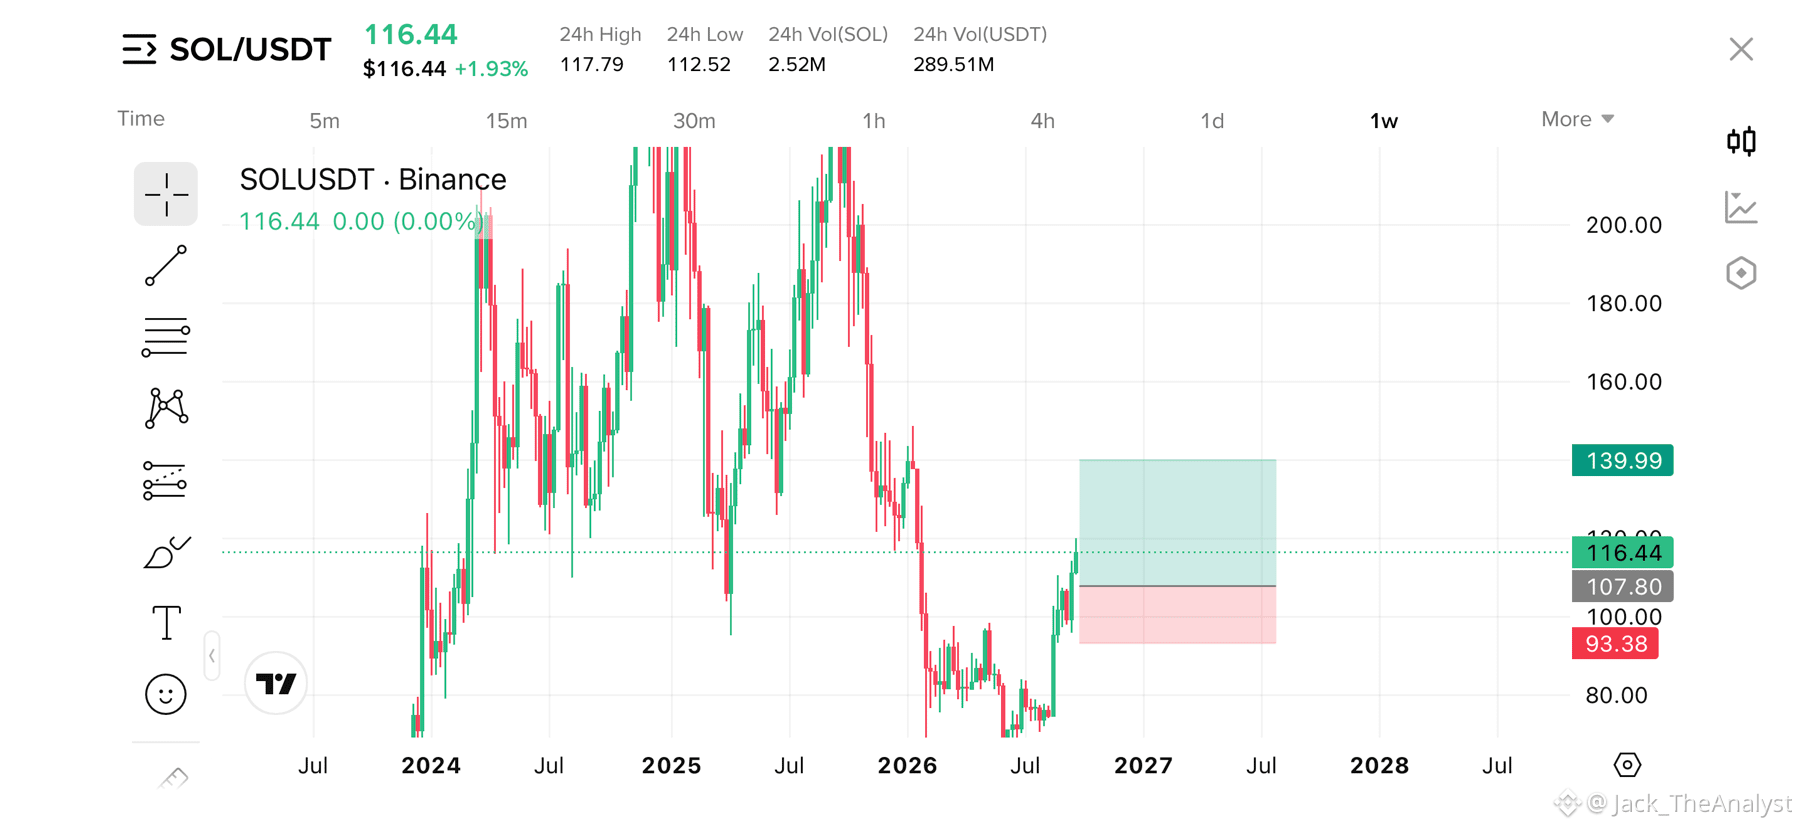
SOL Swing Long Trade
Solana ($SOL) həftəlik qrafikdə möhkəm struktur quruluş çap edir, uzun sürən düzəliş fazasından sonra əsas dəyər zonalarını müdafiə edir.
Müqavimət qırılıb, həftəlik şam səviyyənin üstündə bağlanıb və səviyyə yenidən sınaqdan keçirilib.
(RR): ~1 : 2.24
Giriş səviyyəsi: $107.80
Mənfəət Hədəfi (TP): $140.00
Stop Loss (SL): $93.38
Qismən $140.00-da sifariş edilə bilər, sonra isə yekun mənfəət hədəfi üçün növbəti səviyyəyə qədər treydi $200.00-a qədər saxlaya bilər.
#solonapumping #sol板块 #SolanaUSTD
$NVDAB $AAPLB $AAPL.US
SOL Swing Long Trade
Solana ($SOL) həftəlik qrafikdə möhkəm struktur quruluş çap edir, uzun sürən düzəliş fazasından sonra əsas dəyər zonalarını müdafiə edir.
Müqavimət qırılıb, həftəlik şam səviyyənin üstündə bağlanıb və səviyyə yenidən sınaqdan keçirilib.
(RR): ~1 : 2.24
Giriş səviyyəsi: $107.80
Mənfəət Hədəfi (TP): $140.00
Stop Loss (SL): $93.38
Qismən $140.00-da sifariş edilə bilər, sonra isə yekun mənfəət hədəfi üçün növbəti səviyyəyə qədər treydi $200.00-a qədər saxlaya bilər.
#solonapumping #sol板块 #SolanaUSTD
$NVDAB $AAPLB $AAPL.US
Solana ($SOL) həftəlik qrafikdə möhkəm struktur quruluş çap edir, uzun sürən düzəliş fazasından sonra əsas dəyər zonalarını müdafiə edir.
Müqavimət qırılıb, həftəlik şam səviyyənin üstündə bağlanıb və səviyyə yenidən sınaqdan keçirilib.
(RR): ~1 : 2.24
Giriş səviyyəsi: $107.80
Mənfəət Hədəfi (TP): $140.00
Stop Loss (SL): $93.38
Qismən $140.00-da sifariş edilə bilər, sonra isə yekun mənfəət hədəfi üçün növbəti səviyyəyə qədər treydi $200.00-a qədər saxlaya bilər.
#solonapumping #sol板块 #SolanaUSTD
$NVDAB $AAPLB $AAPL.US
1
78
·
--
Artım
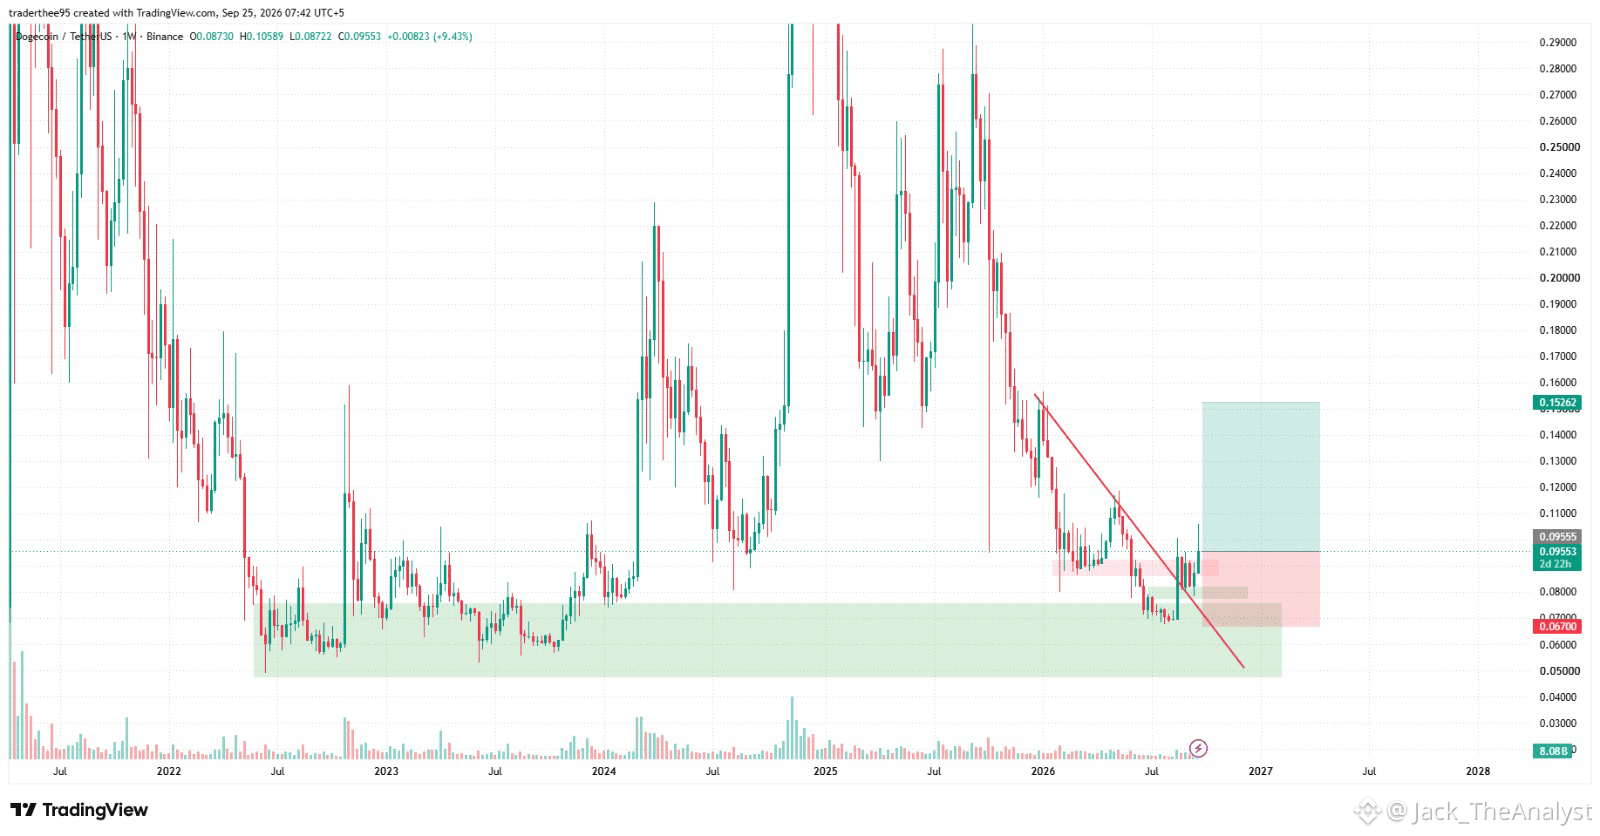
#dodgecoin DOGE/USDT
DOGE 2021-ci ilin əvvəllərindən qaynaqlanan əsas makro dəstək zonasını yenidən sınaqdan keçirdi (0.0500–0.0700 ABŞ dolları aralığında).
Bu mühüm dəstək zonasından geri dönüşdən sonra qiymət təxminən 0.08892 ABŞ dolları ətrafındakı ilkin Müqavimətə çevrilmiş Dəstək (RBS) səviyyəsini qırdı və əsas enən trend xəttinin üzərindən təmiz şəkildə çıxışı ilə üst-üstə düşdü.
Açılış trend xəttini yenidən ələ keçirdikdən sonra DOGE yaxın dövrün müqavimət zonanı da qırdı və güclü yüksəlişin davamı ssenarisinə doğru struktur dəyişiklik olduğunu təsdiqlədi.
Giriş nöqtəsi: ~$0.09508 (Cari bazar qiyməti və ya kiçik geri çəkilmə).
Stop Loss (SL): 0.06700 ABŞ dolları (əsas struktur dəstəyin altında təhlükəsiz yerləşdirilib).
Take Profit (TP): 0.15262 ABŞ dolları (əsas hədəf – mühüm swing-high müqaviməti).
#Dogecoin #doge⚡ #DOGEUSDT
$AAPL.US $AAPLB $GOOGL.US
#dodgecoin DOGE/USDT
DOGE 2021-ci ilin əvvəllərindən qaynaqlanan əsas makro dəstək zonasını yenidən sınaqdan keçirdi (0.0500–0.0700 ABŞ dolları aralığında).
Bu mühüm dəstək zonasından geri dönüşdən sonra qiymət təxminən 0.08892 ABŞ dolları ətrafındakı ilkin Müqavimətə çevrilmiş Dəstək (RBS) səviyyəsini qırdı və əsas enən trend xəttinin üzərindən təmiz şəkildə çıxışı ilə üst-üstə düşdü.
Açılış trend xəttini yenidən ələ keçirdikdən sonra DOGE yaxın dövrün müqavimət zonanı da qırdı və güclü yüksəlişin davamı ssenarisinə doğru struktur dəyişiklik olduğunu təsdiqlədi.
Giriş nöqtəsi: ~$0.09508 (Cari bazar qiyməti və ya kiçik geri çəkilmə).
Stop Loss (SL): 0.06700 ABŞ dolları (əsas struktur dəstəyin altında təhlükəsiz yerləşdirilib).
Take Profit (TP): 0.15262 ABŞ dolları (əsas hədəf – mühüm swing-high müqaviməti).
#Dogecoin #doge⚡ #DOGEUSDT
$AAPL.US $AAPLB $GOOGL.US
DOGE 2021-ci ilin əvvəllərindən qaynaqlanan əsas makro dəstək zonasını yenidən sınaqdan keçirdi (0.0500–0.0700 ABŞ dolları aralığında).
Bu mühüm dəstək zonasından geri dönüşdən sonra qiymət təxminən 0.08892 ABŞ dolları ətrafındakı ilkin Müqavimətə çevrilmiş Dəstək (RBS) səviyyəsini qırdı və əsas enən trend xəttinin üzərindən təmiz şəkildə çıxışı ilə üst-üstə düşdü.
Açılış trend xəttini yenidən ələ keçirdikdən sonra DOGE yaxın dövrün müqavimət zonanı da qırdı və güclü yüksəlişin davamı ssenarisinə doğru struktur dəyişiklik olduğunu təsdiqlədi.
Giriş nöqtəsi: ~$0.09508 (Cari bazar qiyməti və ya kiçik geri çəkilmə).
Stop Loss (SL): 0.06700 ABŞ dolları (əsas struktur dəstəyin altında təhlükəsiz yerləşdirilib).
Take Profit (TP): 0.15262 ABŞ dolları (əsas hədəf – mühüm swing-high müqaviməti).
#Dogecoin #doge⚡ #DOGEUSDT
$AAPL.US $AAPLB $GOOGL.US
1
195
·
--
Artım
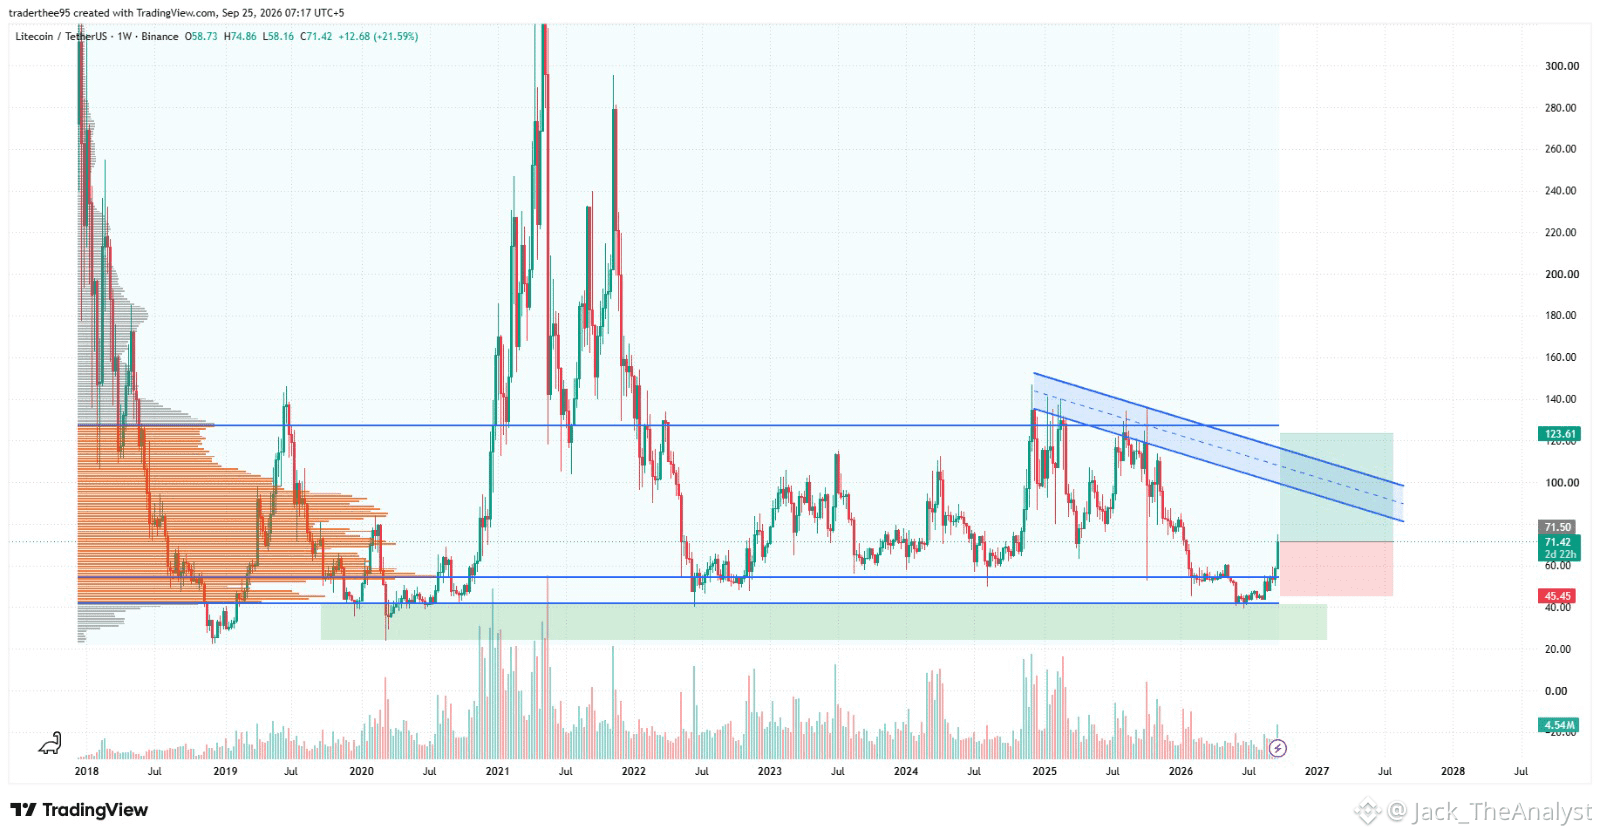
#Litecoin Major Multi-Year Accumulation Breakdown & Rebound — Uzun Hazırlıq
Litecoin qiymət hərəkəti yaxınlarda $60.47 ətrafındakı mühüm müqavimət səviyyəsini keçib və indi bu səviyyə mühüm dəstək zonası kimi çıxış edir. Qiymət bu bölgənin üzərində saxlanarsa, əvvəlki diapazondan aşağıya hərəkətin davamlı dağılımdan çox, bir sapma ola biləcəyini dəstəkləyə biləcəyi üçün bu bazar strukturundakı dəyişiklik izlənməlidir.
Həcm Profili: Aşağı səviyyələrdə möhkəm akkumulyasiya yığımı uzunmüddətli alıcıların bu zonanı müdafiə etdiyini göstərir.
Giriş Zonası: Cari Bazar Qiyməti (71.04) və ya $60.00 - $65.00 aralığına doğru kiçik geri çəkilmələr zamanı
Gözlənilən Mənfəət (TP): $123.60 (Yuxarı Müqavimət & Kanal Məqsədi)
Stop Zərər (SL): $45.45 (Əsas struktur dəstəyin altında)
#Litecoin #LitecoinUpdate #LitecoinRevolution
$NVDAB $AAPLB $AAPL.US
#Litecoin Major Multi-Year Accumulation Breakdown & Rebound — Uzun Hazırlıq
Litecoin qiymət hərəkəti yaxınlarda $60.47 ətrafındakı mühüm müqavimət səviyyəsini keçib və indi bu səviyyə mühüm dəstək zonası kimi çıxış edir. Qiymət bu bölgənin üzərində saxlanarsa, əvvəlki diapazondan aşağıya hərəkətin davamlı dağılımdan çox, bir sapma ola biləcəyini dəstəkləyə biləcəyi üçün bu bazar strukturundakı dəyişiklik izlənməlidir.
Həcm Profili: Aşağı səviyyələrdə möhkəm akkumulyasiya yığımı uzunmüddətli alıcıların bu zonanı müdafiə etdiyini göstərir.
Giriş Zonası: Cari Bazar Qiyməti (71.04) və ya $60.00 - $65.00 aralığına doğru kiçik geri çəkilmələr zamanı
Gözlənilən Mənfəət (TP): $123.60 (Yuxarı Müqavimət & Kanal Məqsədi)
Stop Zərər (SL): $45.45 (Əsas struktur dəstəyin altında)
#Litecoin #LitecoinUpdate #LitecoinRevolution
$NVDAB $AAPLB $AAPL.US
Litecoin qiymət hərəkəti yaxınlarda $60.47 ətrafındakı mühüm müqavimət səviyyəsini keçib və indi bu səviyyə mühüm dəstək zonası kimi çıxış edir. Qiymət bu bölgənin üzərində saxlanarsa, əvvəlki diapazondan aşağıya hərəkətin davamlı dağılımdan çox, bir sapma ola biləcəyini dəstəkləyə biləcəyi üçün bu bazar strukturundakı dəyişiklik izlənməlidir.
Həcm Profili: Aşağı səviyyələrdə möhkəm akkumulyasiya yığımı uzunmüddətli alıcıların bu zonanı müdafiə etdiyini göstərir.
Giriş Zonası: Cari Bazar Qiyməti (71.04) və ya $60.00 - $65.00 aralığına doğru kiçik geri çəkilmələr zamanı
Gözlənilən Mənfəət (TP): $123.60 (Yuxarı Müqavimət & Kanal Məqsədi)
Stop Zərər (SL): $45.45 (Əsas struktur dəstəyin altında)
#Litecoin #LitecoinUpdate #LitecoinRevolution
$NVDAB $AAPLB $AAPL.US
1
135
·
--
Artım
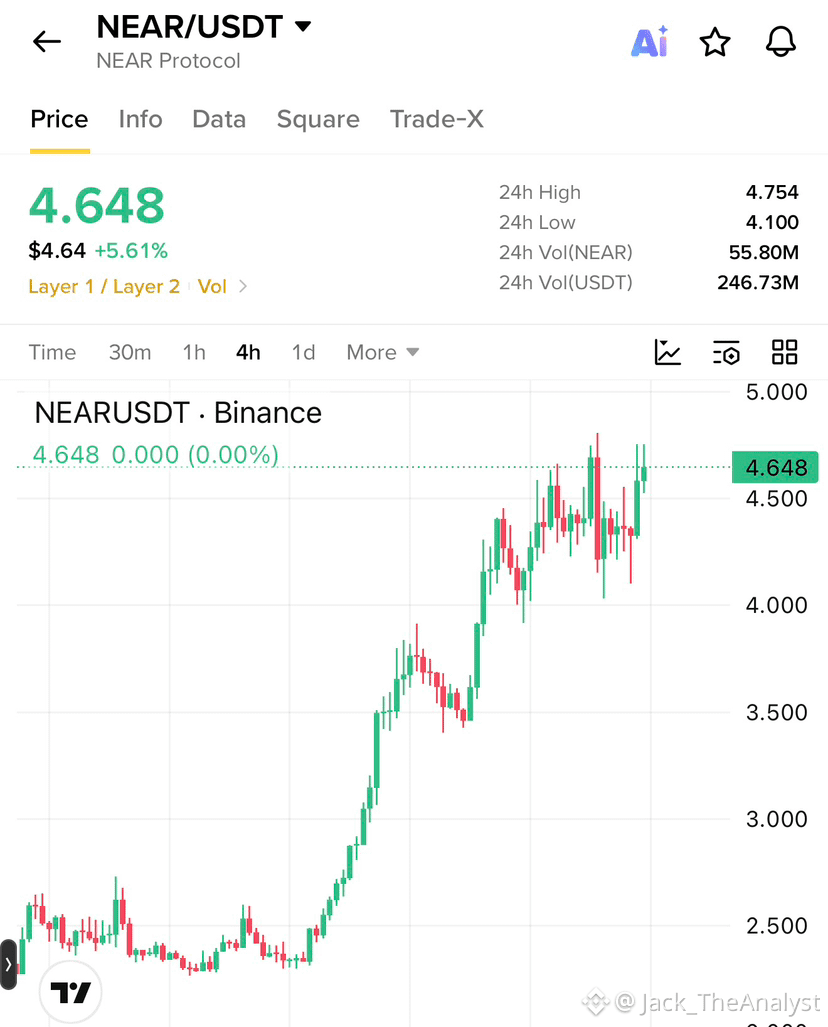
NEAR Protocol ($NEAR) 4 saatlıq qrafikdə çox güclü yüksəliş impulsu nümayiş etdirir: çoxaylıq konsolidasiya səviyyələrindən çıxaraq $4.65 səviyyəsinə doğru gedir.
Alımlar üçün: Təsdiqlənmiş 4 saatlıq şamın $4.75-dən yuxarı bağlanması $5.00-a yol açır; ikinci dərəcəli swing hədəfləri $5.50 və $6.00-dadır.
Ayı / Geri Dönüş Ssenarisi: $4.75 səddinin qırılmaması qısamüddətli mənfəət götürmələrə səbəb ola bilər və növbəti yüksəliş cəhdi öncəsi qiyməti $4.10 – $4.20 dəstək zonasına doğru geri endirə bilər.
#Near #NEARUSDT #NEAR🚀🚀🚀 $NEAR
{spot}(NEARUSDT)
NEAR Protocol ($NEAR ) 4 saatlıq qrafikdə çox güclü yüksəliş impulsu nümayiş etdirir: çoxaylıq konsolidasiya səviyyələrindən çıxaraq $4.65 səviyyəsinə doğru gedir.
Alımlar üçün: Təsdiqlənmiş 4 saatlıq şamın $4.75-dən yuxarı bağlanması $5.00-a yol açır; ikinci dərəcəli swing hədəfləri $5.50 və $6.00-dadır.
Ayı / Geri Dönüş Ssenarisi: $4.75 səddinin qırılmaması qısamüddətli mənfəət götürmələrə səbəb ola bilər və növbəti yüksəliş cəhdi öncəsi qiyməti $4.10 – $4.20 dəstək zonasına doğru geri endirə bilər.
#Near #NEARUSDT #NEAR🚀🚀🚀 $NEAR
Alımlar üçün: Təsdiqlənmiş 4 saatlıq şamın $4.75-dən yuxarı bağlanması $5.00-a yol açır; ikinci dərəcəli swing hədəfləri $5.50 və $6.00-dadır.
Ayı / Geri Dönüş Ssenarisi: $4.75 səddinin qırılmaması qısamüddətli mənfəət götürmələrə səbəb ola bilər və növbəti yüksəliş cəhdi öncəsi qiyməti $4.10 – $4.20 dəstək zonasına doğru geri endirə bilər.
#Near #NEARUSDT #NEAR🚀🚀🚀 $NEAR
3
717
Daha çox kontent araşdırmaq üçün daxil olun
Binance Square-də qlobal kriptovalyuta istifadəçilərinə qoşulun
⚡️ Kriptovalyuta haqqında ən son və faydalı məlumatları əldə edin.
💬 Dünyanın ən böyük kriptovalyuta birjası tərəfindən etibar edilir.
👍 Doğrulanmış yaradıcılardan gələn real məlumatları kəşf edin.
E-poçt/Telefon nömrəsi
Trenddə olan mövzular
CircleMints500MUSDCOnSolana
4,794 baxış
Müzakirə edir: 279
💰 BÖYÜK: Circle Solanada $500M $USDC mint etdi!
Circle cəmi 2 tranzaksiyada ( $250M + $250M ) sentyabrın 25-də Solanada 500 Milyon $USDC mint edib — cəmi 5,5 saata! 🚀
Solanada indi $7.48B+ $USDC üstünlüyü var — $14.7B stabilkoin təchizatının 50%-dən çoxu.
Niyə Solana?
⚡️ Sürət: 65k TPS
💸 Aşağı komissiya: $0.00025
🔥 DeFi Mərkəzi: Jupiter, Raydium yüksəlir
Bu, ən böyük tək günlük mintlərdən biridir & Solana ekosistemi üçün GÜCLÜ institusional tələbin siqnaldır.
$SOL üçün bullish? 👇
#Circle #USDC #Solana #Stablecoin #DeFi#circlemints500musdconsolana
True News
·8 bəyənmə
·3.7k baxış
PolymarketBankFailureBetsDrawFDICConcern
17,350 baxış
Müzakirə edir: 511
BlackRockBuildsTokenizedPortfoliosForOndo
13,281 baxış
Müzakirə edir: 351