🚨 ETHEREUM ($ETH ) SLIDES HARD: SELLERS DOMINATE AS KEY SUPPORT GIVES WAY 📉🔥
$ETH | ETH/USDT
💰 Price: 1,596.71
📉 24H Change: -9.45%
📊 24H High: 1,770.55
📉 24H Low: 1,581.47
💵 24H Volume (USDT): 1.07B
🪙 24H Volume (ETH): 636,682.43
⚠️ Market Breakdown (1H Timeframe):
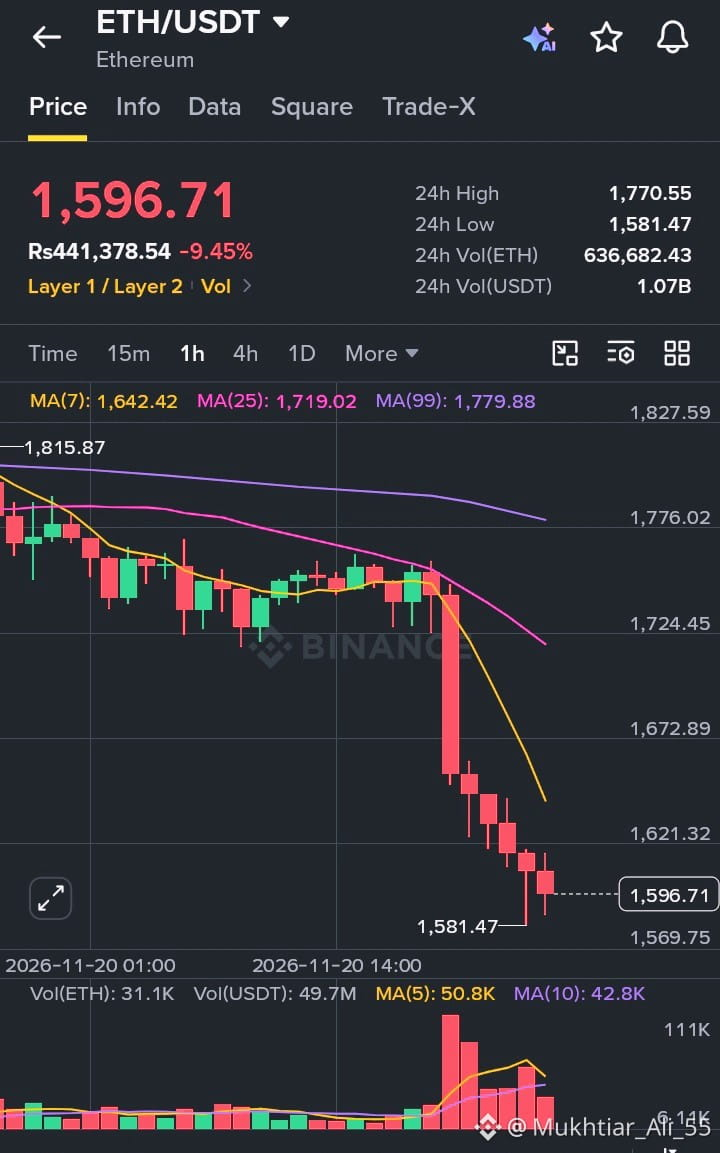
Ethereum spent hours consolidating in the 1,700 – 1,740 range before a heavy sell-off took over 🧨
🔻 One large bearish candle sliced through the entire consolidation zone
🔻 The rejection came near the 1,815 area, and sellers have controlled the trend since
🔻 Several consecutive red candles followed, with only a small wick near 1,581 hinting at buyers testing the waters 🧲
📉 Moving Averages Tell the Story:
📌 MA(7): 1,642.42
📌 MA(25): 1,719.02
📌 MA(99): 1,779.88
❌ Price is trading below all three major MAs
❌ All of them are sloping downward
❌ The gap between price and the MA(7) shows how stretched this move is 🐻
📊 Volume Insight:
🔴 Volume exploded on the breakdown candle
💥 This suggests aggressive selling and likely forced liquidations
🔴 Volume stayed elevated on the following red candles, so selling pressure hasn’t faded yet
⚠️ Expect volatility to remain high
🧠 What This Means:
This drop wasn’t random ❌
A tight range gave way on heavy volume, which often points to a leverage flush.
🔹 Short-term trend: Bearish
🔹 Momentum: Weak, no confirmed bounce yet
🔹 Market sentiment: Fearful 😨
🎯 Key Levels to Watch:
🟢 Support: 1,570 – 1,580 zone
🔴 Resistance: 1,640 – 1,720 zone
📌 A reclaim of 1,642 (MA7) would be the first sign of relief
📌 A clean break below 1,581 could open the door to deeper downside ⬇️
💡 Final Take:
ETH is in a high-volatility phase where patience beats prediction. Wait for confirmation, keep position sizes sensible, and protect your capital with a stop-loss. 🧘🛡️
Discipline matters more than chasing every candle 💎
#Ethereum #ETH #CryptoAnalysis #ETHUSDT #CryptoTrading
$ETH
$ETH | ETH/USDT
💰 Price: 1,596.71
📉 24H Change: -9.45%
📊 24H High: 1,770.55
📉 24H Low: 1,581.47
💵 24H Volume (USDT): 1.07B
🪙 24H Volume (ETH): 636,682.43
⚠️ Market Breakdown (1H Timeframe):
Ethereum spent hours consolidating in the 1,700 – 1,740 range before a heavy sell-off took over 🧨
🔻 One large bearish candle sliced through the entire consolidation zone
🔻 The rejection came near the 1,815 area, and sellers have controlled the trend since
🔻 Several consecutive red candles followed, with only a small wick near 1,581 hinting at buyers testing the waters 🧲
📉 Moving Averages Tell the Story:
📌 MA(7): 1,642.42
📌 MA(25): 1,719.02
📌 MA(99): 1,779.88
❌ Price is trading below all three major MAs
❌ All of them are sloping downward
❌ The gap between price and the MA(7) shows how stretched this move is 🐻
📊 Volume Insight:
🔴 Volume exploded on the breakdown candle
💥 This suggests aggressive selling and likely forced liquidations
🔴 Volume stayed elevated on the following red candles, so selling pressure hasn’t faded yet
⚠️ Expect volatility to remain high
🧠 What This Means:
This drop wasn’t random ❌
A tight range gave way on heavy volume, which often points to a leverage flush.
🔹 Short-term trend: Bearish
🔹 Momentum: Weak, no confirmed bounce yet
🔹 Market sentiment: Fearful 😨
🎯 Key Levels to Watch:
🟢 Support: 1,570 – 1,580 zone
🔴 Resistance: 1,640 – 1,720 zone
📌 A reclaim of 1,642 (MA7) would be the first sign of relief
📌 A clean break below 1,581 could open the door to deeper downside ⬇️
💡 Final Take:
ETH is in a high-volatility phase where patience beats prediction. Wait for confirmation, keep position sizes sensible, and protect your capital with a stop-loss. 🧘🛡️
Discipline matters more than chasing every candle 💎
#Ethereum #ETH #CryptoAnalysis #ETHUSDT #CryptoTrading
$ETH