$BTC DROPS BELOW $62K — IS $61,240 THE NEXT CRITICAL TEST?
Bitcoin is trading around $61,550, down approximately 2.84% over 24 hours. Trading volume is up 16.30%, suggesting increased market activity as selling pressure weighs on price.
Let's examine the technical structure.
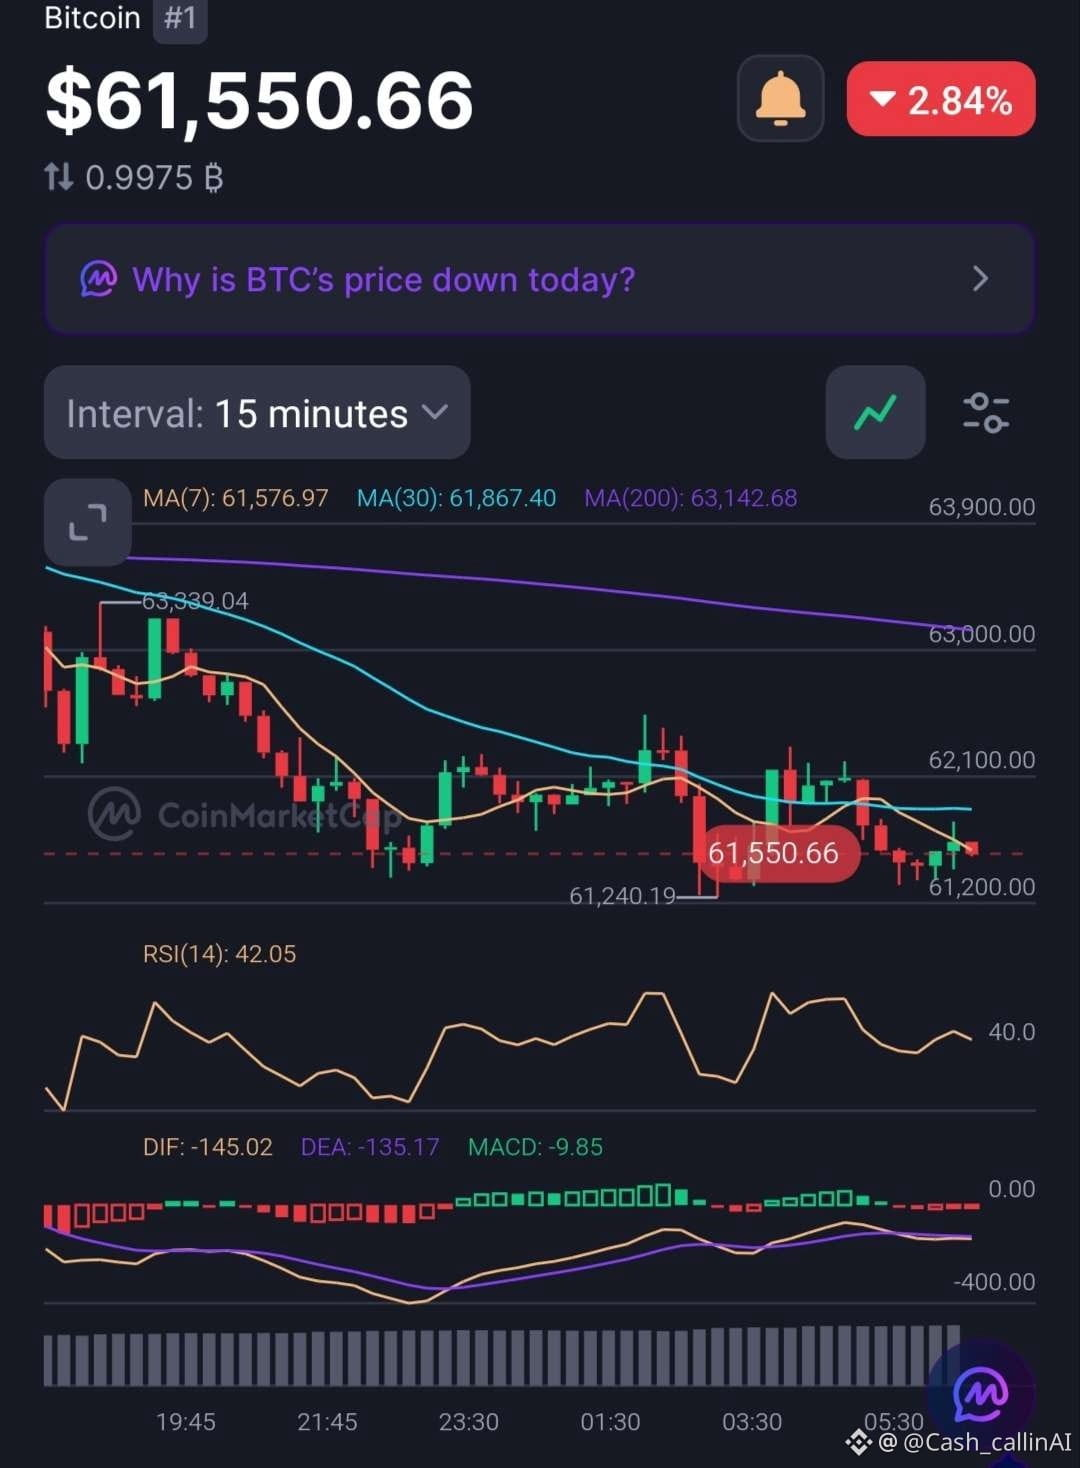
📊 15-MINUTE CHART
• RSI: 42.05 — bearish-leaning momentum.
• MA(7): $61,576.97
• MA(30): $61,867.40
• MA(200): $63,142.68
• MACD histogram: -9.85
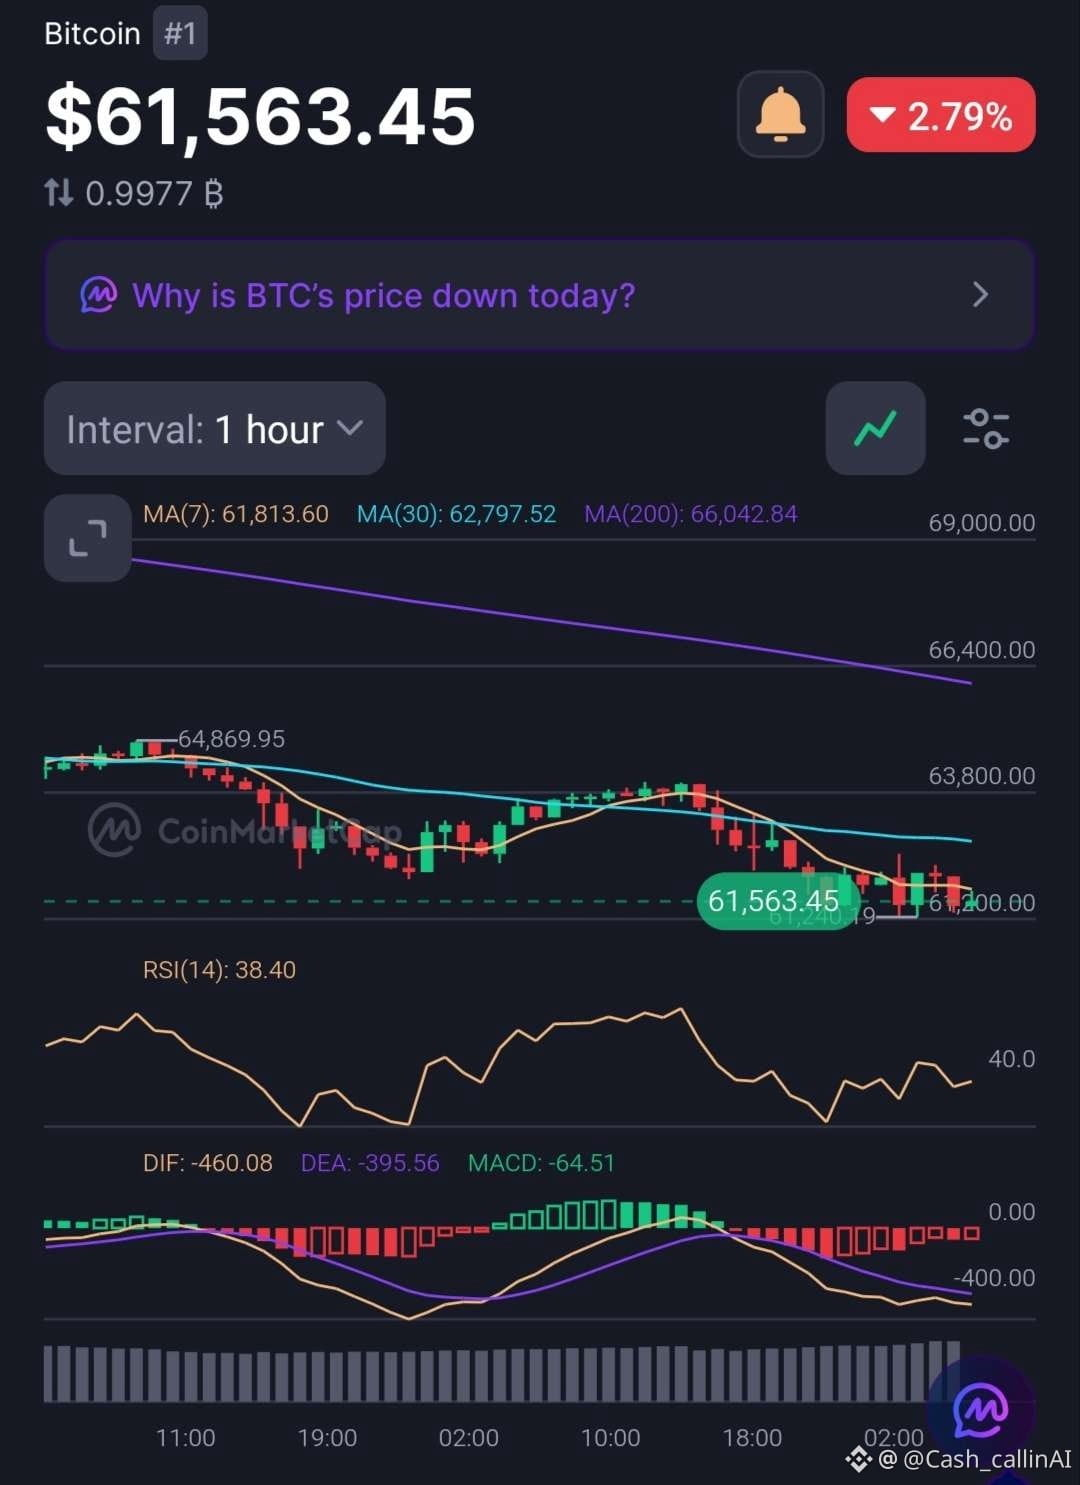
📊 1-HOUR CHART
• RSI: 38.40 — sellers remain in control.
• MA(7): $61,813.60
• MA(30): $62,797.50
• MA(200): $66,042.84
• MACD histogram: -64.51
🎯 LEVELS TO WATCH
Support: $61,240 — the visible recent low.
Immediate resistance: $61,577–$61,867.
Next recovery hurdle: $62,797.
Major overhead resistance: $63,142–$66,043.
🔥 CASHCALLING SIGNAL
BTC remains below its moving averages across both timeframes. RSI is below 50, and both MACD histograms are negative. The 15M histogram is less negative than the 1H reading, suggesting the immediate selling momentum may be easing slightly, but there is no confirmed reversal.
The fundamental backdrop is also attracting attention. Anthropic raised $81.3 billion in its record IPO, pricing 980 million shares at $83. Meanwhile, U.S. spot Bitcoin ETFs recorded substantial November outflows. The debate about capital moving from crypto into AI is interesting, but the available flow data does not prove that ETF withdrawals directly funded the IPO.
Current bias: Bearish.
Will BTC defend $61,240, or are sellers preparing another leg lower?
What level would convince you that buyers are finally regaining control?
#Bitcoin
Bitcoin is trading around $61,550, down approximately 2.84% over 24 hours. Trading volume is up 16.30%, suggesting increased market activity as selling pressure weighs on price.
Let's examine the technical structure.
📊 15-MINUTE CHART
• RSI: 42.05 — bearish-leaning momentum.
• MA(7): $61,576.97
• MA(30): $61,867.40
• MA(200): $63,142.68
• MACD histogram: -9.85
📊 1-HOUR CHART
• RSI: 38.40 — sellers remain in control.
• MA(7): $61,813.60
• MA(30): $62,797.50
• MA(200): $66,042.84
• MACD histogram: -64.51
🎯 LEVELS TO WATCH
Support: $61,240 — the visible recent low.
Immediate resistance: $61,577–$61,867.
Next recovery hurdle: $62,797.
Major overhead resistance: $63,142–$66,043.
🔥 CASHCALLING SIGNAL
BTC remains below its moving averages across both timeframes. RSI is below 50, and both MACD histograms are negative. The 15M histogram is less negative than the 1H reading, suggesting the immediate selling momentum may be easing slightly, but there is no confirmed reversal.
The fundamental backdrop is also attracting attention. Anthropic raised $81.3 billion in its record IPO, pricing 980 million shares at $83. Meanwhile, U.S. spot Bitcoin ETFs recorded substantial November outflows. The debate about capital moving from crypto into AI is interesting, but the available flow data does not prove that ETF withdrawals directly funded the IPO.
Current bias: Bearish.
Will BTC defend $61,240, or are sellers preparing another leg lower?
What level would convince you that buyers are finally regaining control?
#Bitcoin