
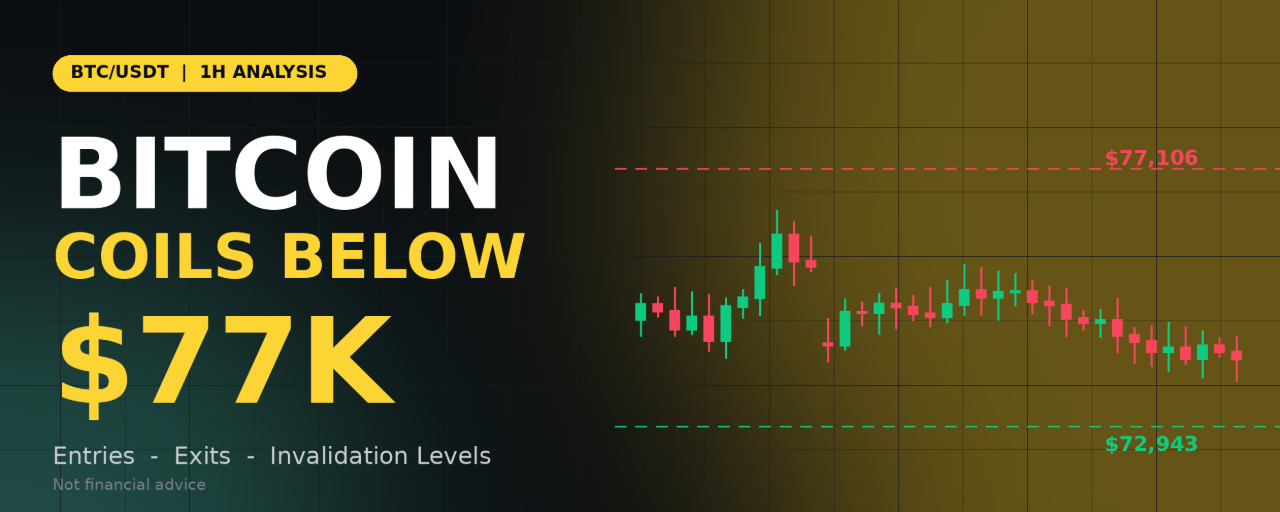


Bitcoin is trading near $75,609, locked in a tight consolidation after one of the sharpest rejections of the month. The market printed a Higher High near $81,000 on November 5, then dropped hard and has since been drifting sideways. Quiet price action after a violent move is rarely the end of the story. This article maps the levels that matter and the scenarios traders should be ready for.
What the 1H Chart Is Telling Us
Structure is still technically intact, but momentum has shifted. The chart shows a sequence of Higher Low, Lower High, Higher High, and then a new Higher Low near $74,700. The latest Higher Low is the most important swing point on the chart. As long as it holds, buyers still have a structural argument. If it breaks, the structure flips bearish.
The rejection from $81K was aggressive. The drop from the Higher High came in one strong red move, leaving a stack of bearish Fair Value Gaps (FVGs) between roughly $77,100 and $79,000. These imbalances act as supply zones. Price tends to revisit them before deciding on direction.
Price sits below the 38.2% Fibonacci retracement. Measured from the Higher Low (about $74,700) to the Higher High (about $81,000), the key retracement levels are:
38.2% near $77,100 (also a major horizontal level) 50% near $77,850 61.8% near $78,600
Bitcoin has failed to reclaim even the 38.2% level. That is a sign of weak recovery strength.
A tight range is building energy. Price is compressing between about $75,300 and $76,100, with small FVGs forming inside the range. Compression like this usually resolves with an expansion move.
Key Levels to Watch $81,582 – Major resistance. Macro ceiling and the area where the last rally failed. $80,018 – Resistance. Previous breakdown zone and the top of the supply area. $77,106 – Pivot resistance. The 38.2% Fib and the level bulls must reclaim. $75,000 – Psychological support. Sits just above the Higher Low. $74,700 – Structural support. The swing low that protects bullish structure. $72,943 – Major support. The next strong demand zone, marked by the green line. Trade Scenarios Scenario A: Short the Rejection (Primary Setup)
The higher-probability idea while price stays below $77,106 is to sell strength into resistance rather than chase weakness.
Entry: $76,600 to $77,100 on a retest with a visible rejection (upper wicks, bearish 1H close) Stop loss: $77,900 (above the 50% Fib and the FVG cluster) Take profit 1: $75,300 Take profit 2: $74,700 Take profit 3: $72,950
Risk to reward from the middle of the entry zone to the second target is roughly 1:2, improving to better than 1:3 if the third target is reached.
Scenario B: Breakdown Continuation Short
If the range collapses, momentum traders can join the move.
Trigger: A 1H candle close below $74,700 Entry: $74,500 to $74,700 (preferably on a retest of the broken level from below) Stop loss: $75,500 Take profit 1: $73,800 Take profit 2: $72,950
A clean break of the Higher Low would signal a structural shift and open the path to the $72.9K demand zone.
Scenario C: Support Bounce Long
Buyers become interesting only near strong demand.
Entry: $72,900 to $73,400, only after a rejection or reclaim (a wick below support that closes back above it) Stop loss: $72,300 Take profit 1: $74,700 Take profit 2: $75,800 Scenario D: Bullish Reclaim Long
The bullish case needs proof first.
Trigger: Two consecutive 1H closes above $77,106 Entry: Retest of $77,100 to $77,300 holding as support Stop loss: $76,400 Take profit 1: $78,600 Take profit 2: $80,000 Take profit 3: $81,500
If price pushes through $77,106 and then $77,900, the bearish FVG zone is being absorbed and the Higher High at $81K comes back into play.
Invalidation: When to Step Aside The short idea is invalid if price closes above $77,900 on the 1H chart. The bullish structure is invalid if price closes below $74,700. If price stays inside $75,300 to $76,100, the best trade is often no trade. Let the range break first. Risk Management Rules Risk 1% to 2% of your account per trade at most. Use stop losses on every position. Do not move them further away. Take partial profits at the first target and move the stop to break-even. Avoid high leverage in a compression range. Fake breakouts are common before the real move. Watch for volatility around major US economic news and weekend liquidity gaps. Final Thoughts
Bitcoin is at a decision point. Below $77,106 the bias leans cautious, with rallies likely to meet supply. A loss of $74,700 would confirm weakness and target $72,943. A reclaim of $77,106 would shift momentum back toward the bulls. Patience and discipline matter more than prediction here. Let the levels do the talking and trade the reaction, not the guess.
Disclaimer: This article is for educational and informational purposes only and is not financial advice. Cryptocurrency trading carries a high level of risk and may not be suitable for all investors. Entry and exit levels are based on technical analysis of a single chart and can fail. Always do your own research and never risk more than you can afford to lose.
@Binance Square Official #BinanceReopensWithdrawalsForHYPE&APT #SouthKoreaDraftLawTargets15To20%ShareholderCap #TradFiForBeginners #Binance #ChartSniper