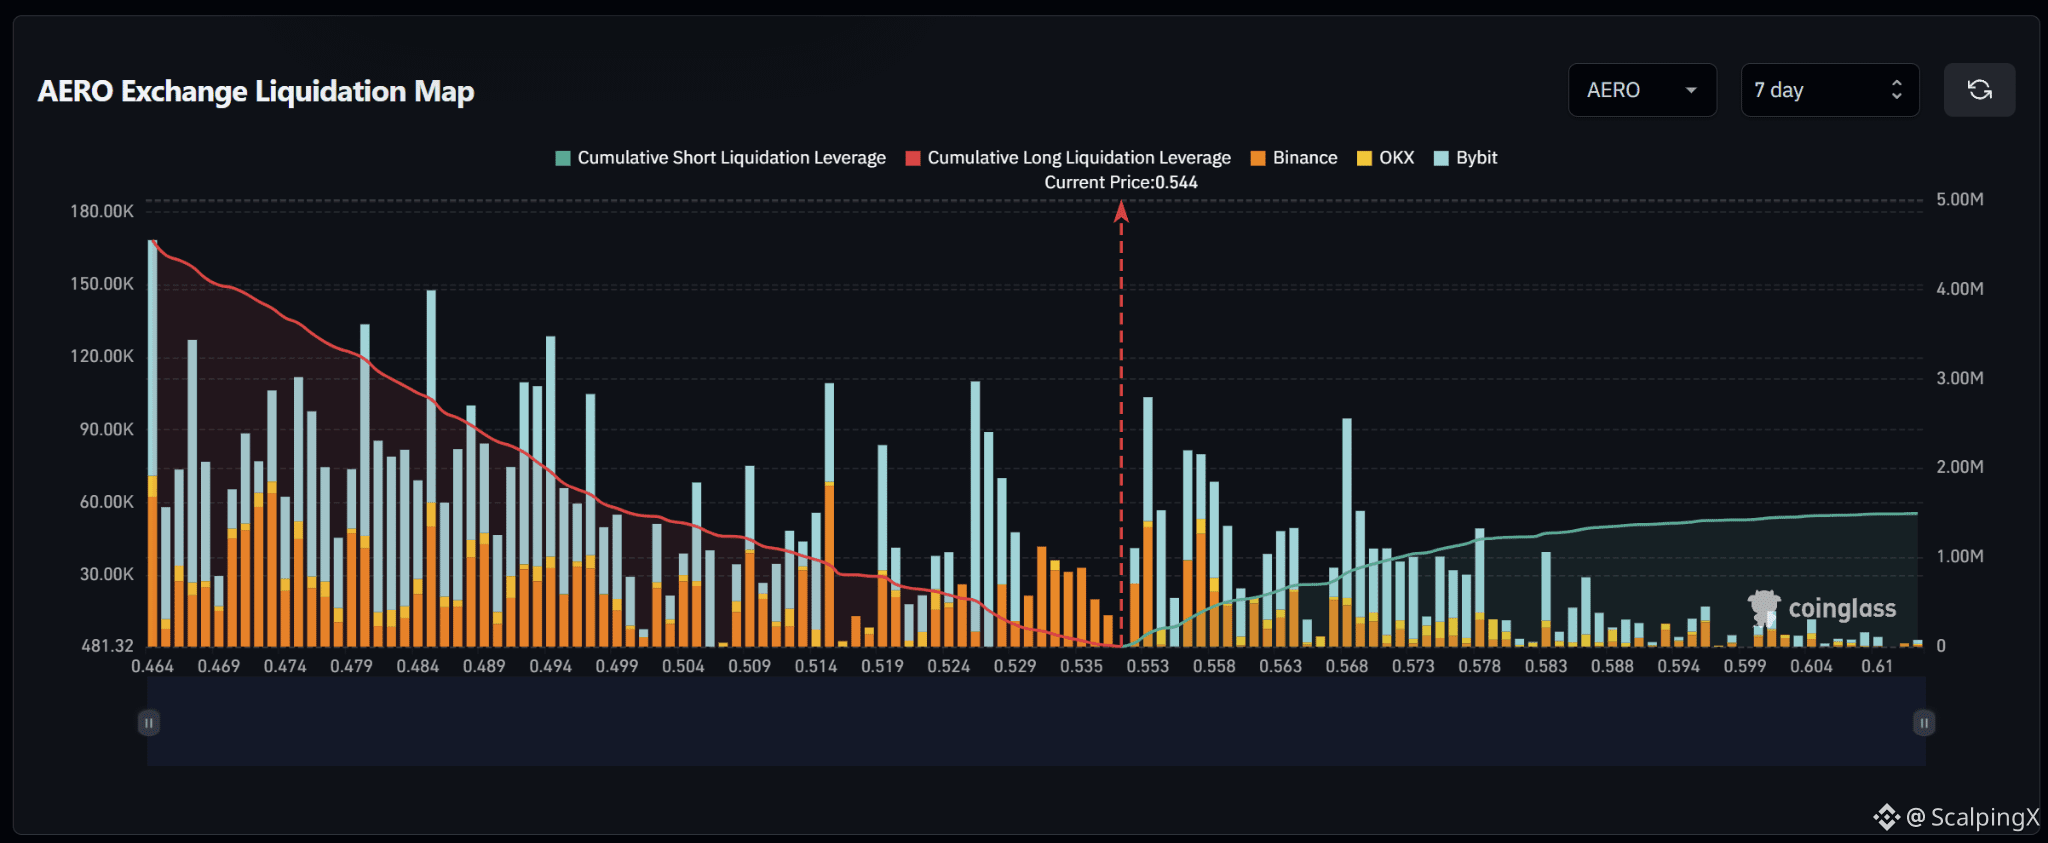
$AERO – Liquidation Map (7 Days) – Current Price 0.544
🔎 The 7-day liquidation map shows roughly $4.5–4.6 million in long liquidations below the current price, clearly exceeding approximately $1.5 million in short liquidations above. The liquidity structure therefore strongly favors the downside, with around three times more cumulative liquidity below the market.
📉 Below the market, nearby long-liquidation liquidity remains relatively thin around 0.535–0.529 before increasing across 0.524–0.514. Notable clusters appear near 0.514 and 0.484–0.494, while the largest deeper bar around 0.464 reaches nearly $170,000. Losing 0.535 would shift attention toward 0.529–0.524.
📈 Above the market, short-liquidation liquidity begins building from 0.553 and becomes denser across 0.553–0.578. A notable cluster near 0.553 reaches roughly $100,000, while 0.568 contains a bar close to $95,000. Further out, liquidity remains distributed toward 0.583–0.599 but gradually becomes thinner.
🧭 The broader setup favors the downside because long-liquidation exposure below is roughly three times larger. Losing 0.535 would increase the probability of a sweep toward 0.529–0.524, while breaking above 0.553 would shift attention toward 0.558–0.568.
🔎 The 7-day liquidation map shows roughly $4.5–4.6 million in long liquidations below the current price, clearly exceeding approximately $1.5 million in short liquidations above. The liquidity structure therefore strongly favors the downside, with around three times more cumulative liquidity below the market.
📉 Below the market, nearby long-liquidation liquidity remains relatively thin around 0.535–0.529 before increasing across 0.524–0.514. Notable clusters appear near 0.514 and 0.484–0.494, while the largest deeper bar around 0.464 reaches nearly $170,000. Losing 0.535 would shift attention toward 0.529–0.524.
📈 Above the market, short-liquidation liquidity begins building from 0.553 and becomes denser across 0.553–0.578. A notable cluster near 0.553 reaches roughly $100,000, while 0.568 contains a bar close to $95,000. Further out, liquidity remains distributed toward 0.583–0.599 but gradually becomes thinner.
🧭 The broader setup favors the downside because long-liquidation exposure below is roughly three times larger. Losing 0.535 would increase the probability of a sweep toward 0.529–0.524, while breaking above 0.553 would shift attention toward 0.558–0.568.