

Market Thesis:
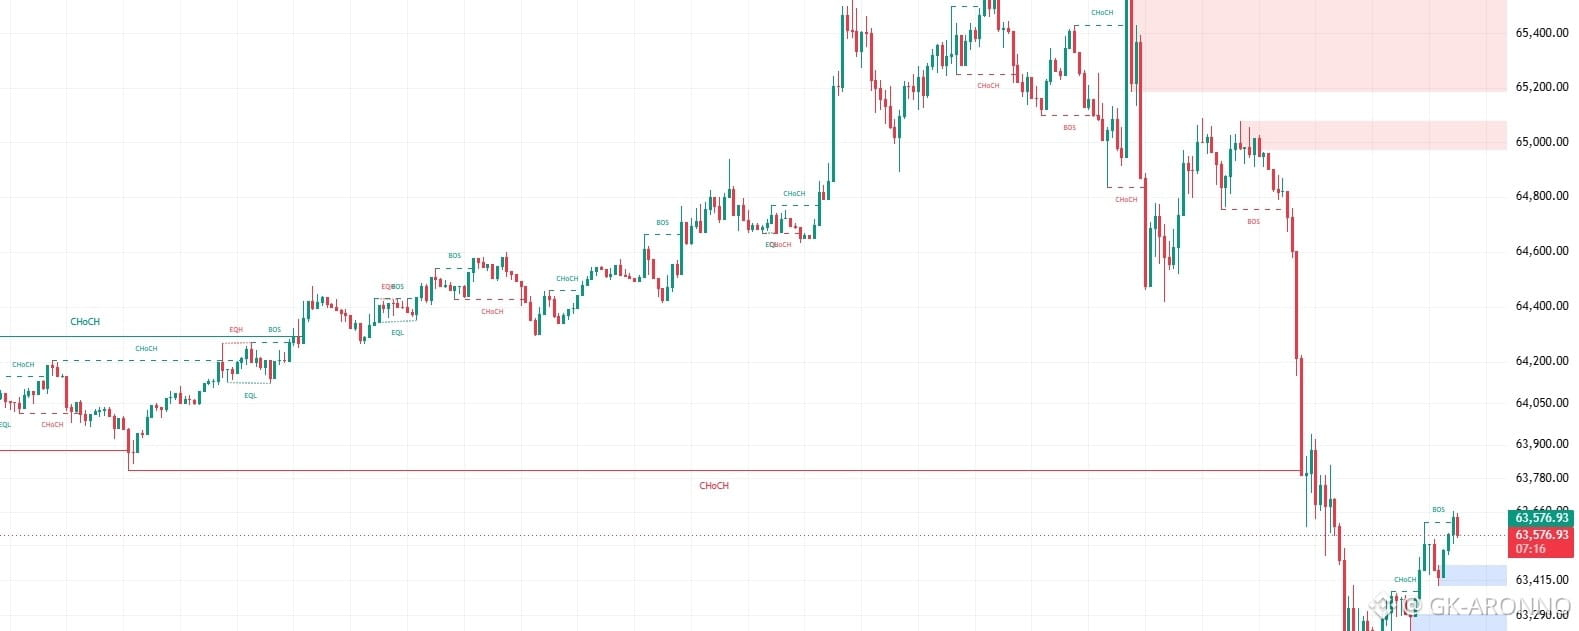
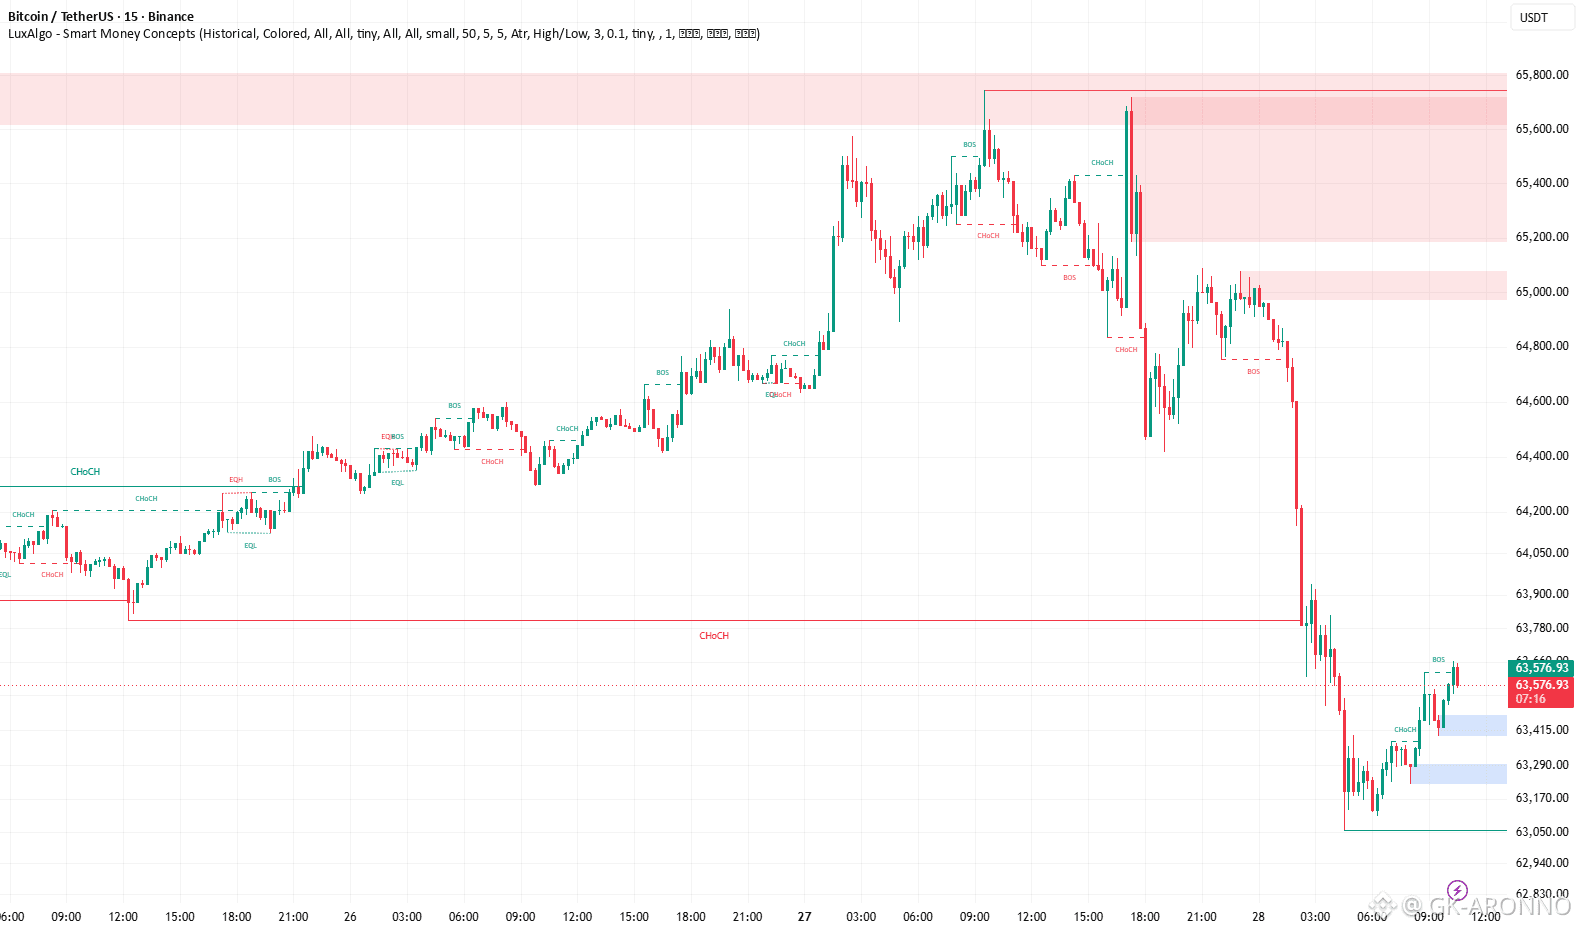
BTCUSDT on the 15-minute chart is attempting a short-term bullish recovery after sweeping into the visible 63,050 weak low and printing a bullish CHoCH followed by BOS. However, the broader intraday order flow remains bearish while price trades below the key 63,780 structure level and the overhead supply zones.
The immediate question is whether buyers can reclaim 63,780 or whether the current rebound is simply a corrective move before continuation lower.
Visible Confluences (15-Minute):
Bullish CHoCH formed near 63,350, signaling the first local shift in order flow.
Bullish BOS confirmed near 63,620, supporting short-term upside continuation.
Current price is approximately 63,648, directly below the major 63,780 structural resistance.
Nearest visible demand zone: 63,390–63,460.
Secondary visible demand zone: 63,220–63,290.
Clearly marked weak low and liquidity objective at 63,050.
First overhead supply zone: 64,980–65,080.
Major supply region: approximately 65,180–65,700.
Strong high and upper liquidity reference: approximately 65,740.
The preceding bearish displacement and bearish BOS near 64,760 show that the larger intraday bearish structure has not yet been fully invalidated.
Trade Scenarios:
Setup 1: Bullish Pullback Continuation
Direction: Buy
Entry Zone: 63,390–63,460
Trigger: LTF bullish CHoCH, rejection candle, or strong bullish momentum close from the zone
Stop Loss: 63,315
TP1: 63,648
TP2: 63,780
TP3: 64,050
This setup follows the newly established local bullish structure. The trade is invalidated if price loses the demand zone and closes decisively below 63,315.
Setup 2: Confirmed Breakout Long
Direction: Buy
Entry Zone: 63,760–63,800
Trigger: A 15-minute close above 63,780, followed by a successful LTF retest and bullish continuation candle
Stop Loss: 63,620
TP1: 64,050
TP2: 64,200
TP3: 64,480
This is the safer bullish scenario because it requires price to reclaim the visible structural resistance rather than buying directly underneath it.
Setup 3: Bearish Rejection
Direction: Sell
Entry Zone: 63,740–63,800
Trigger: Liquidity sweep above 63,780 followed by an LTF bearish CHoCH or strong bearish displacement candle
Stop Loss: 63,875
TP1: 63,460
TP2: 63,290
TP3: 63,050
This setup aligns with the broader bearish intraday structure. A sustained acceptance above 63,800 weakens the bearish thesis.
Refinement Tip:
For the best risk-to-reward profile, monitor the identified 15-minute zones on the 1-minute, 3-minute, or 5-minute chart. Require confirmation through an LTF CHoCH, momentum displacement, or a clean rejection-and-retest sequence before execution. Avoid entering in the middle of the range without structural confirmation.
⚠️ Disclaimer:
Trading financial markets involves significant risk, and no setup carries a guaranteed outcome. This analysis reflects the visible market structure and LuxAlgo signals on the provided chart at a specific moment in time. It is strictly for educational and analytical purposes and should not be treated as personalized financial advice. Always define risk before entry and use position sizing appropriate to your own strategy.
