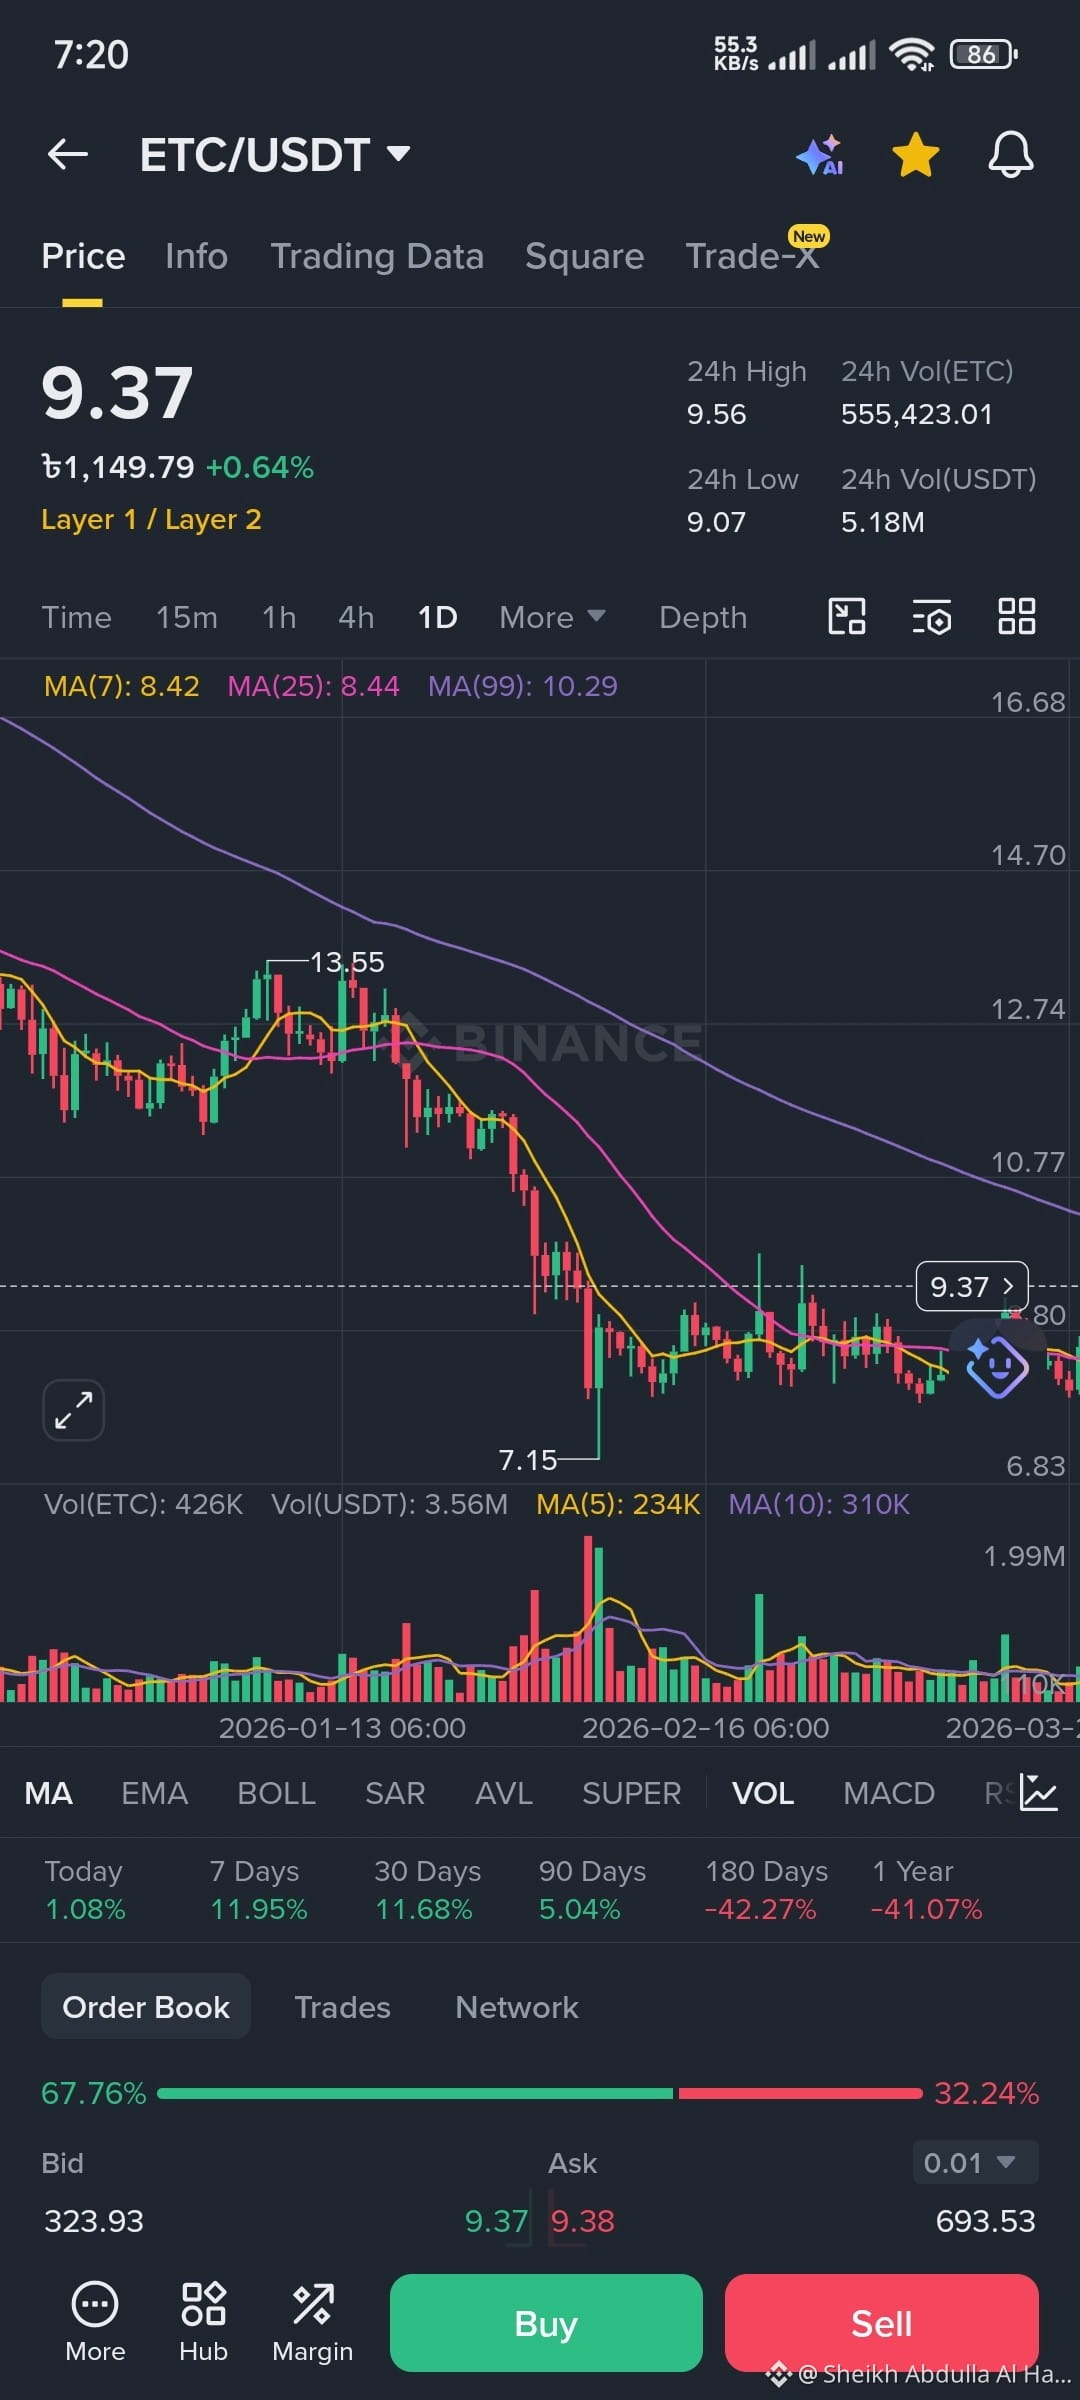
Current Price and Performance
Price: The current price is 9.37 USDT.
Daily Change: It is up slightly by +0.64% (indicated by the green text).
24h Range: The price has fluctuated between a low of 9.07 and a high of 9.56.
Volume: The 24-hour volume is roughly 5.18M USDT, which is relatively moderate for this asset.
2. Moving Averages (MA)
The chart uses three main Moving Averages to show trends:
MA(7) - Yellow: 8.42
MA(25) - Pink: 8.44
MA(99) - Purple: 10.29
Analysis: The price (9.37) is currently trading above the short-term averages (7 and 25) but below the long-term average (99). This suggests a short-term recovery or "relief rally" within a broader long-term downtrend.
3. Historical Trends & Support/Resistance
Major Drop: The chart shows a significant "crash" or downward move starting from a peak of 13.55 down to a local bottom of 7.15.
Consolidation: Since hitting that 7.15 low, the price has been "sideways," meaning it's moving horizontally as it tries to find a stable floor.
Long-term Outlook: The 180-day and 1-year performance stats at the bottom are heavily in the red (-42.27% and -41.07%), showing that the asset has lost nearly half its value over the last year.
4. Order Book & Sentiment
Buy/Sell Ratio: The bar above the "Bid/Ask" section shows 67.76% Buy vs. 32.24% Sell.
Interpretation: There is currently more buying pressure (demand) than selling pressure in the immediate order book, which often precedes a short-term price increase. $ETH $BTC
Price: The current price is 9.37 USDT.
Daily Change: It is up slightly by +0.64% (indicated by the green text).
24h Range: The price has fluctuated between a low of 9.07 and a high of 9.56.
Volume: The 24-hour volume is roughly 5.18M USDT, which is relatively moderate for this asset.
2. Moving Averages (MA)
The chart uses three main Moving Averages to show trends:
MA(7) - Yellow: 8.42
MA(25) - Pink: 8.44
MA(99) - Purple: 10.29
Analysis: The price (9.37) is currently trading above the short-term averages (7 and 25) but below the long-term average (99). This suggests a short-term recovery or "relief rally" within a broader long-term downtrend.
3. Historical Trends & Support/Resistance
Major Drop: The chart shows a significant "crash" or downward move starting from a peak of 13.55 down to a local bottom of 7.15.
Consolidation: Since hitting that 7.15 low, the price has been "sideways," meaning it's moving horizontally as it tries to find a stable floor.
Long-term Outlook: The 180-day and 1-year performance stats at the bottom are heavily in the red (-42.27% and -41.07%), showing that the asset has lost nearly half its value over the last year.
4. Order Book & Sentiment
Buy/Sell Ratio: The bar above the "Bid/Ask" section shows 67.76% Buy vs. 32.24% Sell.
Interpretation: There is currently more buying pressure (demand) than selling pressure in the immediate order book, which often precedes a short-term price increase. $ETH $BTC