
#liquidationmap
liquidationmap
397,286 baxış
Müzakirə edir: 814
Populyar
Sonuncu

·
--
Artım
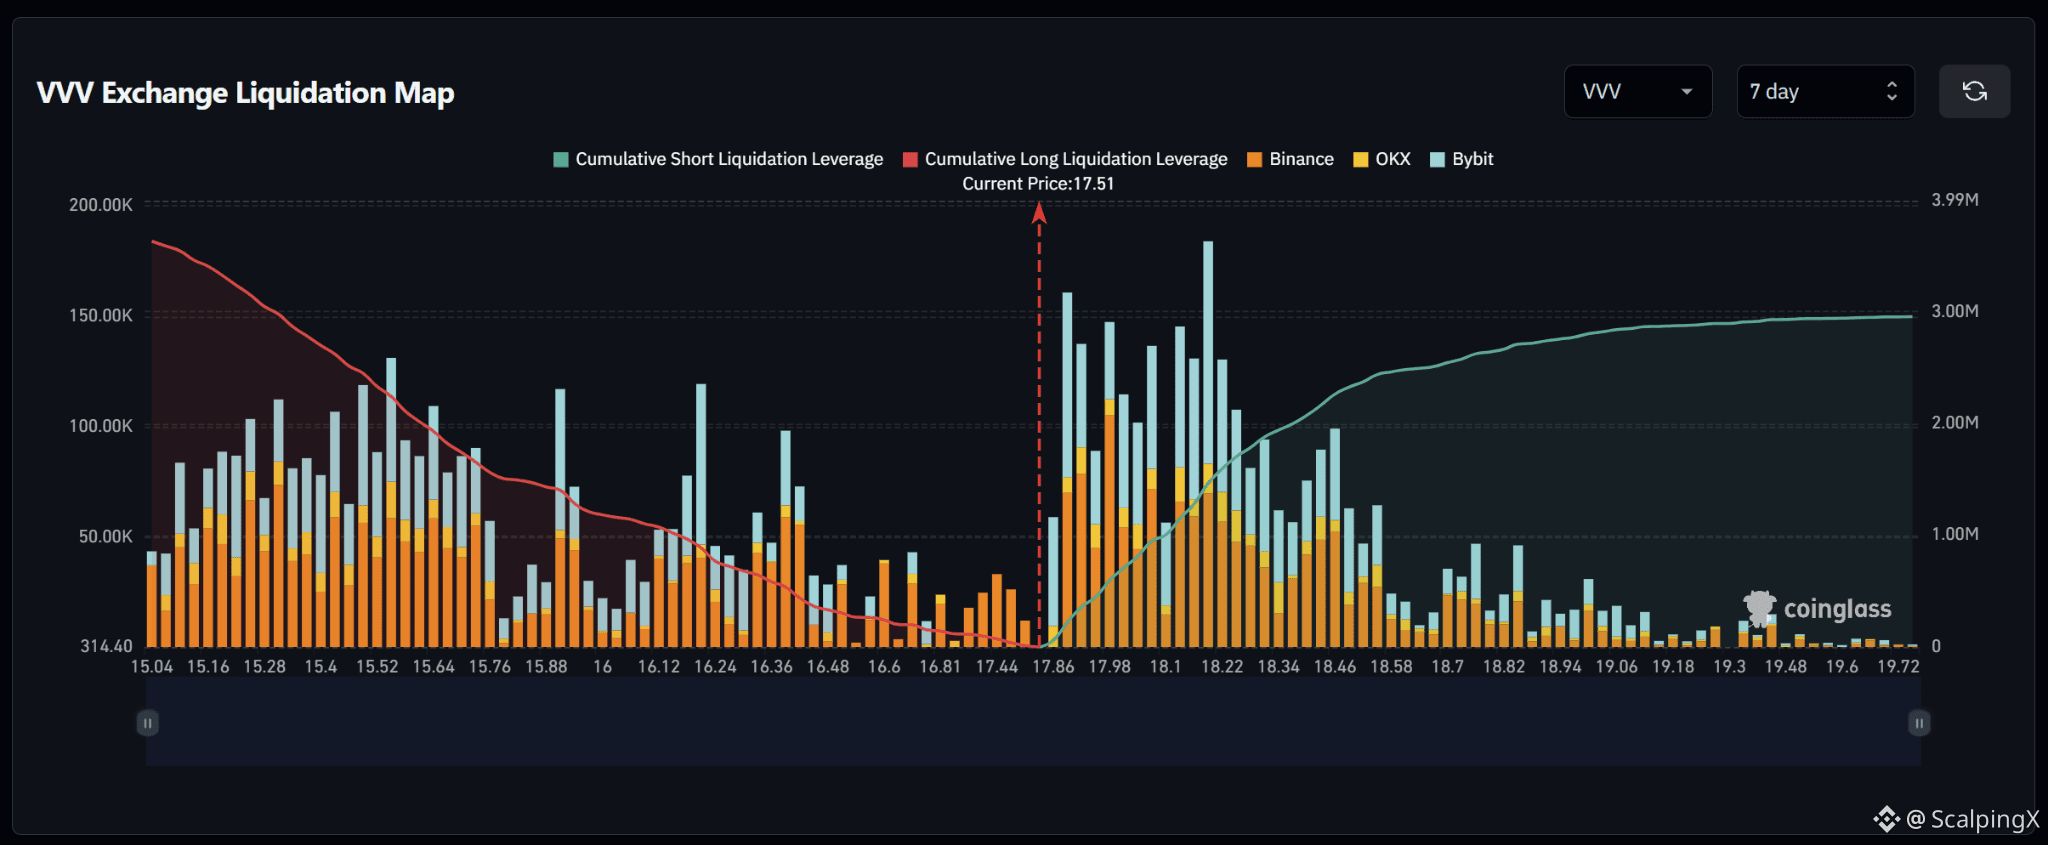
$VVV – Liquidation Map (7 Days) – Current Price 17.51
🔎 7 günlük likvidasiya xəritəsi hazırkı qiymətin altında təxminən 3.6 milyon dollar uzun likvidasiya göstərir; yuxarıda isə təxminən 3.0 milyon dollardan çox qısa likvidasiya var. Likvidlik strukturu nisbətən balanslıdır, amma məbləğcə aşağı tərəfə bir qədər meyllidir: bazarın altındakı kumulyativ likvidlik təxminən 1.2 dəfə daha çoxdur.
📉 Bazarın altında, yaxın uzun-likvidasiya likvidliyi 17.44–16.81 aralığında nisbətən incədir, sonra 16.60–16.24 aralığında artmağa başlayır. Diqqətəlayiq klasterlər 16.36 və 16.24 ətrafında görünür, likvidlik isə daha aşağıda 15.88–15.28 boyunca xeyli sıxlaşır. 17.44 itirilsə, diqqət 16.81–16.60 tərəfə yönələr.
📈 Bazarın üstündə, qısa-likvidasiya likvidliyi 17.86-dan başlayaraq kəskin şəkildə artmağa başlayır və 17.98–18.34 aralığında sıx olur. Ən güclü klaster 18.18–18.22 ətrafında yerləşir; burada likvidasiya barı təxminən 185,000 dollara yaxınlaşır. 17.86–18.10 və 18.34–18.46 aralıqları da nəzərə çarpan likvidlik ehtiva edir.
🧭 Daha geniş ssenari aşağı tərəfi azacıq üstün tutur, çünki aşağıda uzun-likvidasiya ekspozisiyası daha böyükdür. 17.44 itirilsə, 16.81–16.60 istiqamətində sweep ehtimalı artar; 17.86-nı isə qırmaq diqqəti 17.98–18.22 tərəfə yönəldər.
#LiquidationMap
$VVV – Liquidation Map (7 Days) – Current Price 17.51
🔎 7 günlük likvidasiya xəritəsi hazırkı qiymətin altında təxminən 3.6 milyon dollar uzun likvidasiya göstərir; yuxarıda isə təxminən 3.0 milyon dollardan çox qısa likvidasiya var. Likvidlik strukturu nisbətən balanslıdır, amma məbləğcə aşağı tərəfə bir qədər meyllidir: bazarın altındakı kumulyativ likvidlik təxminən 1.2 dəfə daha çoxdur.
📉 Bazarın altında, yaxın uzun-likvidasiya likvidliyi 17.44–16.81 aralığında nisbətən incədir, sonra 16.60–16.24 aralığında artmağa başlayır. Diqqətəlayiq klasterlər 16.36 və 16.24 ətrafında görünür, likvidlik isə daha aşağıda 15.88–15.28 boyunca xeyli sıxlaşır. 17.44 itirilsə, diqqət 16.81–16.60 tərəfə yönələr.
📈 Bazarın üstündə, qısa-likvidasiya likvidliyi 17.86-dan başlayaraq kəskin şəkildə artmağa başlayır və 17.98–18.34 aralığında sıx olur. Ən güclü klaster 18.18–18.22 ətrafında yerləşir; burada likvidasiya barı təxminən 185,000 dollara yaxınlaşır. 17.86–18.10 və 18.34–18.46 aralıqları da nəzərə çarpan likvidlik ehtiva edir.
🧭 Daha geniş ssenari aşağı tərəfi azacıq üstün tutur, çünki aşağıda uzun-likvidasiya ekspozisiyası daha böyükdür. 17.44 itirilsə, 16.81–16.60 istiqamətində sweep ehtimalı artar; 17.86-nı isə qırmaq diqqəti 17.98–18.22 tərəfə yönəldər.
#LiquidationMap
🔎 7 günlük likvidasiya xəritəsi hazırkı qiymətin altında təxminən 3.6 milyon dollar uzun likvidasiya göstərir; yuxarıda isə təxminən 3.0 milyon dollardan çox qısa likvidasiya var. Likvidlik strukturu nisbətən balanslıdır, amma məbləğcə aşağı tərəfə bir qədər meyllidir: bazarın altındakı kumulyativ likvidlik təxminən 1.2 dəfə daha çoxdur.
📉 Bazarın altında, yaxın uzun-likvidasiya likvidliyi 17.44–16.81 aralığında nisbətən incədir, sonra 16.60–16.24 aralığında artmağa başlayır. Diqqətəlayiq klasterlər 16.36 və 16.24 ətrafında görünür, likvidlik isə daha aşağıda 15.88–15.28 boyunca xeyli sıxlaşır. 17.44 itirilsə, diqqət 16.81–16.60 tərəfə yönələr.
📈 Bazarın üstündə, qısa-likvidasiya likvidliyi 17.86-dan başlayaraq kəskin şəkildə artmağa başlayır və 17.98–18.34 aralığında sıx olur. Ən güclü klaster 18.18–18.22 ətrafında yerləşir; burada likvidasiya barı təxminən 185,000 dollara yaxınlaşır. 17.86–18.10 və 18.34–18.46 aralıqları da nəzərə çarpan likvidlik ehtiva edir.
🧭 Daha geniş ssenari aşağı tərəfi azacıq üstün tutur, çünki aşağıda uzun-likvidasiya ekspozisiyası daha böyükdür. 17.44 itirilsə, 16.81–16.60 istiqamətində sweep ehtimalı artar; 17.86-nı isə qırmaq diqqəti 17.98–18.22 tərəfə yönəldər.
#LiquidationMap
86
·
--
Artım
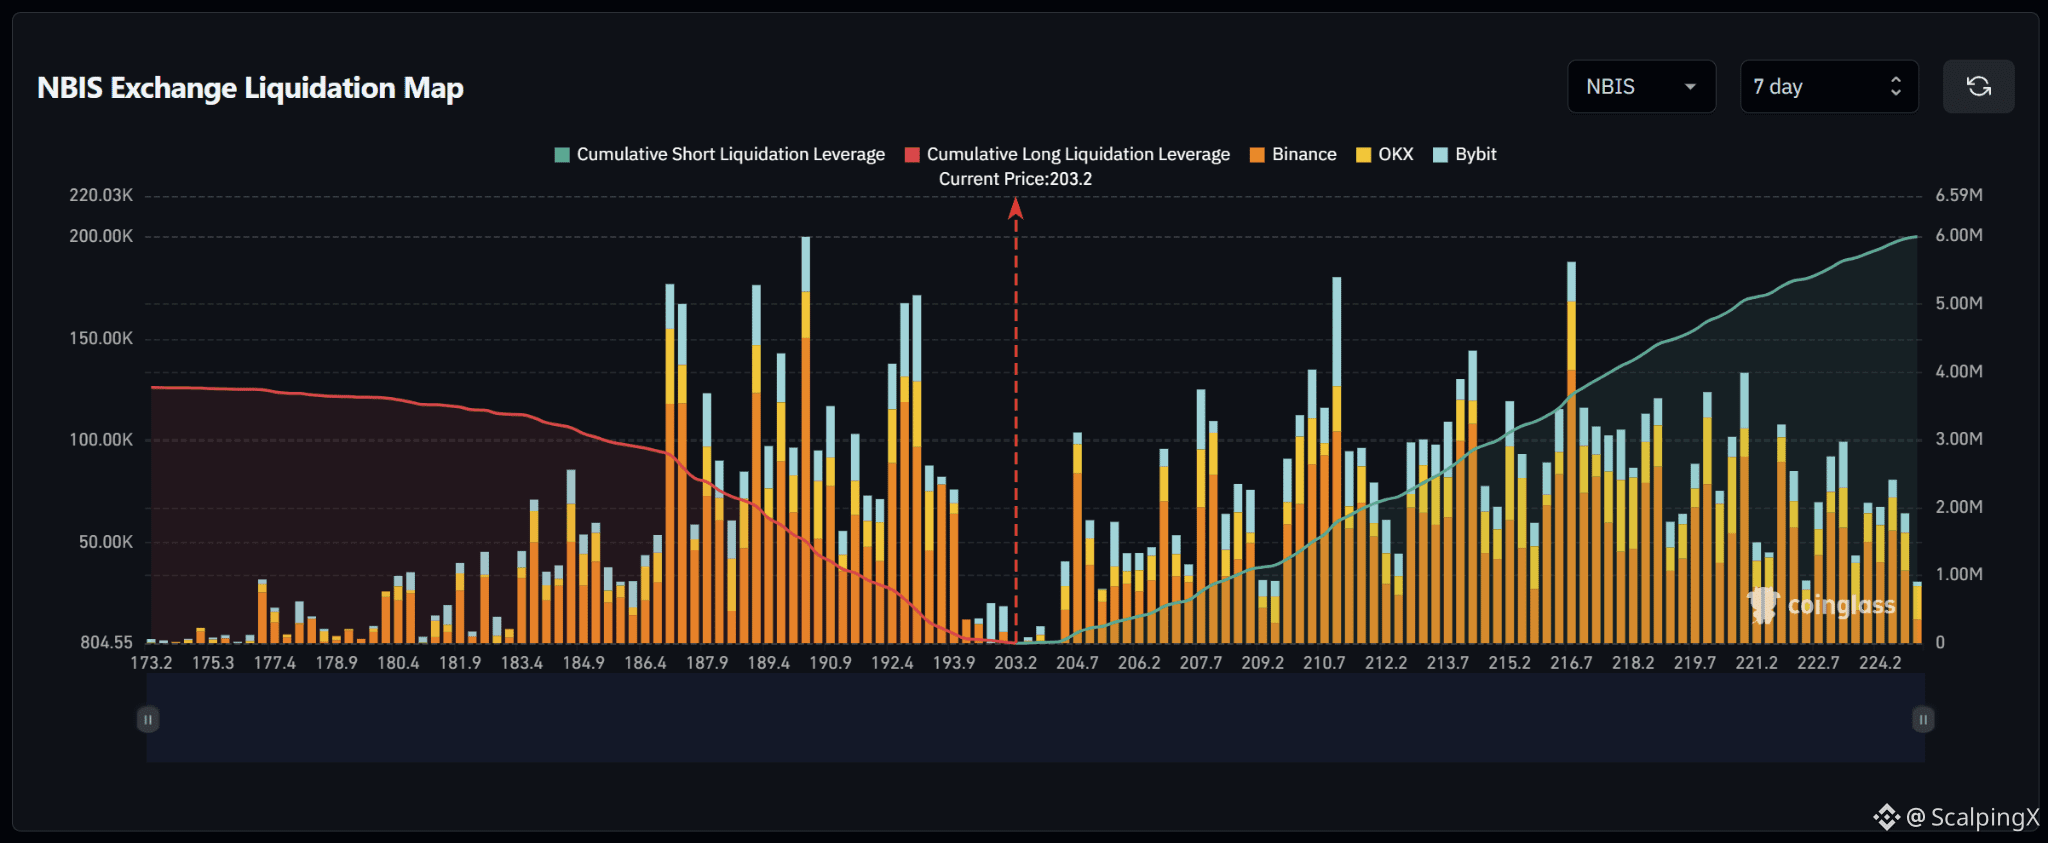
$NBIS – Ləğvetmə Xəritəsi (7 Gün) – Cari Qiymət 203.2
🔎 7 günlük ləğvetmə xəritəsi cari qiymətdən yuxarıda təxminən 6 milyon ABŞ dolları məbləğində qısa (short) ləğvetmələr göstərir; aşağıda isə təxminən 4 milyon məbləğində uzun (long) ləğvetmələri üstələyir. Likvidlik strukturu buna görə yüksəlişi dəstəkləyir: bazarın üstündə təxminən 1.5 dəfə daha çox məcmu likvidlik var.
📉 Bazarın alt hissəsində yaxın long-ləğvetmə likvidliyi 193.9–192.4 aralığında nisbətən incədir; sonra 190.9–186.4 boyunca kəskin şəkildə artır. Ən güclü klasterlər 190 və 187 ətrafında yerləşir; bir neçə bar təxminən $150,000–200,000-ə çatır. 193.9 itirilsə, diqqət 192.4–190.9 tərəfə yönələcək.
📈 Bazarın üstündə short-ləğvetmə likvidliyi 204.7-dən başlayaraq formalaşır və 207.7–212.2 aralığında artır. 210.7 yaxınlığındakı diqqətçəkən bir klaster demək olar ki, $180,000-ə çatır. Daha uzaqda likvidlik 213.7–218.2 aralığında sıx olaraq qalır; 216.7 səviyyəsi təxminən $190,000 yaxınlığında xüsusilə seçilir.
🧭 Ümumi quruluş yüksəlişə üstünlük verir, çünki yuxarıdakı short-ləğvetmə üzrə məruz qalma təxminən 1.5 dəfə böyükdür. 204.7 qırılarsa 207.7–212.2 istiqamətində süpürmə ehtimalı artar, 193.9 itirilsə isə diqqət 192.4–190.9 tərəfə keçər.
#LiquidationMap
$NBIS – Ləğvetmə Xəritəsi (7 Gün) – Cari Qiymət 203.2
🔎 7 günlük ləğvetmə xəritəsi cari qiymətdən yuxarıda təxminən 6 milyon ABŞ dolları məbləğində qısa (short) ləğvetmələr göstərir; aşağıda isə təxminən 4 milyon məbləğində uzun (long) ləğvetmələri üstələyir. Likvidlik strukturu buna görə yüksəlişi dəstəkləyir: bazarın üstündə təxminən 1.5 dəfə daha çox məcmu likvidlik var.
📉 Bazarın alt hissəsində yaxın long-ləğvetmə likvidliyi 193.9–192.4 aralığında nisbətən incədir; sonra 190.9–186.4 boyunca kəskin şəkildə artır. Ən güclü klasterlər 190 və 187 ətrafında yerləşir; bir neçə bar təxminən $150,000–200,000-ə çatır. 193.9 itirilsə, diqqət 192.4–190.9 tərəfə yönələcək.
📈 Bazarın üstündə short-ləğvetmə likvidliyi 204.7-dən başlayaraq formalaşır və 207.7–212.2 aralığında artır. 210.7 yaxınlığındakı diqqətçəkən bir klaster demək olar ki, $180,000-ə çatır. Daha uzaqda likvidlik 213.7–218.2 aralığında sıx olaraq qalır; 216.7 səviyyəsi təxminən $190,000 yaxınlığında xüsusilə seçilir.
🧭 Ümumi quruluş yüksəlişə üstünlük verir, çünki yuxarıdakı short-ləğvetmə üzrə məruz qalma təxminən 1.5 dəfə böyükdür. 204.7 qırılarsa 207.7–212.2 istiqamətində süpürmə ehtimalı artar, 193.9 itirilsə isə diqqət 192.4–190.9 tərəfə keçər.
#LiquidationMap
🔎 7 günlük ləğvetmə xəritəsi cari qiymətdən yuxarıda təxminən 6 milyon ABŞ dolları məbləğində qısa (short) ləğvetmələr göstərir; aşağıda isə təxminən 4 milyon məbləğində uzun (long) ləğvetmələri üstələyir. Likvidlik strukturu buna görə yüksəlişi dəstəkləyir: bazarın üstündə təxminən 1.5 dəfə daha çox məcmu likvidlik var.
📉 Bazarın alt hissəsində yaxın long-ləğvetmə likvidliyi 193.9–192.4 aralığında nisbətən incədir; sonra 190.9–186.4 boyunca kəskin şəkildə artır. Ən güclü klasterlər 190 və 187 ətrafında yerləşir; bir neçə bar təxminən $150,000–200,000-ə çatır. 193.9 itirilsə, diqqət 192.4–190.9 tərəfə yönələcək.
📈 Bazarın üstündə short-ləğvetmə likvidliyi 204.7-dən başlayaraq formalaşır və 207.7–212.2 aralığında artır. 210.7 yaxınlığındakı diqqətçəkən bir klaster demək olar ki, $180,000-ə çatır. Daha uzaqda likvidlik 213.7–218.2 aralığında sıx olaraq qalır; 216.7 səviyyəsi təxminən $190,000 yaxınlığında xüsusilə seçilir.
🧭 Ümumi quruluş yüksəlişə üstünlük verir, çünki yuxarıdakı short-ləğvetmə üzrə məruz qalma təxminən 1.5 dəfə böyükdür. 204.7 qırılarsa 207.7–212.2 istiqamətində süpürmə ehtimalı artar, 193.9 itirilsə isə diqqət 192.4–190.9 tərəfə keçər.
#LiquidationMap
19
·
--
Artım
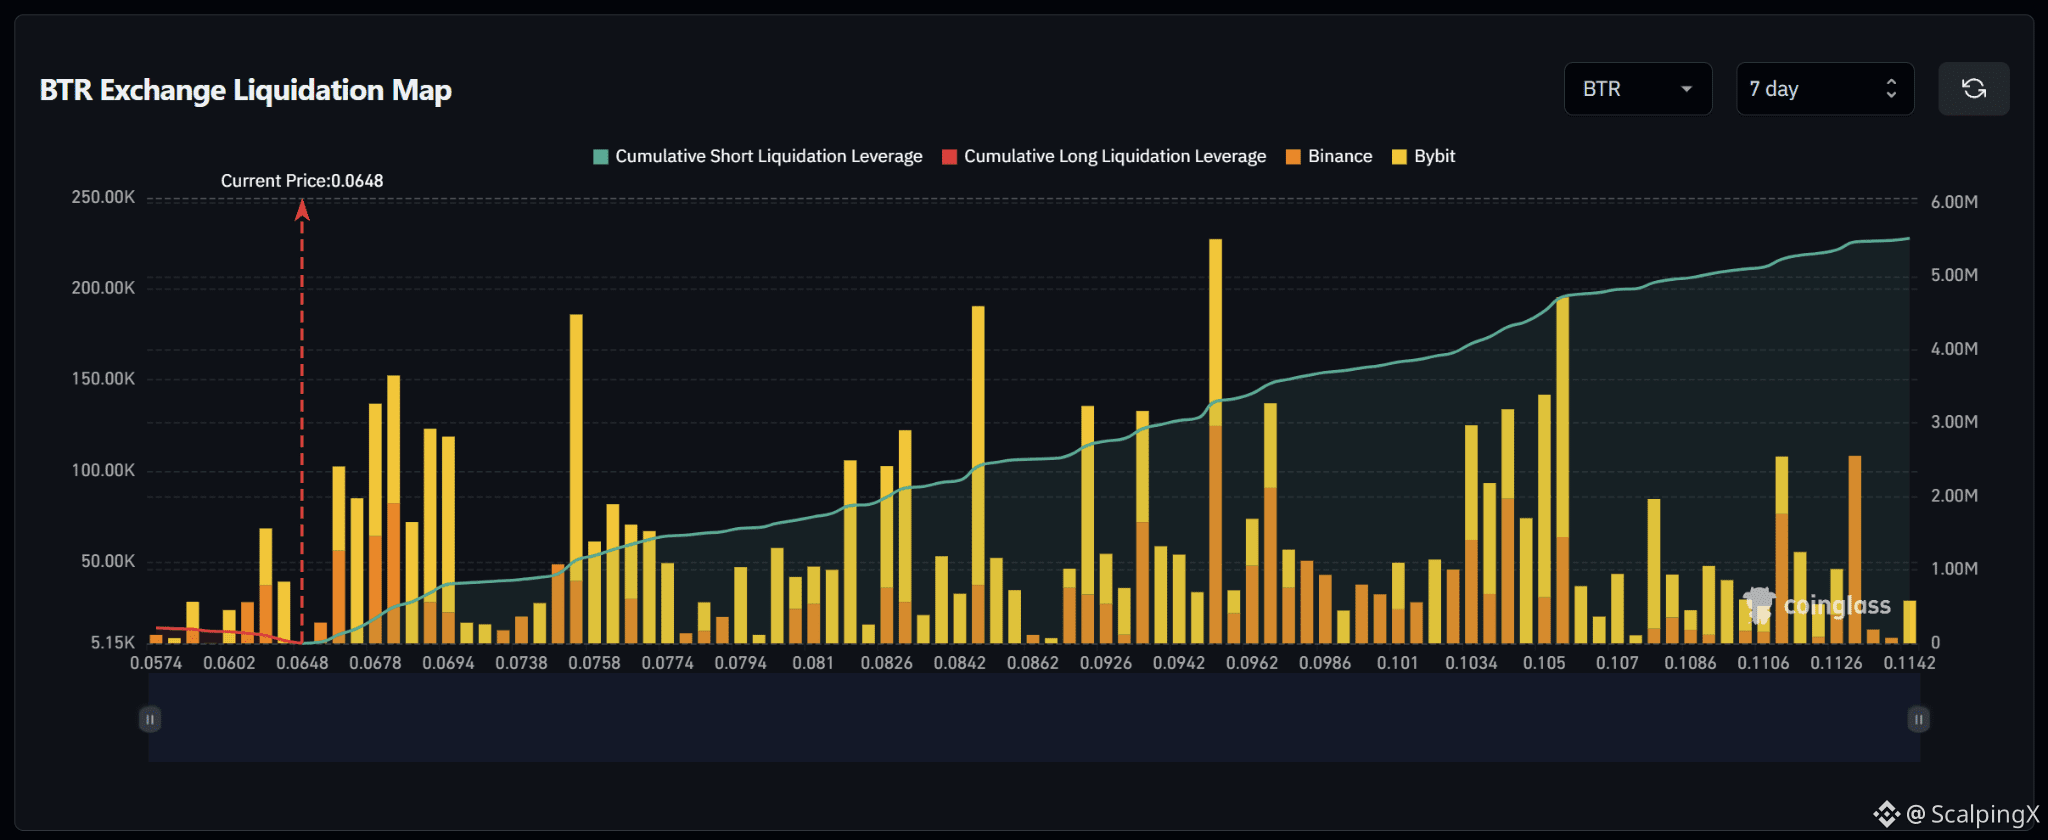
$BTR – Likvidasiya Xəritəsi (7 Gün) – Hazırkı Qiymət 0.0648
🔎 7 günlük likvidasiya xəritəsi hazırkı qiymətdən yuxarıda təxminən 5.4–5.5 milyon dollar qısa likvidasiyalar göstərir; qiymət göstərilən aralığın aşağı sərhədinə yaxın oturduğuna görə aşağıda uzun-likvidasiya üzrə təsir demək olar ki, yox kimidir. Likvidasiya strukturu buna görə də yüksəlişin xeyrinə güclü şəkildə meyllidir.
📉 Bazarın altındakı hissədə qalan uzun-likvidasiya likvidliyi nisbətən incədir, əsasən 0.0602–0.0574 aralığında. Hazırkı qiymətin dərhal altında böyük likvidasiya klasterləri yoxdur; bu da göstərilən aralıqda məhdud zərər likvidliyinin cəlbetmə ehtimalını göstərir.
📈 Bazarın üstündə qısa likvidasiya likvidliyi dərhal 0.0678–0.0694 aralığında formalaşmağa başlayır; ardınca 0.0758, 0.0842 və xüsusilə 0.094–0.096 yaxınlığında bir neçə böyük klaster gəlir. Daha uzaqda 0.1034–0.105 fərqlənir: çubuqlar təxminən 140,000–195,000 dollarlıq dəyərlərlə. 0.1126 da diqqətçəkən bir klaster ehtiva edir.
🧭 Ümumi ssenari yüksəlişin xeyrinədir, çünki əhəmiyyətli likvidasiya likvidliyinin demək olar ki, hamısı bazarın yuxarısında yerləşib. 0.0678-i qırmaq 0.0694–0.0758 istiqamətində bir “süpürmə” ehtimalını artıracaq; momentum davam edərsə, 0.0842 və 0.094–0.096 növbəti diqqətəlayiq likvidlik zonaları ola bilər.
#LiquidationMap
$BTR – Likvidasiya Xəritəsi (7 Gün) – Hazırkı Qiymət 0.0648
🔎 7 günlük likvidasiya xəritəsi hazırkı qiymətdən yuxarıda təxminən 5.4–5.5 milyon dollar qısa likvidasiyalar göstərir; qiymət göstərilən aralığın aşağı sərhədinə yaxın oturduğuna görə aşağıda uzun-likvidasiya üzrə təsir demək olar ki, yox kimidir. Likvidasiya strukturu buna görə də yüksəlişin xeyrinə güclü şəkildə meyllidir.
📉 Bazarın altındakı hissədə qalan uzun-likvidasiya likvidliyi nisbətən incədir, əsasən 0.0602–0.0574 aralığında. Hazırkı qiymətin dərhal altında böyük likvidasiya klasterləri yoxdur; bu da göstərilən aralıqda məhdud zərər likvidliyinin cəlbetmə ehtimalını göstərir.
📈 Bazarın üstündə qısa likvidasiya likvidliyi dərhal 0.0678–0.0694 aralığında formalaşmağa başlayır; ardınca 0.0758, 0.0842 və xüsusilə 0.094–0.096 yaxınlığında bir neçə böyük klaster gəlir. Daha uzaqda 0.1034–0.105 fərqlənir: çubuqlar təxminən 140,000–195,000 dollarlıq dəyərlərlə. 0.1126 da diqqətçəkən bir klaster ehtiva edir.
🧭 Ümumi ssenari yüksəlişin xeyrinədir, çünki əhəmiyyətli likvidasiya likvidliyinin demək olar ki, hamısı bazarın yuxarısında yerləşib. 0.0678-i qırmaq 0.0694–0.0758 istiqamətində bir “süpürmə” ehtimalını artıracaq; momentum davam edərsə, 0.0842 və 0.094–0.096 növbəti diqqətəlayiq likvidlik zonaları ola bilər.
#LiquidationMap
🔎 7 günlük likvidasiya xəritəsi hazırkı qiymətdən yuxarıda təxminən 5.4–5.5 milyon dollar qısa likvidasiyalar göstərir; qiymət göstərilən aralığın aşağı sərhədinə yaxın oturduğuna görə aşağıda uzun-likvidasiya üzrə təsir demək olar ki, yox kimidir. Likvidasiya strukturu buna görə də yüksəlişin xeyrinə güclü şəkildə meyllidir.
📉 Bazarın altındakı hissədə qalan uzun-likvidasiya likvidliyi nisbətən incədir, əsasən 0.0602–0.0574 aralığında. Hazırkı qiymətin dərhal altında böyük likvidasiya klasterləri yoxdur; bu da göstərilən aralıqda məhdud zərər likvidliyinin cəlbetmə ehtimalını göstərir.
📈 Bazarın üstündə qısa likvidasiya likvidliyi dərhal 0.0678–0.0694 aralığında formalaşmağa başlayır; ardınca 0.0758, 0.0842 və xüsusilə 0.094–0.096 yaxınlığında bir neçə böyük klaster gəlir. Daha uzaqda 0.1034–0.105 fərqlənir: çubuqlar təxminən 140,000–195,000 dollarlıq dəyərlərlə. 0.1126 da diqqətçəkən bir klaster ehtiva edir.
🧭 Ümumi ssenari yüksəlişin xeyrinədir, çünki əhəmiyyətli likvidasiya likvidliyinin demək olar ki, hamısı bazarın yuxarısında yerləşib. 0.0678-i qırmaq 0.0694–0.0758 istiqamətində bir “süpürmə” ehtimalını artıracaq; momentum davam edərsə, 0.0842 və 0.094–0.096 növbəti diqqətəlayiq likvidlik zonaları ola bilər.
#LiquidationMap
40
·
--
Artım
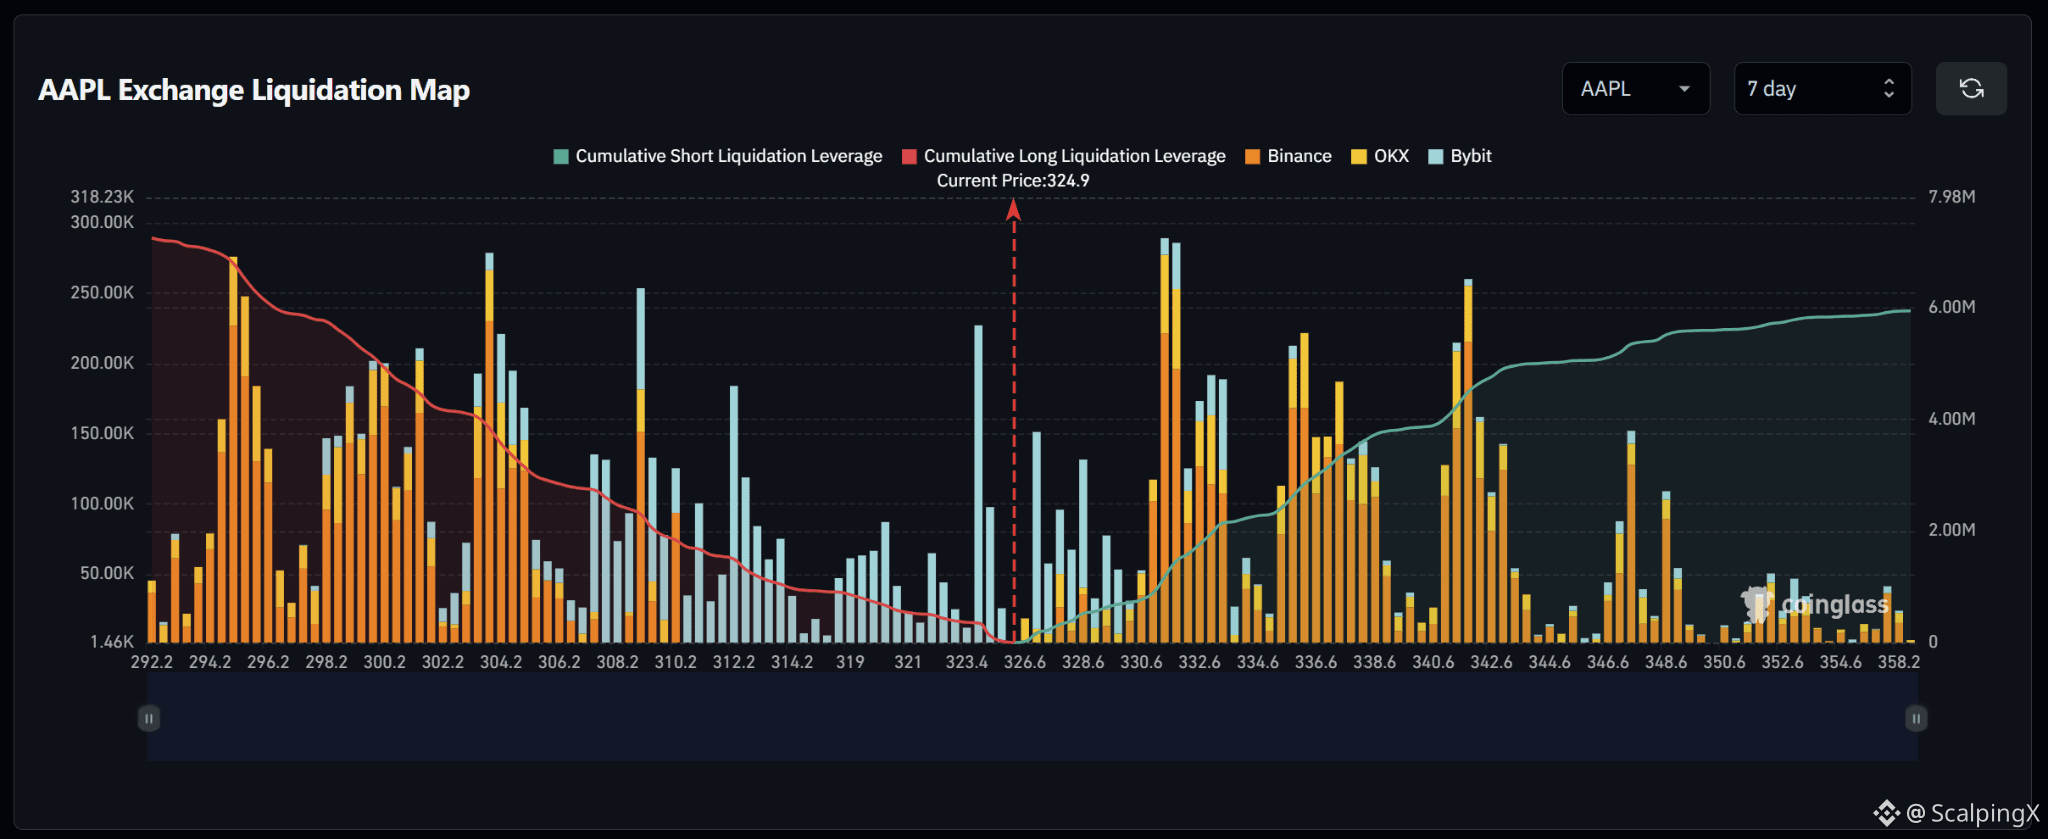
$AAPL – Likvidasiya Xəritəsi (7 Gün) – Hazırkı Qiymət 324.9
🔎 7 günlük likvidasiya xəritəsi hazırkı qiymət altında təxminən 7 milyon ABŞ dolları həcmində uzun likvidasiyanı göstərir; bu məbləğ yuxarıda qısa likvidasiyalar üzrə təxminən 6 milyon ABŞ dollarını üstələyir. Ümumi struktur nisbətən balanslıdır, amma bir qədər aşağı istiqamətə meyllidir.
📉 Bazarın altında, yaxın long-likvidasiya likvidliyi 323.4–321.0 aralığında cəmlənib; 323.4 yaxınlığında $200,000-dən çox olan nəzərəçarpacaq bir sütun var. Daha aşağıda 308.2–304.2 və 296.2–294.2 ətrafında daha böyük klasterlər görünür; burada bir neçə sütun təxminən $200,000–280,000-ə çatır. 323.4-ün itirilməsi diqqəti 321.0–319.0 istiqamətinə yönəldər.
📈 Bazarın üstündə, short-likvidasiya likvidliyi təxminən 326.6-dan etibarən formalaşmağa başlayır və 330.6–332.6 aralığında xeyli sıxlaşır. 331–332 yaxınlığında ən güclü klaster $290,000-ə yaxınlaşır. Daha uzaqda isə 336.6 və 340.6–342.6 ərazilərində də nəzərəçarpan likvidlik var.
🧭 Ümumilikdə quruluş aşağı tərəfi bir qədər üstün tutur, çünki aşağıda long-likvidasiya məruz qalması daha böyükdür. 323.4-ün itirilməsi 321.0–319.0 istiqamətində “sweep” ehtimalını artırar; 326.6-dan yuxarı qırılma isə diqqəti 330.6–332.6-ya yönəldər.
#LiquidationMap
$AAPL – Likvidasiya Xəritəsi (7 Gün) – Hazırkı Qiymət 324.9
🔎 7 günlük likvidasiya xəritəsi hazırkı qiymət altında təxminən 7 milyon ABŞ dolları həcmində uzun likvidasiyanı göstərir; bu məbləğ yuxarıda qısa likvidasiyalar üzrə təxminən 6 milyon ABŞ dollarını üstələyir. Ümumi struktur nisbətən balanslıdır, amma bir qədər aşağı istiqamətə meyllidir.
📉 Bazarın altında, yaxın long-likvidasiya likvidliyi 323.4–321.0 aralığında cəmlənib; 323.4 yaxınlığında $200,000-dən çox olan nəzərəçarpacaq bir sütun var. Daha aşağıda 308.2–304.2 və 296.2–294.2 ətrafında daha böyük klasterlər görünür; burada bir neçə sütun təxminən $200,000–280,000-ə çatır. 323.4-ün itirilməsi diqqəti 321.0–319.0 istiqamətinə yönəldər.
📈 Bazarın üstündə, short-likvidasiya likvidliyi təxminən 326.6-dan etibarən formalaşmağa başlayır və 330.6–332.6 aralığında xeyli sıxlaşır. 331–332 yaxınlığında ən güclü klaster $290,000-ə yaxınlaşır. Daha uzaqda isə 336.6 və 340.6–342.6 ərazilərində də nəzərəçarpan likvidlik var.
🧭 Ümumilikdə quruluş aşağı tərəfi bir qədər üstün tutur, çünki aşağıda long-likvidasiya məruz qalması daha böyükdür. 323.4-ün itirilməsi 321.0–319.0 istiqamətində “sweep” ehtimalını artırar; 326.6-dan yuxarı qırılma isə diqqəti 330.6–332.6-ya yönəldər.
#LiquidationMap
🔎 7 günlük likvidasiya xəritəsi hazırkı qiymət altında təxminən 7 milyon ABŞ dolları həcmində uzun likvidasiyanı göstərir; bu məbləğ yuxarıda qısa likvidasiyalar üzrə təxminən 6 milyon ABŞ dollarını üstələyir. Ümumi struktur nisbətən balanslıdır, amma bir qədər aşağı istiqamətə meyllidir.
📉 Bazarın altında, yaxın long-likvidasiya likvidliyi 323.4–321.0 aralığında cəmlənib; 323.4 yaxınlığında $200,000-dən çox olan nəzərəçarpacaq bir sütun var. Daha aşağıda 308.2–304.2 və 296.2–294.2 ətrafında daha böyük klasterlər görünür; burada bir neçə sütun təxminən $200,000–280,000-ə çatır. 323.4-ün itirilməsi diqqəti 321.0–319.0 istiqamətinə yönəldər.
📈 Bazarın üstündə, short-likvidasiya likvidliyi təxminən 326.6-dan etibarən formalaşmağa başlayır və 330.6–332.6 aralığında xeyli sıxlaşır. 331–332 yaxınlığında ən güclü klaster $290,000-ə yaxınlaşır. Daha uzaqda isə 336.6 və 340.6–342.6 ərazilərində də nəzərəçarpan likvidlik var.
🧭 Ümumilikdə quruluş aşağı tərəfi bir qədər üstün tutur, çünki aşağıda long-likvidasiya məruz qalması daha böyükdür. 323.4-ün itirilməsi 321.0–319.0 istiqamətində “sweep” ehtimalını artırar; 326.6-dan yuxarı qırılma isə diqqəti 330.6–332.6-ya yönəldər.
#LiquidationMap
1
16
·
--
Artım
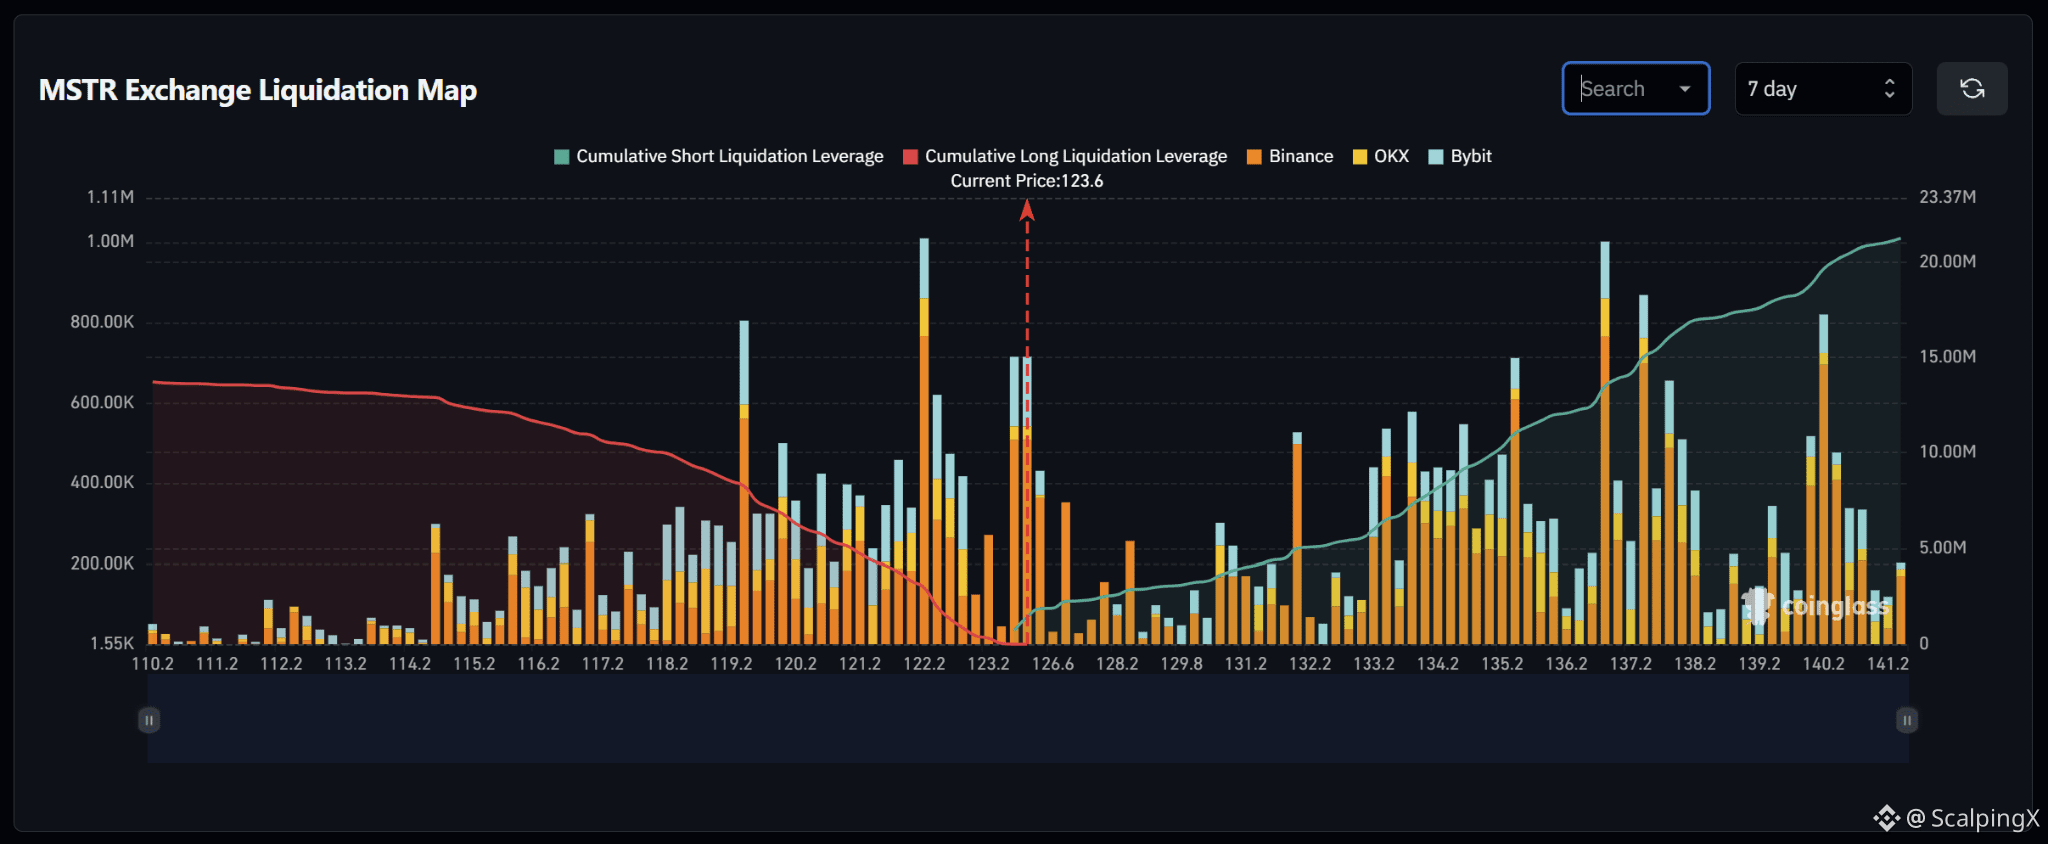
$MSTR – Likvidasiya Xəritəsi (7 Gün) – Cari Qiymət 123.6
🔎 7 günlük likvidasiya xəritəsi cari qiymətin üstündə təxminən 20–21 milyon ABŞ dolları həcmində qısa likvidasiyanı göstərir; bu, aşağıda təxminən 13–14 milyon ABŞ dolları həcmində uzun likvidasiyanı üstələyir. Likvidlik strukturu buna görə yüksəlişi dəstəkləyir və bazarın üstündə yığılmış likvidlik təxminən 1.5 dəfə çoxdur.
📉 Bazarın altında yaxın məsafədə uzun-likvidasiya likvidliyi 123.2–122.2 aralığında cəmlənib. Ən güclü klaster 122.2 yaxınlığında yerləşir; burada likvidasiya zolağı təxminən 1 milyon civarındadır, 119.2 isə $800,000 yaxınlığında böyük bir klasteri ehtiva edir. 123.2-nin itirilməsi 122.2 istiqamətində bir “süpürmə” ehtimalını artırar.
📈 Bazarın üstündə isə qısa-likvidasiya likvidliyi 124–126.6 aralığında formalaşmağa başlayır və 133.2–137.2 boyunca kəskin şəkildə artır. 136.2–137.2 zonası $850,000–1 milyon civarında likvidasiya zolaqları ilə seçilir. Daha uzaqda 140.2 sahəsi də $800,000-dən yuxarı böyük bir klasteri saxlayır.
🧭 Ümumi ssenari yüksəlişi daha çox dəstəkləyir, çünki yuxarıda qısa-likvidasiya üzrə ekspozisiya təxminən 1.5 dəfə böyükdür. 124–126.6 diapazonunu qırmaq 133.2–137.2 istiqamətində hərəkət ehtimalını artırar, 123.2-nin itirilməsi isə diqqəti 122.2-yə yönəldər.
#LiquidationMap
$MSTR – Likvidasiya Xəritəsi (7 Gün) – Cari Qiymət 123.6
🔎 7 günlük likvidasiya xəritəsi cari qiymətin üstündə təxminən 20–21 milyon ABŞ dolları həcmində qısa likvidasiyanı göstərir; bu, aşağıda təxminən 13–14 milyon ABŞ dolları həcmində uzun likvidasiyanı üstələyir. Likvidlik strukturu buna görə yüksəlişi dəstəkləyir və bazarın üstündə yığılmış likvidlik təxminən 1.5 dəfə çoxdur.
📉 Bazarın altında yaxın məsafədə uzun-likvidasiya likvidliyi 123.2–122.2 aralığında cəmlənib. Ən güclü klaster 122.2 yaxınlığında yerləşir; burada likvidasiya zolağı təxminən 1 milyon civarındadır, 119.2 isə $800,000 yaxınlığında böyük bir klasteri ehtiva edir. 123.2-nin itirilməsi 122.2 istiqamətində bir “süpürmə” ehtimalını artırar.
📈 Bazarın üstündə isə qısa-likvidasiya likvidliyi 124–126.6 aralığında formalaşmağa başlayır və 133.2–137.2 boyunca kəskin şəkildə artır. 136.2–137.2 zonası $850,000–1 milyon civarında likvidasiya zolaqları ilə seçilir. Daha uzaqda 140.2 sahəsi də $800,000-dən yuxarı böyük bir klasteri saxlayır.
🧭 Ümumi ssenari yüksəlişi daha çox dəstəkləyir, çünki yuxarıda qısa-likvidasiya üzrə ekspozisiya təxminən 1.5 dəfə böyükdür. 124–126.6 diapazonunu qırmaq 133.2–137.2 istiqamətində hərəkət ehtimalını artırar, 123.2-nin itirilməsi isə diqqəti 122.2-yə yönəldər.
#LiquidationMap
🔎 7 günlük likvidasiya xəritəsi cari qiymətin üstündə təxminən 20–21 milyon ABŞ dolları həcmində qısa likvidasiyanı göstərir; bu, aşağıda təxminən 13–14 milyon ABŞ dolları həcmində uzun likvidasiyanı üstələyir. Likvidlik strukturu buna görə yüksəlişi dəstəkləyir və bazarın üstündə yığılmış likvidlik təxminən 1.5 dəfə çoxdur.
📉 Bazarın altında yaxın məsafədə uzun-likvidasiya likvidliyi 123.2–122.2 aralığında cəmlənib. Ən güclü klaster 122.2 yaxınlığında yerləşir; burada likvidasiya zolağı təxminən 1 milyon civarındadır, 119.2 isə $800,000 yaxınlığında böyük bir klasteri ehtiva edir. 123.2-nin itirilməsi 122.2 istiqamətində bir “süpürmə” ehtimalını artırar.
📈 Bazarın üstündə isə qısa-likvidasiya likvidliyi 124–126.6 aralığında formalaşmağa başlayır və 133.2–137.2 boyunca kəskin şəkildə artır. 136.2–137.2 zonası $850,000–1 milyon civarında likvidasiya zolaqları ilə seçilir. Daha uzaqda 140.2 sahəsi də $800,000-dən yuxarı böyük bir klasteri saxlayır.
🧭 Ümumi ssenari yüksəlişi daha çox dəstəkləyir, çünki yuxarıda qısa-likvidasiya üzrə ekspozisiya təxminən 1.5 dəfə böyükdür. 124–126.6 diapazonunu qırmaq 133.2–137.2 istiqamətində hərəkət ehtimalını artırar, 123.2-nin itirilməsi isə diqqəti 122.2-yə yönəldər.
#LiquidationMap
11
·
--
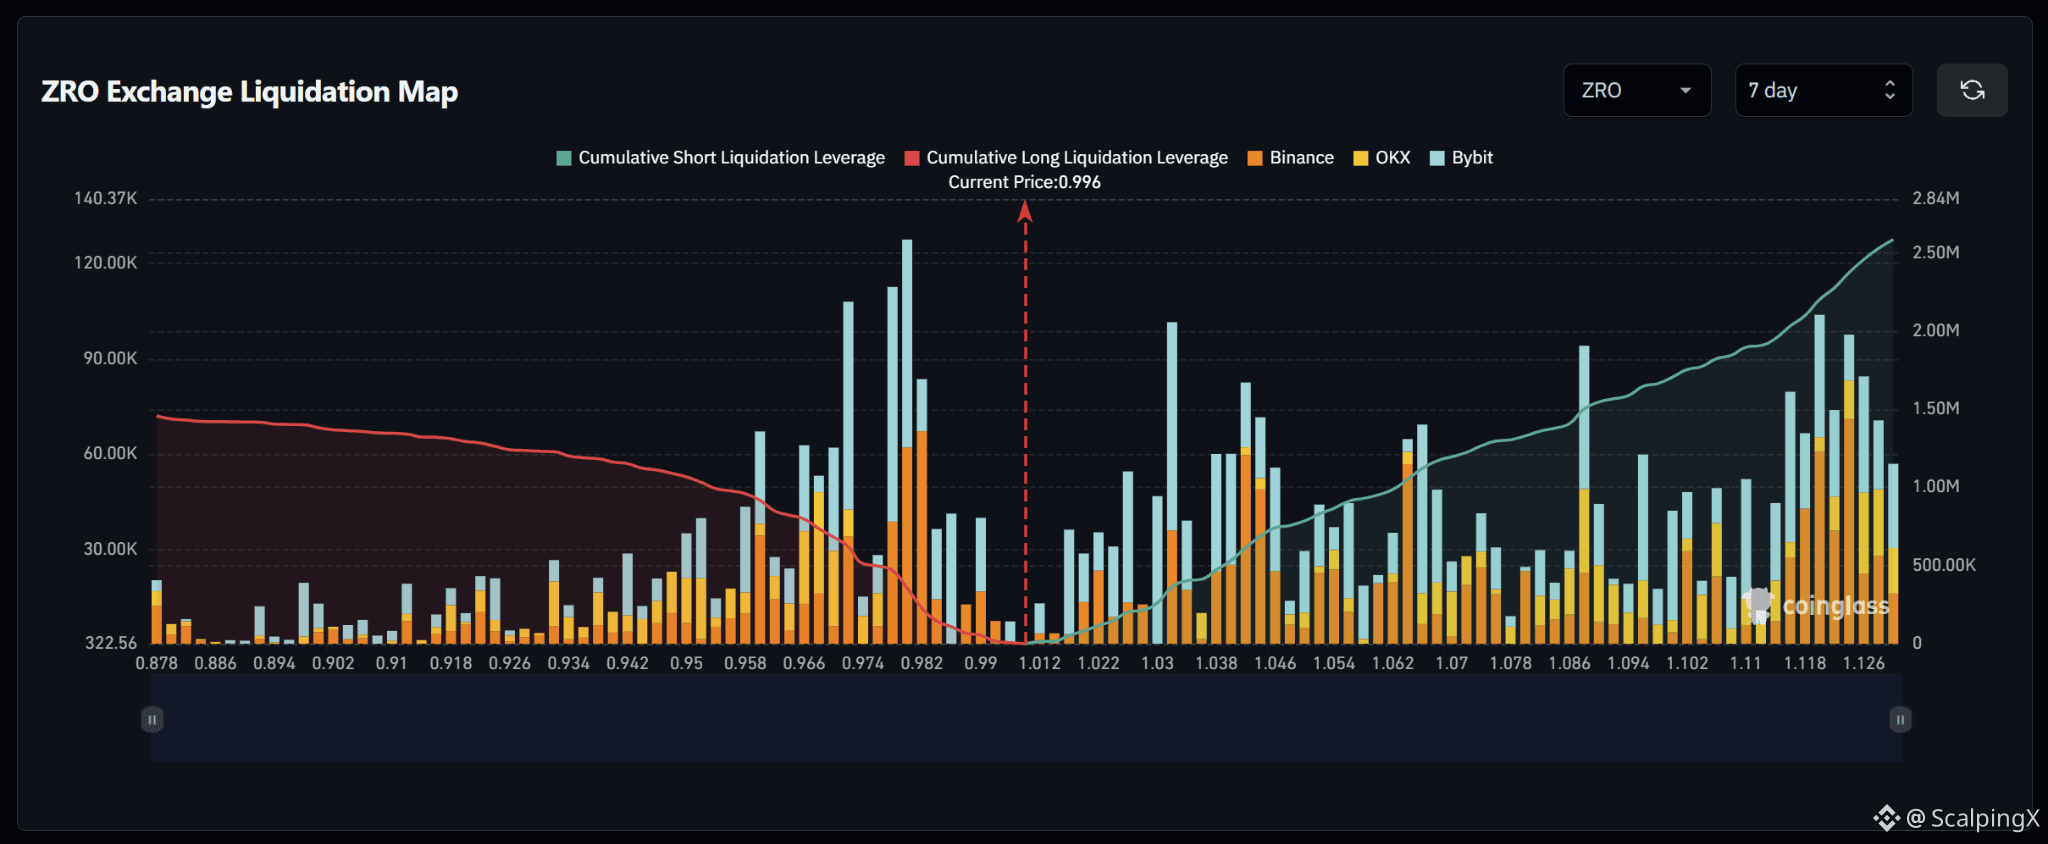
$ZRO – Ləğv Xəritəsi (7 Gün) – Cari Qiymət 0.996
🔎 7 günlük ləğv xəritəsi cari qiymətin üstündə təxminən 2.5 milyon dollar qısa ləğvləri göstərir; bu, alt hissədəki təxminən 1.5 milyon dollarlıq uzun ləğvləri üstələyir. Likvidlik strukturu buna görə yüksəlişi dəstəkləyir: bazarın yuxarısında təxminən 1.6–1.7 dəfə daha çox kumulyativ likvidlik mövcuddur.
📉 Bazarın altında yaxın long-ləğv likvidliyi 0.982–0.966 ətrafında cəmləşib. Ən güclü klaster 0.978–0.982 yaxınlığında yerləşir; burada ləğv barları təxminən 110,000–130,000 dollara çatır, 0.966–0.974 zonasında isə nəzərə çarpan likvidlik də var. 0.982 itkisi diqqəti 0.974–0.966 tərəfə yönəldər.
📈 Bazarın üstündə qısa-ləğv likvidliyi təxminən 1.012-dən başlayaraq yığılmağa edir və 1.030–1.046 aralığında artır. Daha uzaqda isə 1.086 və xüsusilə 1.118–1.126 zonaları seçilir; burada bir neçə bar təxminən 90,000–105,000 dollar aralığındadır. Bunlar yüksəliş üzrə daha diqqətçəkən likvidlik zonalarından bəzilərini formalaşdırır.
🧭 Ümumi quruluş yüksəlişə üstünlük verir, çünki yuxarıda qısa-ləğv ekspozisiyası təxminən 1.6–1.7 dəfə böyükdür. 1.012-nin qırılması 1.030–1.046 istiqamətində “süpürmə” ehtimalını artırar, 0.982-nin itirilməsi isə diqqəti 0.974–0.966 tərəfə keçirər.
#LiquidationMap
$ZRO – Ləğv Xəritəsi (7 Gün) – Cari Qiymət 0.996
🔎 7 günlük ləğv xəritəsi cari qiymətin üstündə təxminən 2.5 milyon dollar qısa ləğvləri göstərir; bu, alt hissədəki təxminən 1.5 milyon dollarlıq uzun ləğvləri üstələyir. Likvidlik strukturu buna görə yüksəlişi dəstəkləyir: bazarın yuxarısında təxminən 1.6–1.7 dəfə daha çox kumulyativ likvidlik mövcuddur.
📉 Bazarın altında yaxın long-ləğv likvidliyi 0.982–0.966 ətrafında cəmləşib. Ən güclü klaster 0.978–0.982 yaxınlığında yerləşir; burada ləğv barları təxminən 110,000–130,000 dollara çatır, 0.966–0.974 zonasında isə nəzərə çarpan likvidlik də var. 0.982 itkisi diqqəti 0.974–0.966 tərəfə yönəldər.
📈 Bazarın üstündə qısa-ləğv likvidliyi təxminən 1.012-dən başlayaraq yığılmağa edir və 1.030–1.046 aralığında artır. Daha uzaqda isə 1.086 və xüsusilə 1.118–1.126 zonaları seçilir; burada bir neçə bar təxminən 90,000–105,000 dollar aralığındadır. Bunlar yüksəliş üzrə daha diqqətçəkən likvidlik zonalarından bəzilərini formalaşdırır.
🧭 Ümumi quruluş yüksəlişə üstünlük verir, çünki yuxarıda qısa-ləğv ekspozisiyası təxminən 1.6–1.7 dəfə böyükdür. 1.012-nin qırılması 1.030–1.046 istiqamətində “süpürmə” ehtimalını artırar, 0.982-nin itirilməsi isə diqqəti 0.974–0.966 tərəfə keçirər.
#LiquidationMap
🔎 7 günlük ləğv xəritəsi cari qiymətin üstündə təxminən 2.5 milyon dollar qısa ləğvləri göstərir; bu, alt hissədəki təxminən 1.5 milyon dollarlıq uzun ləğvləri üstələyir. Likvidlik strukturu buna görə yüksəlişi dəstəkləyir: bazarın yuxarısında təxminən 1.6–1.7 dəfə daha çox kumulyativ likvidlik mövcuddur.
📉 Bazarın altında yaxın long-ləğv likvidliyi 0.982–0.966 ətrafında cəmləşib. Ən güclü klaster 0.978–0.982 yaxınlığında yerləşir; burada ləğv barları təxminən 110,000–130,000 dollara çatır, 0.966–0.974 zonasında isə nəzərə çarpan likvidlik də var. 0.982 itkisi diqqəti 0.974–0.966 tərəfə yönəldər.
📈 Bazarın üstündə qısa-ləğv likvidliyi təxminən 1.012-dən başlayaraq yığılmağa edir və 1.030–1.046 aralığında artır. Daha uzaqda isə 1.086 və xüsusilə 1.118–1.126 zonaları seçilir; burada bir neçə bar təxminən 90,000–105,000 dollar aralığındadır. Bunlar yüksəliş üzrə daha diqqətçəkən likvidlik zonalarından bəzilərini formalaşdırır.
🧭 Ümumi quruluş yüksəlişə üstünlük verir, çünki yuxarıda qısa-ləğv ekspozisiyası təxminən 1.6–1.7 dəfə böyükdür. 1.012-nin qırılması 1.030–1.046 istiqamətində “süpürmə” ehtimalını artırar, 0.982-nin itirilməsi isə diqqəti 0.974–0.966 tərəfə keçirər.
#LiquidationMap
76
·
--
Artım
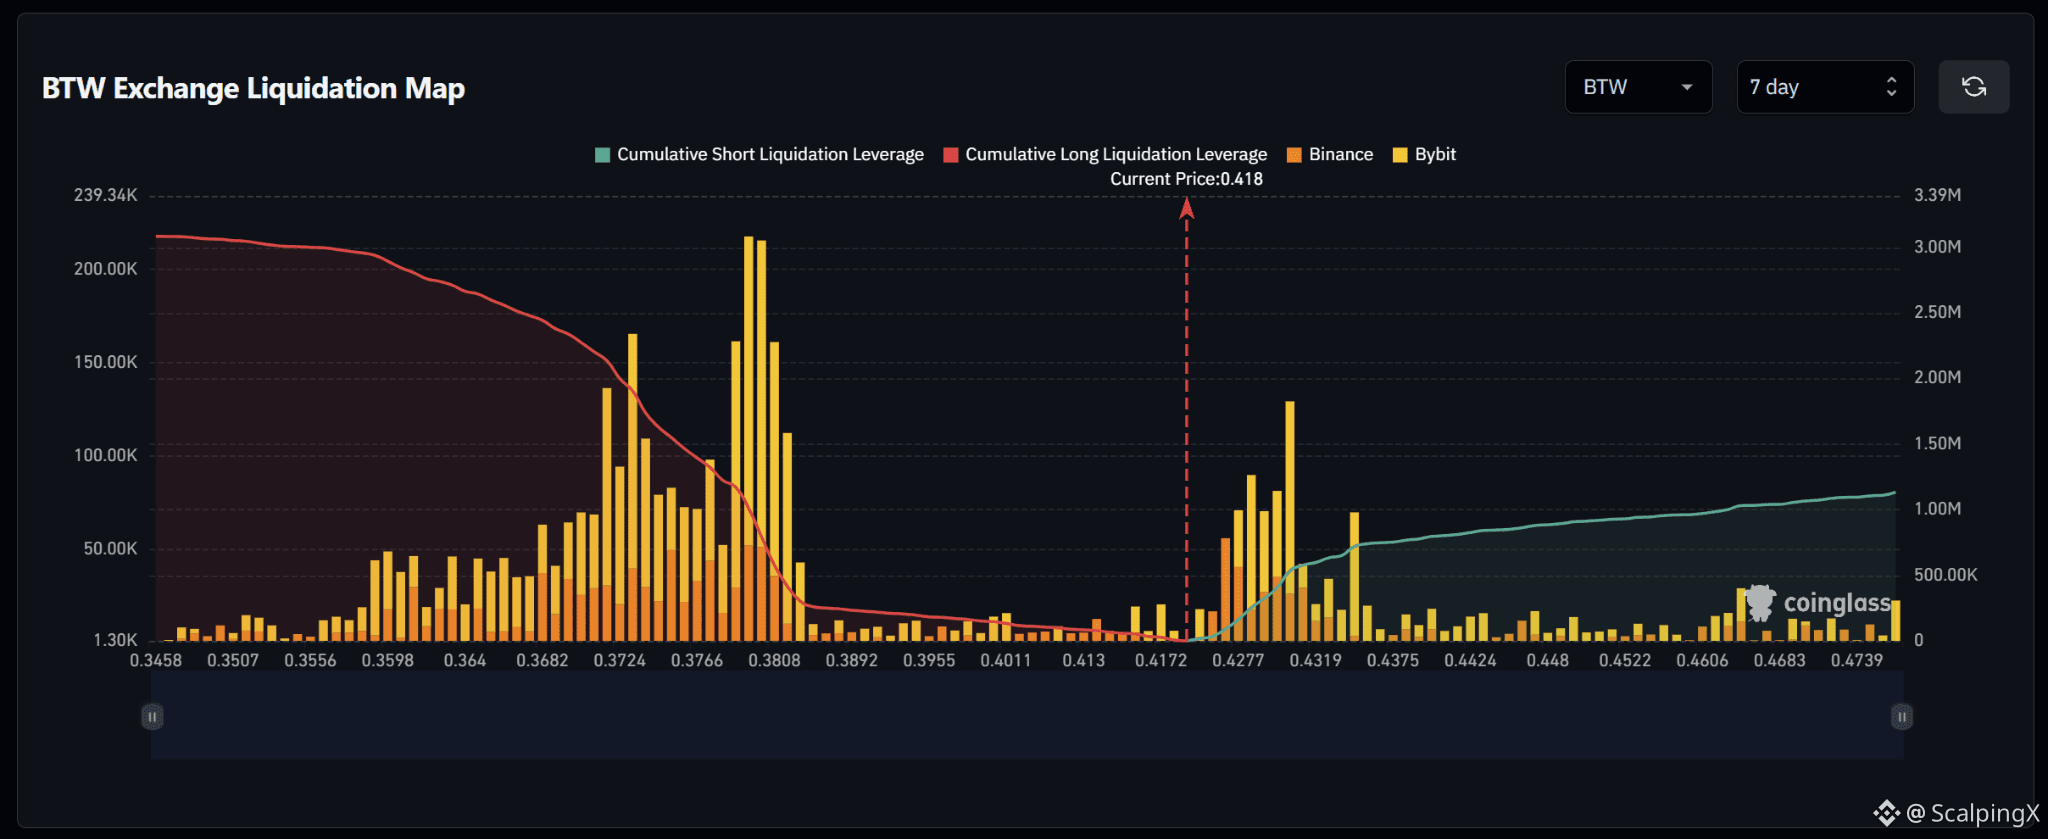
$BTW – Ləğvetmə Xəritəsi (7 Gün) – Hazırkı Qiymət 0.418
🔎 7 günlük ləğvetmə xəritəsi hazırkı qiymətin altında təxminən $3.1 milyon uzun (long) ləğvetməni göstərir; bu, yuxarıda təxminən $1.1 milyon qısa (short) ləğvetmədən demək olar ki, üç dəfə çoxdur. Likvidlik strukturu açıq şəkildə aşağı yönü dəstəkləyir.
📉 Bazardan aşağıda, yaxın uzun-ləğvetmə likvidliyi nisbətən zəifdir: 0.413–0.401 aralığında; sonra 0.389–0.372 aralığında kəskin artım müşahidə olunur. Ən güclü klaster 0.378–0.381 civarındadır: burada ləğvetmə çubuqları $200,000-dən çoxdur; 0.372–0.377 də əhəmiyyətli likvidlik ehtiva edir. 0.413 itirildikdə diqqət tədricən 0.401–0.389 aralığına yönələcək.
📈 Bazardan yuxarıda, qısa-ləğvetmə likvidliyi 0.4277-dən aydın şəkildə yığılmağa başlayır və 0.4319–0.4375 aralığında artır. Ən güclü klaster 0.4319 yaxındadır: burada ləğvetmə çubuğu təxminən $130,000-ə çatır; 0.4277–0.4319 isə ən yaxın diqqətəlayiq yüksəliş likvidliyi zonası kimi formalaşır.
🧭 Daha geniş quraşdırma aşağı istiqaməti üstün tutur, çünki aşağıda uzun-ləğvetmə ekspozisiyası demək olar ki, üç dəfə böyükdür. 0.413 itirilməsi 0.401–0.389 aralığına doğru süpürmə ehtimalını artırar, 0.4277-dən yuxarı qırılma isə diqqəti 0.4319–0.4375 istiqamətinə keçirər.
#LiquidationMap
$BTW – Ləğvetmə Xəritəsi (7 Gün) – Hazırkı Qiymət 0.418
🔎 7 günlük ləğvetmə xəritəsi hazırkı qiymətin altında təxminən $3.1 milyon uzun (long) ləğvetməni göstərir; bu, yuxarıda təxminən $1.1 milyon qısa (short) ləğvetmədən demək olar ki, üç dəfə çoxdur. Likvidlik strukturu açıq şəkildə aşağı yönü dəstəkləyir.
📉 Bazardan aşağıda, yaxın uzun-ləğvetmə likvidliyi nisbətən zəifdir: 0.413–0.401 aralığında; sonra 0.389–0.372 aralığında kəskin artım müşahidə olunur. Ən güclü klaster 0.378–0.381 civarındadır: burada ləğvetmə çubuqları $200,000-dən çoxdur; 0.372–0.377 də əhəmiyyətli likvidlik ehtiva edir. 0.413 itirildikdə diqqət tədricən 0.401–0.389 aralığına yönələcək.
📈 Bazardan yuxarıda, qısa-ləğvetmə likvidliyi 0.4277-dən aydın şəkildə yığılmağa başlayır və 0.4319–0.4375 aralığında artır. Ən güclü klaster 0.4319 yaxındadır: burada ləğvetmə çubuğu təxminən $130,000-ə çatır; 0.4277–0.4319 isə ən yaxın diqqətəlayiq yüksəliş likvidliyi zonası kimi formalaşır.
🧭 Daha geniş quraşdırma aşağı istiqaməti üstün tutur, çünki aşağıda uzun-ləğvetmə ekspozisiyası demək olar ki, üç dəfə böyükdür. 0.413 itirilməsi 0.401–0.389 aralığına doğru süpürmə ehtimalını artırar, 0.4277-dən yuxarı qırılma isə diqqəti 0.4319–0.4375 istiqamətinə keçirər.
#LiquidationMap
🔎 7 günlük ləğvetmə xəritəsi hazırkı qiymətin altında təxminən $3.1 milyon uzun (long) ləğvetməni göstərir; bu, yuxarıda təxminən $1.1 milyon qısa (short) ləğvetmədən demək olar ki, üç dəfə çoxdur. Likvidlik strukturu açıq şəkildə aşağı yönü dəstəkləyir.
📉 Bazardan aşağıda, yaxın uzun-ləğvetmə likvidliyi nisbətən zəifdir: 0.413–0.401 aralığında; sonra 0.389–0.372 aralığında kəskin artım müşahidə olunur. Ən güclü klaster 0.378–0.381 civarındadır: burada ləğvetmə çubuqları $200,000-dən çoxdur; 0.372–0.377 də əhəmiyyətli likvidlik ehtiva edir. 0.413 itirildikdə diqqət tədricən 0.401–0.389 aralığına yönələcək.
📈 Bazardan yuxarıda, qısa-ləğvetmə likvidliyi 0.4277-dən aydın şəkildə yığılmağa başlayır və 0.4319–0.4375 aralığında artır. Ən güclü klaster 0.4319 yaxındadır: burada ləğvetmə çubuğu təxminən $130,000-ə çatır; 0.4277–0.4319 isə ən yaxın diqqətəlayiq yüksəliş likvidliyi zonası kimi formalaşır.
🧭 Daha geniş quraşdırma aşağı istiqaməti üstün tutur, çünki aşağıda uzun-ləğvetmə ekspozisiyası demək olar ki, üç dəfə böyükdür. 0.413 itirilməsi 0.401–0.389 aralığına doğru süpürmə ehtimalını artırar, 0.4277-dən yuxarı qırılma isə diqqəti 0.4319–0.4375 istiqamətinə keçirər.
#LiquidationMap
9
·
--
Artım
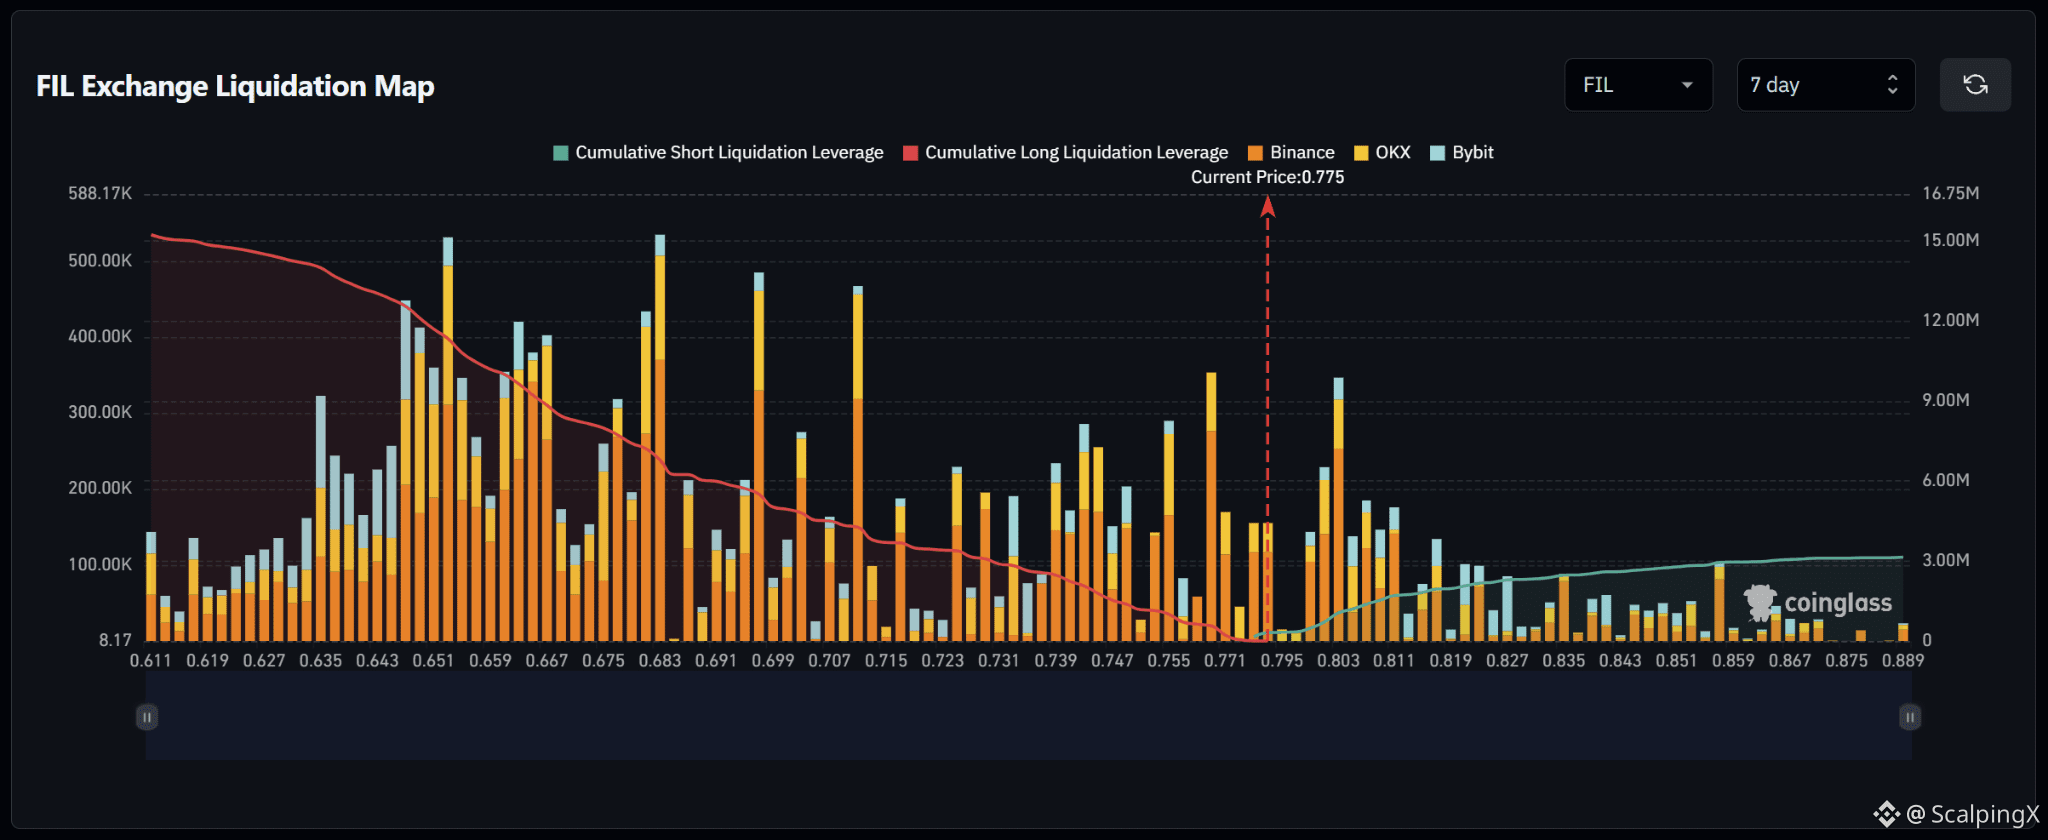
$FIL – Ləğvetmə Xəritəsi (7 Gün) – Cari Qiymət 0.775
🔎 7 günlük ləğvetmə xəritəsi cari qiymətin altında təxminən 15 milyon ABŞ dolları dəyərində uzun mövqe ləğvlərini göstərir; yuxarıda isə təxminən 3 milyon ABŞ dolları dəyərində qısa mövqe ləğvləri var — təxminən beş dəfə çoxdur. Buna görə likvidlik strukturu aşağıya doğru güclü şəkildə üstünlük verir.
📉 Bazardan aşağıda, yaxın məsafədə uzun-ləğvetmə likvidliyi 0.771–0.747 aralığında cəmlənib; 0.755 və 0.747 yaxınlığında diqqətçəkən klasterlər var. Daha aşağıda likvidlik 0.707–0.683 aralığında kəskin artır, 0.667–0.643 isə təxminən 300,000–530,000 ABŞ dolları civarında bir neçə böyük çubuq ehtiva edir. 0.771 itirilsə, 0.755–0.747 istiqamətində “sweep” ehtimalı artar.
📈 Bazardan yuxarıda, qısa-ləğvetmə likvidliyi cari qiymət yaxınlığında nisbətən seyrəkdir və təxminən 0.795-dən etibarən daha aydın görünür. Ən güclü yaxın klaster 0.803 yaxınlığındadır; burada ləğvetmə çubuğu təxminən 340,000 ABŞ dollarına çatır, ardınca 0.811–0.819 gəlir. Daha uzaqda isə yuxarı istiqamətli likvidlik xeyli dərəcədə zəifləyir.
🧭 Ümumi quruluş aşağı tərəfi güclü dəstəkləyir, çünki aşağıda uzun-ləğvetmə üzrə ekspozisiya təxminən beş dəfə böyükdür. 0.771 itirilsə, 0.755–0.747 istiqamətində “sweep” ehtimalı artar; 0.795-i qırmaq isə diqqəti 0.803–0.811 tərəfinə yönəldər.
#LiquidationMap
$FIL – Ləğvetmə Xəritəsi (7 Gün) – Cari Qiymət 0.775
🔎 7 günlük ləğvetmə xəritəsi cari qiymətin altında təxminən 15 milyon ABŞ dolları dəyərində uzun mövqe ləğvlərini göstərir; yuxarıda isə təxminən 3 milyon ABŞ dolları dəyərində qısa mövqe ləğvləri var — təxminən beş dəfə çoxdur. Buna görə likvidlik strukturu aşağıya doğru güclü şəkildə üstünlük verir.
📉 Bazardan aşağıda, yaxın məsafədə uzun-ləğvetmə likvidliyi 0.771–0.747 aralığında cəmlənib; 0.755 və 0.747 yaxınlığında diqqətçəkən klasterlər var. Daha aşağıda likvidlik 0.707–0.683 aralığında kəskin artır, 0.667–0.643 isə təxminən 300,000–530,000 ABŞ dolları civarında bir neçə böyük çubuq ehtiva edir. 0.771 itirilsə, 0.755–0.747 istiqamətində “sweep” ehtimalı artar.
📈 Bazardan yuxarıda, qısa-ləğvetmə likvidliyi cari qiymət yaxınlığında nisbətən seyrəkdir və təxminən 0.795-dən etibarən daha aydın görünür. Ən güclü yaxın klaster 0.803 yaxınlığındadır; burada ləğvetmə çubuğu təxminən 340,000 ABŞ dollarına çatır, ardınca 0.811–0.819 gəlir. Daha uzaqda isə yuxarı istiqamətli likvidlik xeyli dərəcədə zəifləyir.
🧭 Ümumi quruluş aşağı tərəfi güclü dəstəkləyir, çünki aşağıda uzun-ləğvetmə üzrə ekspozisiya təxminən beş dəfə böyükdür. 0.771 itirilsə, 0.755–0.747 istiqamətində “sweep” ehtimalı artar; 0.795-i qırmaq isə diqqəti 0.803–0.811 tərəfinə yönəldər.
#LiquidationMap
🔎 7 günlük ləğvetmə xəritəsi cari qiymətin altında təxminən 15 milyon ABŞ dolları dəyərində uzun mövqe ləğvlərini göstərir; yuxarıda isə təxminən 3 milyon ABŞ dolları dəyərində qısa mövqe ləğvləri var — təxminən beş dəfə çoxdur. Buna görə likvidlik strukturu aşağıya doğru güclü şəkildə üstünlük verir.
📉 Bazardan aşağıda, yaxın məsafədə uzun-ləğvetmə likvidliyi 0.771–0.747 aralığında cəmlənib; 0.755 və 0.747 yaxınlığında diqqətçəkən klasterlər var. Daha aşağıda likvidlik 0.707–0.683 aralığında kəskin artır, 0.667–0.643 isə təxminən 300,000–530,000 ABŞ dolları civarında bir neçə böyük çubuq ehtiva edir. 0.771 itirilsə, 0.755–0.747 istiqamətində “sweep” ehtimalı artar.
📈 Bazardan yuxarıda, qısa-ləğvetmə likvidliyi cari qiymət yaxınlığında nisbətən seyrəkdir və təxminən 0.795-dən etibarən daha aydın görünür. Ən güclü yaxın klaster 0.803 yaxınlığındadır; burada ləğvetmə çubuğu təxminən 340,000 ABŞ dollarına çatır, ardınca 0.811–0.819 gəlir. Daha uzaqda isə yuxarı istiqamətli likvidlik xeyli dərəcədə zəifləyir.
🧭 Ümumi quruluş aşağı tərəfi güclü dəstəkləyir, çünki aşağıda uzun-ləğvetmə üzrə ekspozisiya təxminən beş dəfə böyükdür. 0.771 itirilsə, 0.755–0.747 istiqamətində “sweep” ehtimalı artar; 0.795-i qırmaq isə diqqəti 0.803–0.811 tərəfinə yönəldər.
#LiquidationMap
28
·
--
Artım
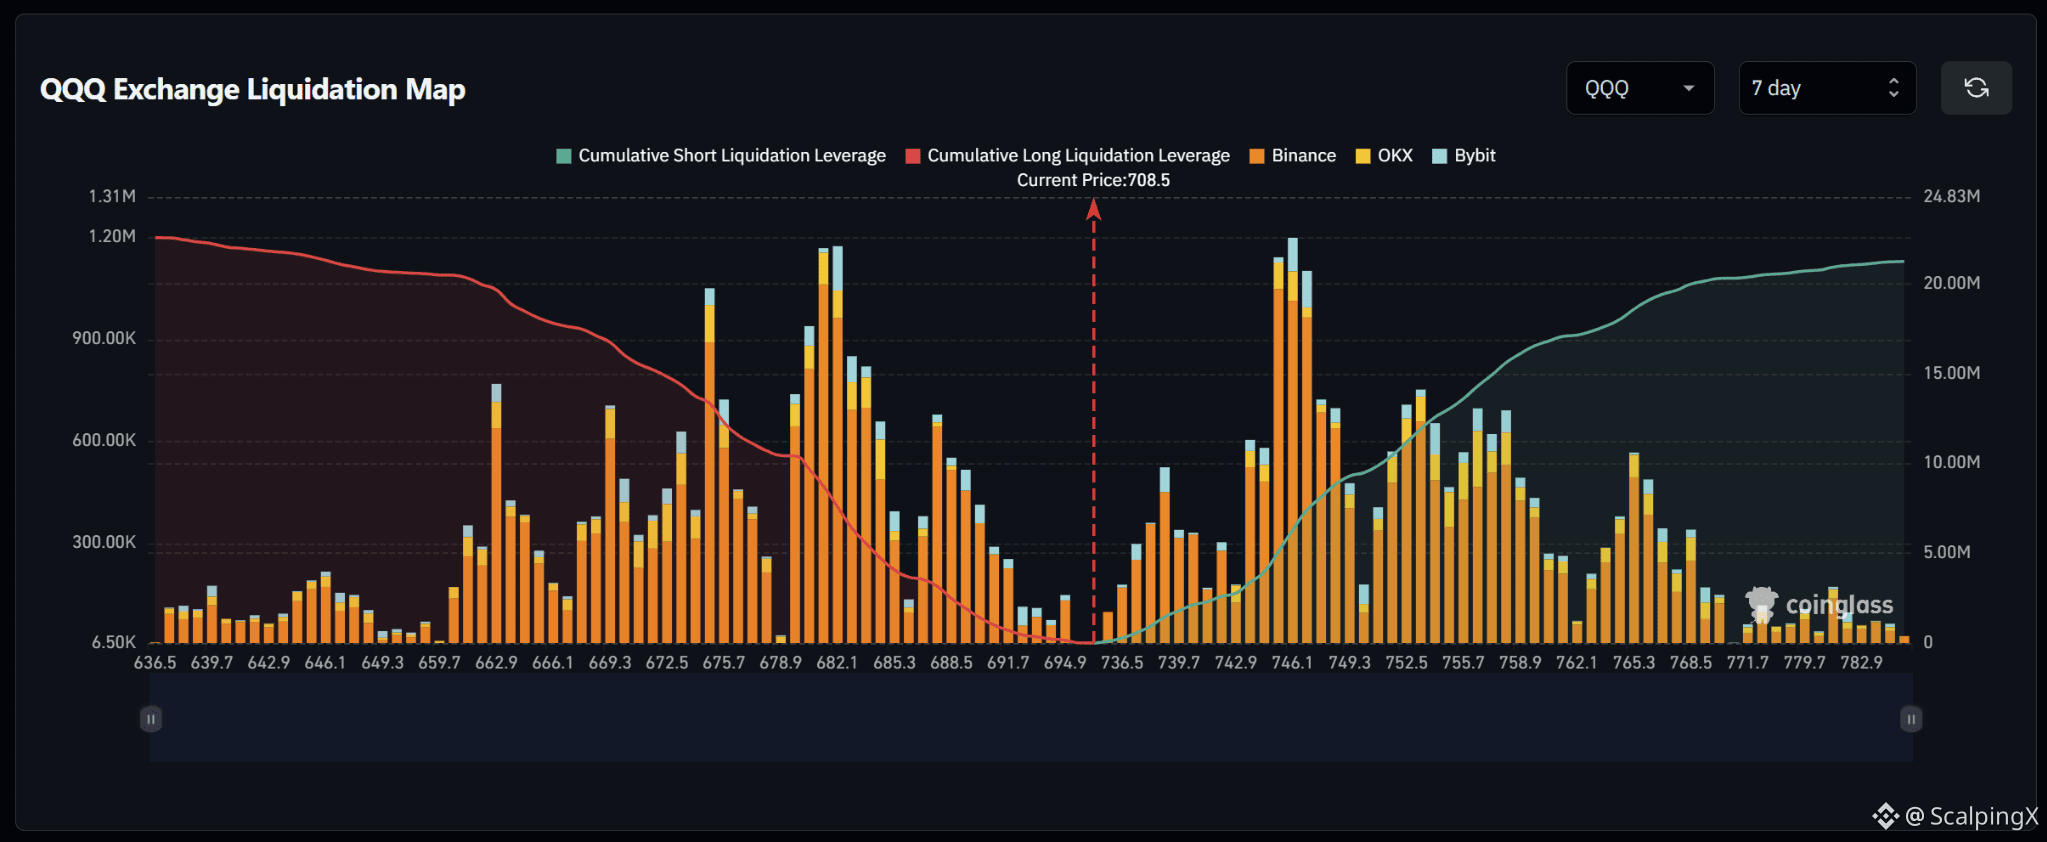
$QQQ – Ləğvetmə Xəritəsi (7 Gün) – Mövcud Qiymət 708.5
🔎 7 günlük ləğvetmə xəritəsi mövcud qiymətin altında təxminən 22 milyon ABŞ dolları dəyərində uzun mövqelərin ləğvini göstərir; bu, yuxarıda qısa ləğvlərdəki təxminən 21 milyon ABŞ dollarını bir qədər üstələyir. Ümumi struktur buna görə kifayət qədər balanslıdır, amma cüzi olaraq aşağı istiqamətə meyllidir.
📉 Bazarın altında uzun-ləğvetmə likvidliyi 688.5–675.7 aralığında xüsusilə sıx cəmlənib. Ən güclü qrup 682.1 yaxınlığında yerləşir; burada ləğvetmə zolağı təxminən 1.2 milyon ABŞ dollarına yaxınlaşır. 675.7 və 662.9 da 700,000–1 milyon ABŞ dolları ətrafında böyük qruplar saxlayır. 694.9 itirilsə, diqqət 688.5–682.1 aralığına yönələcək.
📈 Bazarın üstündə isə əhəmiyyətli qısa-ləğvetmə likvidliyi təxminən 736.5-dən etibarən daha aydın görünür və 742.9–749.3 aralığında kəskin şəkildə artır. Ən güclü qrup 746.1 yaxınlığında yerləşir; burada ləğvetmə zolağı təxminən 1.2 milyon ABŞ dollarına yaxınlaşır. Daha uzaqda 752.5–758.9 aralığında da bir neçə 500,000–750,000 ABŞ dolları həcmində qrup var.
🧭 Ümumilikdə quruluş nisbətən balanslı olaraq qalır, amma cüzi şəkildə aşağıya üstünlük verir. 694.9-un itirilməsi 688.5–682.1 istiqamətində “sweep” ehtimalını artırar, 736.5-dən yuxarı hərəkət isə diqqəti 742.9–749.3-ə yönəldər.
#LiquidationMap
$QQQ – Ləğvetmə Xəritəsi (7 Gün) – Mövcud Qiymət 708.5
🔎 7 günlük ləğvetmə xəritəsi mövcud qiymətin altında təxminən 22 milyon ABŞ dolları dəyərində uzun mövqelərin ləğvini göstərir; bu, yuxarıda qısa ləğvlərdəki təxminən 21 milyon ABŞ dollarını bir qədər üstələyir. Ümumi struktur buna görə kifayət qədər balanslıdır, amma cüzi olaraq aşağı istiqamətə meyllidir.
📉 Bazarın altında uzun-ləğvetmə likvidliyi 688.5–675.7 aralığında xüsusilə sıx cəmlənib. Ən güclü qrup 682.1 yaxınlığında yerləşir; burada ləğvetmə zolağı təxminən 1.2 milyon ABŞ dollarına yaxınlaşır. 675.7 və 662.9 da 700,000–1 milyon ABŞ dolları ətrafında böyük qruplar saxlayır. 694.9 itirilsə, diqqət 688.5–682.1 aralığına yönələcək.
📈 Bazarın üstündə isə əhəmiyyətli qısa-ləğvetmə likvidliyi təxminən 736.5-dən etibarən daha aydın görünür və 742.9–749.3 aralığında kəskin şəkildə artır. Ən güclü qrup 746.1 yaxınlığında yerləşir; burada ləğvetmə zolağı təxminən 1.2 milyon ABŞ dollarına yaxınlaşır. Daha uzaqda 752.5–758.9 aralığında da bir neçə 500,000–750,000 ABŞ dolları həcmində qrup var.
🧭 Ümumilikdə quruluş nisbətən balanslı olaraq qalır, amma cüzi şəkildə aşağıya üstünlük verir. 694.9-un itirilməsi 688.5–682.1 istiqamətində “sweep” ehtimalını artırar, 736.5-dən yuxarı hərəkət isə diqqəti 742.9–749.3-ə yönəldər.
#LiquidationMap
🔎 7 günlük ləğvetmə xəritəsi mövcud qiymətin altında təxminən 22 milyon ABŞ dolları dəyərində uzun mövqelərin ləğvini göstərir; bu, yuxarıda qısa ləğvlərdəki təxminən 21 milyon ABŞ dollarını bir qədər üstələyir. Ümumi struktur buna görə kifayət qədər balanslıdır, amma cüzi olaraq aşağı istiqamətə meyllidir.
📉 Bazarın altında uzun-ləğvetmə likvidliyi 688.5–675.7 aralığında xüsusilə sıx cəmlənib. Ən güclü qrup 682.1 yaxınlığında yerləşir; burada ləğvetmə zolağı təxminən 1.2 milyon ABŞ dollarına yaxınlaşır. 675.7 və 662.9 da 700,000–1 milyon ABŞ dolları ətrafında böyük qruplar saxlayır. 694.9 itirilsə, diqqət 688.5–682.1 aralığına yönələcək.
📈 Bazarın üstündə isə əhəmiyyətli qısa-ləğvetmə likvidliyi təxminən 736.5-dən etibarən daha aydın görünür və 742.9–749.3 aralığında kəskin şəkildə artır. Ən güclü qrup 746.1 yaxınlığında yerləşir; burada ləğvetmə zolağı təxminən 1.2 milyon ABŞ dollarına yaxınlaşır. Daha uzaqda 752.5–758.9 aralığında da bir neçə 500,000–750,000 ABŞ dolları həcmində qrup var.
🧭 Ümumilikdə quruluş nisbətən balanslı olaraq qalır, amma cüzi şəkildə aşağıya üstünlük verir. 694.9-un itirilməsi 688.5–682.1 istiqamətində “sweep” ehtimalını artırar, 736.5-dən yuxarı hərəkət isə diqqəti 742.9–749.3-ə yönəldər.
#LiquidationMap
14
·
--
Artım
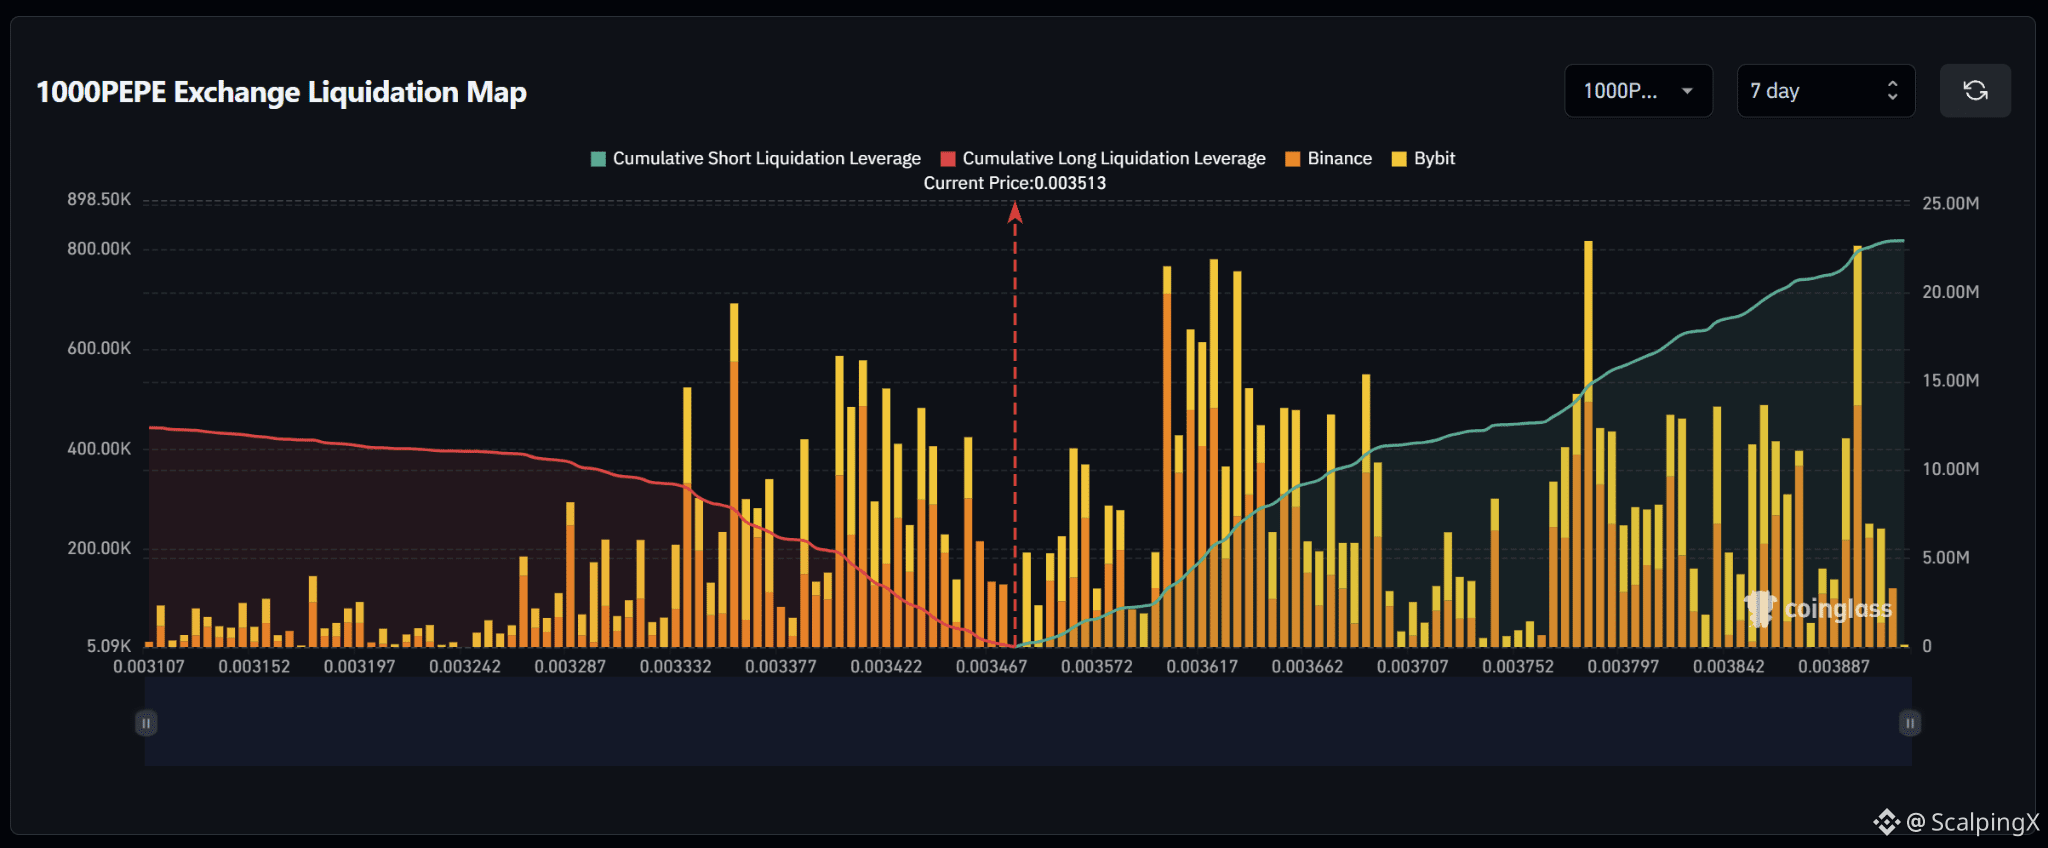
$PEPE – Ləğvetmə Xəritəsi (7 Gün) – Cari Qiymət 0.003513
🔎 7 günlük ləğvetmə xəritəsi cari qiymətdən yuxarıda təxminən 22–23 milyon ABŞ dolları qısa likvidasiya olduğunu göstərir; bu rəqəm aşağıda təxminən 12 milyon ABŞ dolları olan uzun likvidizasiyanın demək olar ki, iki qatıdır. Likvidlik strukturu isə açıq şəkildə yüksəlişi dəstəkləyir: bazarın üstündə yığılan ümumi likvidlik təxminən 1.8–1.9 dəfə daha çoxdur.
📉 Bazarın aşağısında yaxın long-likvidasiya likvidliyi 0.003467–0.003377 aralığında cəmlənib. Əhəmiyyətli klasterlər 0.003422–0.003377 zonasında görünür; burada bir neçə ləğvetmə zolağı təxminən 400,000–600,000 ABŞ dollarına çatır. Daha aşağıda, 0.003332 səviyyəsi də təxminən 500,000 ABŞ dolları yaxınlığında böyük bir klaster ehtiva edir. 0.003467 itirilməsi diqqəti 0.003422–0.003377 tərəfə yönəldə bilər.
📈 Bazarın yuxarısında isə qısa-likvidasiya likvidliyi təxminən 0.003572-dən yığılmağa başlayır və 0.00360–0.00366 aralığında kəskin şəkildə artır; burada bir neçə zolaq təxminən 600,000–780,000 ABŞ dollarına çatır. Daha uzaqda 0.003797 və 0.003887 seçilir: zolaqları təxminən 800,000 ABŞ dolları civarındadır və yüksəliş üzrə ən böyük klasterlərdən birini təşkil edir.
🧭 Ümumi quruluş yüksəlişi daha çox dəstəkləyir, çünki yuxarıdakı qısa-likvidasiya məruz qalması demək olar ki, iki dəfədir. 0.003572-nin qırılması 0.00360–0.00366 istiqamətində “süpürmə” ehtimalını artırar, 0.003467-in itirilməsi isə diqqəti 0.003422–0.003377 tərəfə keçirər.
#LiquidationMap
$PEPE – Ləğvetmə Xəritəsi (7 Gün) – Cari Qiymət 0.003513
🔎 7 günlük ləğvetmə xəritəsi cari qiymətdən yuxarıda təxminən 22–23 milyon ABŞ dolları qısa likvidasiya olduğunu göstərir; bu rəqəm aşağıda təxminən 12 milyon ABŞ dolları olan uzun likvidizasiyanın demək olar ki, iki qatıdır. Likvidlik strukturu isə açıq şəkildə yüksəlişi dəstəkləyir: bazarın üstündə yığılan ümumi likvidlik təxminən 1.8–1.9 dəfə daha çoxdur.
📉 Bazarın aşağısında yaxın long-likvidasiya likvidliyi 0.003467–0.003377 aralığında cəmlənib. Əhəmiyyətli klasterlər 0.003422–0.003377 zonasında görünür; burada bir neçə ləğvetmə zolağı təxminən 400,000–600,000 ABŞ dollarına çatır. Daha aşağıda, 0.003332 səviyyəsi də təxminən 500,000 ABŞ dolları yaxınlığında böyük bir klaster ehtiva edir. 0.003467 itirilməsi diqqəti 0.003422–0.003377 tərəfə yönəldə bilər.
📈 Bazarın yuxarısında isə qısa-likvidasiya likvidliyi təxminən 0.003572-dən yığılmağa başlayır və 0.00360–0.00366 aralığında kəskin şəkildə artır; burada bir neçə zolaq təxminən 600,000–780,000 ABŞ dollarına çatır. Daha uzaqda 0.003797 və 0.003887 seçilir: zolaqları təxminən 800,000 ABŞ dolları civarındadır və yüksəliş üzrə ən böyük klasterlərdən birini təşkil edir.
🧭 Ümumi quruluş yüksəlişi daha çox dəstəkləyir, çünki yuxarıdakı qısa-likvidasiya məruz qalması demək olar ki, iki dəfədir. 0.003572-nin qırılması 0.00360–0.00366 istiqamətində “süpürmə” ehtimalını artırar, 0.003467-in itirilməsi isə diqqəti 0.003422–0.003377 tərəfə keçirər.
#LiquidationMap
🔎 7 günlük ləğvetmə xəritəsi cari qiymətdən yuxarıda təxminən 22–23 milyon ABŞ dolları qısa likvidasiya olduğunu göstərir; bu rəqəm aşağıda təxminən 12 milyon ABŞ dolları olan uzun likvidizasiyanın demək olar ki, iki qatıdır. Likvidlik strukturu isə açıq şəkildə yüksəlişi dəstəkləyir: bazarın üstündə yığılan ümumi likvidlik təxminən 1.8–1.9 dəfə daha çoxdur.
📉 Bazarın aşağısında yaxın long-likvidasiya likvidliyi 0.003467–0.003377 aralığında cəmlənib. Əhəmiyyətli klasterlər 0.003422–0.003377 zonasında görünür; burada bir neçə ləğvetmə zolağı təxminən 400,000–600,000 ABŞ dollarına çatır. Daha aşağıda, 0.003332 səviyyəsi də təxminən 500,000 ABŞ dolları yaxınlığında böyük bir klaster ehtiva edir. 0.003467 itirilməsi diqqəti 0.003422–0.003377 tərəfə yönəldə bilər.
📈 Bazarın yuxarısında isə qısa-likvidasiya likvidliyi təxminən 0.003572-dən yığılmağa başlayır və 0.00360–0.00366 aralığında kəskin şəkildə artır; burada bir neçə zolaq təxminən 600,000–780,000 ABŞ dollarına çatır. Daha uzaqda 0.003797 və 0.003887 seçilir: zolaqları təxminən 800,000 ABŞ dolları civarındadır və yüksəliş üzrə ən böyük klasterlərdən birini təşkil edir.
🧭 Ümumi quruluş yüksəlişi daha çox dəstəkləyir, çünki yuxarıdakı qısa-likvidasiya məruz qalması demək olar ki, iki dəfədir. 0.003572-nin qırılması 0.00360–0.00366 istiqamətində “süpürmə” ehtimalını artırar, 0.003467-in itirilməsi isə diqqəti 0.003422–0.003377 tərəfə keçirər.
#LiquidationMap
1
23
·
--
Artım
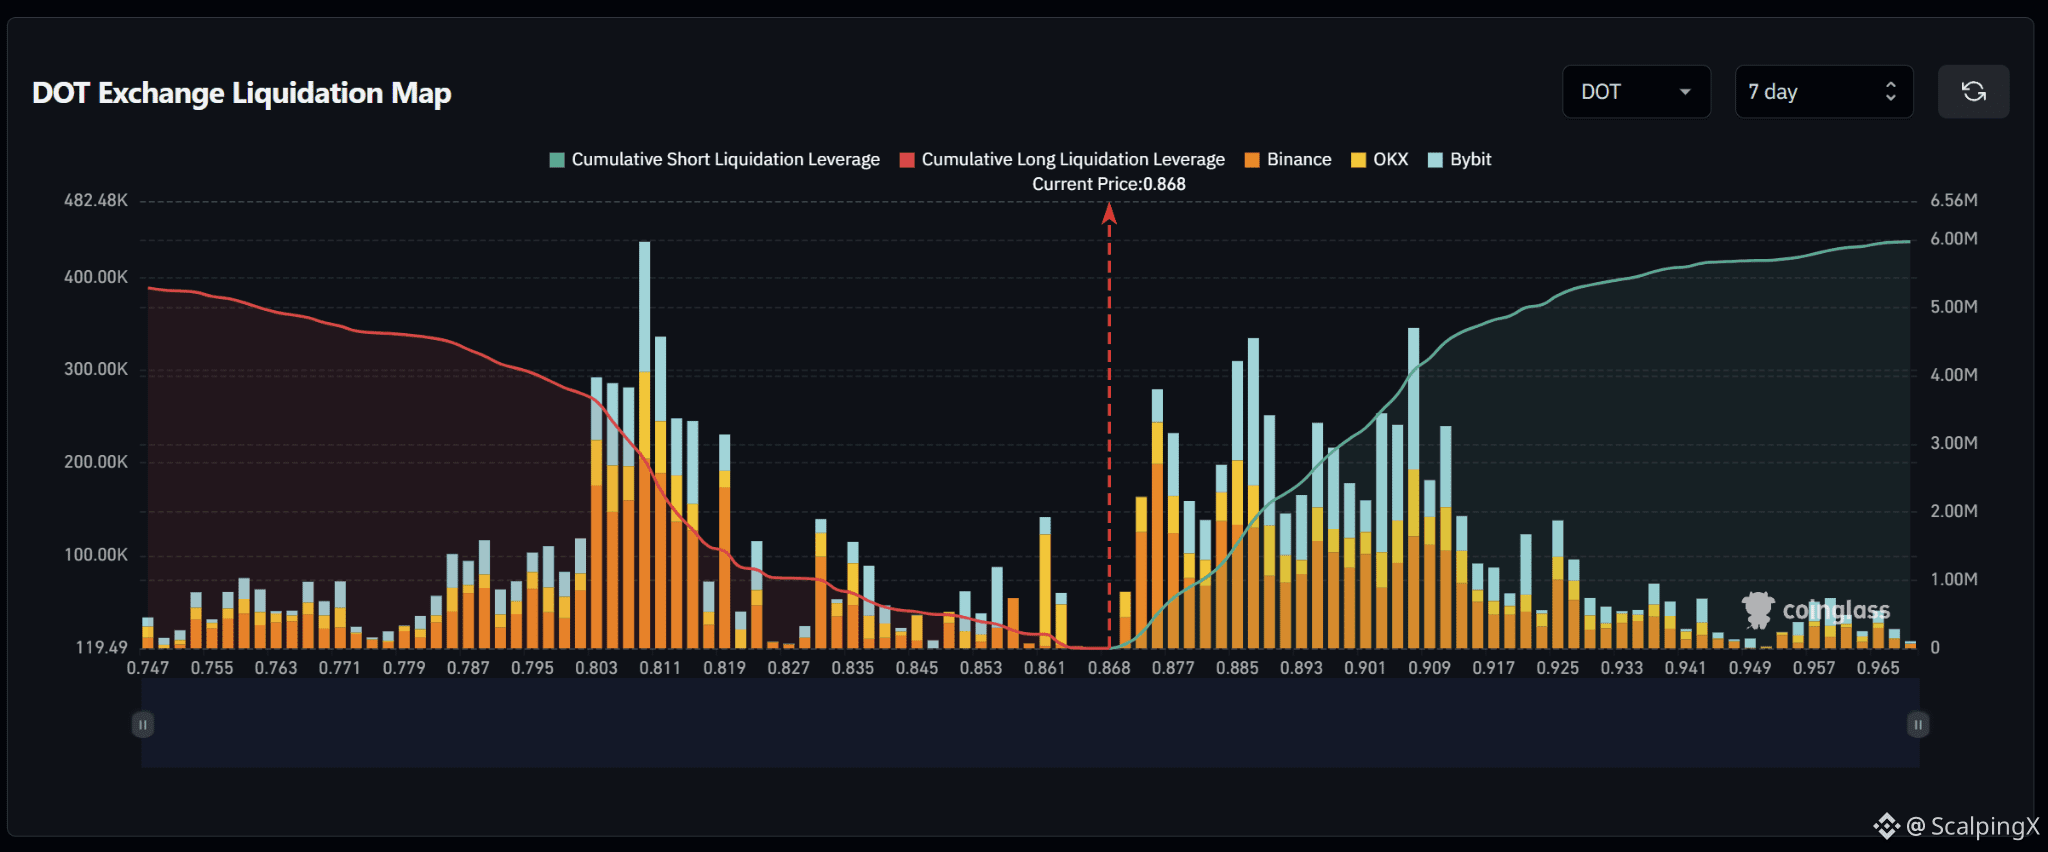
$DOT – Ləğvetmə Xəritəsi (7 Gün) – Mövcud Qiymət 0.868
🔎 7 günlük ləğvetmə xəritəsi mövcud qiymətdən yuxarıda təxminən 6 milyon ABŞ dolları məbləğində qısa ləğvetməni göstərir; bu isə mövcud qiymətdən aşağıda təxminən 5.3 milyon ABŞ dolları məbləğində uzun ləğvetməni bir qədər üstələyir. Ümumi struktur nisbətən balanslıdır, amma müəyyən dərəcədə yuxarı istiqamətə meyllidir.
📉 Bazarın aşağısında, yaxın uzun-ləğvetmə likvidliyi 0.861–0.845 aralığında nisbətən seyrəkdir; daha sonra 0.835–0.803 aralığında artmağa başlayır. Ən güclü qrup 0.811 ətrafında yerləşir və burada ləğvetmə çubuğu 400,000 ABŞ dollarından çoxdur. 0.803–0.819 aralığında da bir neçə 200,000–300,000 ABŞ dolları dəyərində klaster var. Əgər 0.861 itərsə, diqqət 0.853–0.835 istiqamətinə yönələcək.
📈 Bazarın yuxarısında isə qısa-ləğvetmə likvidliyi 0.877 ətrafından yığılmağa başlayır və 0.885–0.909 aralığında xeyli sıxlaşır. 0.885 və 0.909 yaxınlığındakı ən güclü klasterlər təxminən 300,000–350,000 ABŞ dollarına çatır. Daha uzaqda isə 0.917–0.925 aralığı da nəzərə çarpan likvidlik ehtiva edir.
🧭 Daha geniş ssenari yuxarı tərəfi modest şəkildə dəstəkləyir, çünki yuxarıda qısa-ləğvetmə üzrə ekspozisiya daha böyükdür. 0.877-nin qırılması 0.885–0.909 istiqamətində “sweep” ehtimalını artırar, 0.861-in itməsi isə diqqəti 0.853–0.835 istiqamətinə keçirər.
#LiquidationMap
$DOT – Ləğvetmə Xəritəsi (7 Gün) – Mövcud Qiymət 0.868
🔎 7 günlük ləğvetmə xəritəsi mövcud qiymətdən yuxarıda təxminən 6 milyon ABŞ dolları məbləğində qısa ləğvetməni göstərir; bu isə mövcud qiymətdən aşağıda təxminən 5.3 milyon ABŞ dolları məbləğində uzun ləğvetməni bir qədər üstələyir. Ümumi struktur nisbətən balanslıdır, amma müəyyən dərəcədə yuxarı istiqamətə meyllidir.
📉 Bazarın aşağısında, yaxın uzun-ləğvetmə likvidliyi 0.861–0.845 aralığında nisbətən seyrəkdir; daha sonra 0.835–0.803 aralığında artmağa başlayır. Ən güclü qrup 0.811 ətrafında yerləşir və burada ləğvetmə çubuğu 400,000 ABŞ dollarından çoxdur. 0.803–0.819 aralığında da bir neçə 200,000–300,000 ABŞ dolları dəyərində klaster var. Əgər 0.861 itərsə, diqqət 0.853–0.835 istiqamətinə yönələcək.
📈 Bazarın yuxarısında isə qısa-ləğvetmə likvidliyi 0.877 ətrafından yığılmağa başlayır və 0.885–0.909 aralığında xeyli sıxlaşır. 0.885 və 0.909 yaxınlığındakı ən güclü klasterlər təxminən 300,000–350,000 ABŞ dollarına çatır. Daha uzaqda isə 0.917–0.925 aralığı da nəzərə çarpan likvidlik ehtiva edir.
🧭 Daha geniş ssenari yuxarı tərəfi modest şəkildə dəstəkləyir, çünki yuxarıda qısa-ləğvetmə üzrə ekspozisiya daha böyükdür. 0.877-nin qırılması 0.885–0.909 istiqamətində “sweep” ehtimalını artırar, 0.861-in itməsi isə diqqəti 0.853–0.835 istiqamətinə keçirər.
#LiquidationMap
🔎 7 günlük ləğvetmə xəritəsi mövcud qiymətdən yuxarıda təxminən 6 milyon ABŞ dolları məbləğində qısa ləğvetməni göstərir; bu isə mövcud qiymətdən aşağıda təxminən 5.3 milyon ABŞ dolları məbləğində uzun ləğvetməni bir qədər üstələyir. Ümumi struktur nisbətən balanslıdır, amma müəyyən dərəcədə yuxarı istiqamətə meyllidir.
📉 Bazarın aşağısında, yaxın uzun-ləğvetmə likvidliyi 0.861–0.845 aralığında nisbətən seyrəkdir; daha sonra 0.835–0.803 aralığında artmağa başlayır. Ən güclü qrup 0.811 ətrafında yerləşir və burada ləğvetmə çubuğu 400,000 ABŞ dollarından çoxdur. 0.803–0.819 aralığında da bir neçə 200,000–300,000 ABŞ dolları dəyərində klaster var. Əgər 0.861 itərsə, diqqət 0.853–0.835 istiqamətinə yönələcək.
📈 Bazarın yuxarısında isə qısa-ləğvetmə likvidliyi 0.877 ətrafından yığılmağa başlayır və 0.885–0.909 aralığında xeyli sıxlaşır. 0.885 və 0.909 yaxınlığındakı ən güclü klasterlər təxminən 300,000–350,000 ABŞ dollarına çatır. Daha uzaqda isə 0.917–0.925 aralığı da nəzərə çarpan likvidlik ehtiva edir.
🧭 Daha geniş ssenari yuxarı tərəfi modest şəkildə dəstəkləyir, çünki yuxarıda qısa-ləğvetmə üzrə ekspozisiya daha böyükdür. 0.877-nin qırılması 0.885–0.909 istiqamətində “sweep” ehtimalını artırar, 0.861-in itməsi isə diqqəti 0.853–0.835 istiqamətinə keçirər.
#LiquidationMap
37
·
--
Artım
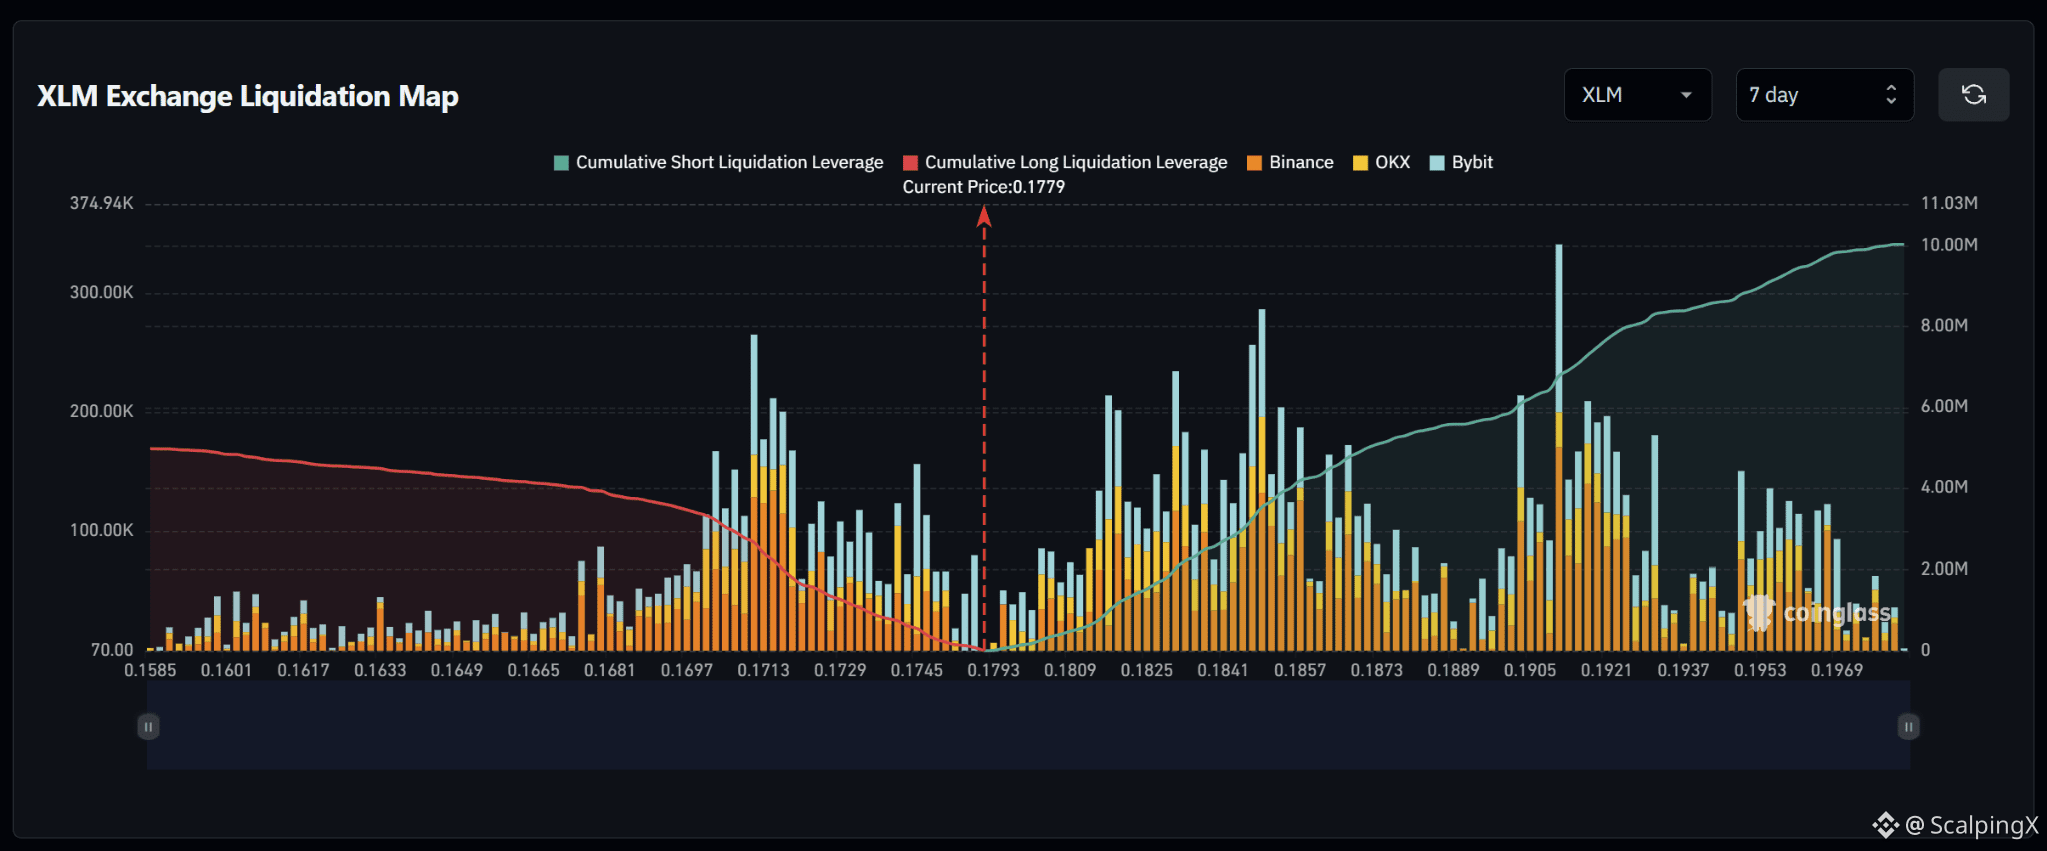
$XLM – Likvidasiya xəritəsi (7 gün) – Cari qiymət 0.1779
🔎 7 günlük likvidasiya xəritəsi cari qiymətin üstündə təxminən 10 milyon ABŞ dolları dəyərində qısa (short) likvidasiyalar göstərir; bu, cari qiymətin altında olan təxminən 5 milyon ABŞ dolları dəyərində uzun (long) likvidasiyalarla müqayisədə demək olar ki, iki dəfə çoxdur. Likvidlik strukturu buna görə açıq şəkildə yüksəlişi (upside) dəstəkləyir.
📉 Bazarın alt tərəfində yaxın zonadakı uzun likvidasiya likvidliyi 0.1745–0.1713 ətrafında cəmlənib. Ən güclü klaster 0.1713 yaxınlığında yerləşir; burada likvidasiya şkalası təxminən 250,000–270,000 ABŞ dollarına çatır, eyni zamanda 0.1697–0.1681 aralığı da əhəmiyyətli likvidlik ehtiva edir. 0.1745-i itirmək 0.1729–0.1713 istiqamətində “süpürmə” ehtimalını artırar.
📈 Bazarın üst tərəfində qısa likvidasiya likvidliyi 0.1809-dan başlayaraq formalaşır və 0.1825–0.1857 aralığında daha sıx olur. Daha uzaqda 0.1905–0.1921 daha aydın seçilir; ən böyük şırnaqlı (bar) 0.1905 yaxınlığında olub 300,000 ABŞ dollarını keçir. 0.1809-dan yuxarı qırılma ilk olaraq 0.1825–0.1857 zonasını diqqətə gətirər.
🧭 Ümumi quruluş yüksəlişi lehinədir, çünki üst zonadakı qısa likvidasiya üzrə məruz qalma (exposure) demək olar ki, iki dəfə böyükdür. 0.1809-dan yuxarı qırılma 0.1825–0.1857 istiqamətində süpürmə ehtimalını artırar, 0.1745-i itirmək isə diqqəti 0.1729–0.1713-ə yönəldər.
#LiquidationMap
$XLM – Likvidasiya xəritəsi (7 gün) – Cari qiymət 0.1779
🔎 7 günlük likvidasiya xəritəsi cari qiymətin üstündə təxminən 10 milyon ABŞ dolları dəyərində qısa (short) likvidasiyalar göstərir; bu, cari qiymətin altında olan təxminən 5 milyon ABŞ dolları dəyərində uzun (long) likvidasiyalarla müqayisədə demək olar ki, iki dəfə çoxdur. Likvidlik strukturu buna görə açıq şəkildə yüksəlişi (upside) dəstəkləyir.
📉 Bazarın alt tərəfində yaxın zonadakı uzun likvidasiya likvidliyi 0.1745–0.1713 ətrafında cəmlənib. Ən güclü klaster 0.1713 yaxınlığında yerləşir; burada likvidasiya şkalası təxminən 250,000–270,000 ABŞ dollarına çatır, eyni zamanda 0.1697–0.1681 aralığı da əhəmiyyətli likvidlik ehtiva edir. 0.1745-i itirmək 0.1729–0.1713 istiqamətində “süpürmə” ehtimalını artırar.
📈 Bazarın üst tərəfində qısa likvidasiya likvidliyi 0.1809-dan başlayaraq formalaşır və 0.1825–0.1857 aralığında daha sıx olur. Daha uzaqda 0.1905–0.1921 daha aydın seçilir; ən böyük şırnaqlı (bar) 0.1905 yaxınlığında olub 300,000 ABŞ dollarını keçir. 0.1809-dan yuxarı qırılma ilk olaraq 0.1825–0.1857 zonasını diqqətə gətirər.
🧭 Ümumi quruluş yüksəlişi lehinədir, çünki üst zonadakı qısa likvidasiya üzrə məruz qalma (exposure) demək olar ki, iki dəfə böyükdür. 0.1809-dan yuxarı qırılma 0.1825–0.1857 istiqamətində süpürmə ehtimalını artırar, 0.1745-i itirmək isə diqqəti 0.1729–0.1713-ə yönəldər.
#LiquidationMap
🔎 7 günlük likvidasiya xəritəsi cari qiymətin üstündə təxminən 10 milyon ABŞ dolları dəyərində qısa (short) likvidasiyalar göstərir; bu, cari qiymətin altında olan təxminən 5 milyon ABŞ dolları dəyərində uzun (long) likvidasiyalarla müqayisədə demək olar ki, iki dəfə çoxdur. Likvidlik strukturu buna görə açıq şəkildə yüksəlişi (upside) dəstəkləyir.
📉 Bazarın alt tərəfində yaxın zonadakı uzun likvidasiya likvidliyi 0.1745–0.1713 ətrafında cəmlənib. Ən güclü klaster 0.1713 yaxınlığında yerləşir; burada likvidasiya şkalası təxminən 250,000–270,000 ABŞ dollarına çatır, eyni zamanda 0.1697–0.1681 aralığı da əhəmiyyətli likvidlik ehtiva edir. 0.1745-i itirmək 0.1729–0.1713 istiqamətində “süpürmə” ehtimalını artırar.
📈 Bazarın üst tərəfində qısa likvidasiya likvidliyi 0.1809-dan başlayaraq formalaşır və 0.1825–0.1857 aralığında daha sıx olur. Daha uzaqda 0.1905–0.1921 daha aydın seçilir; ən böyük şırnaqlı (bar) 0.1905 yaxınlığında olub 300,000 ABŞ dollarını keçir. 0.1809-dan yuxarı qırılma ilk olaraq 0.1825–0.1857 zonasını diqqətə gətirər.
🧭 Ümumi quruluş yüksəlişi lehinədir, çünki üst zonadakı qısa likvidasiya üzrə məruz qalma (exposure) demək olar ki, iki dəfə böyükdür. 0.1809-dan yuxarı qırılma 0.1825–0.1857 istiqamətində süpürmə ehtimalını artırar, 0.1745-i itirmək isə diqqəti 0.1729–0.1713-ə yönəldər.
#LiquidationMap
19
·
--
Artım
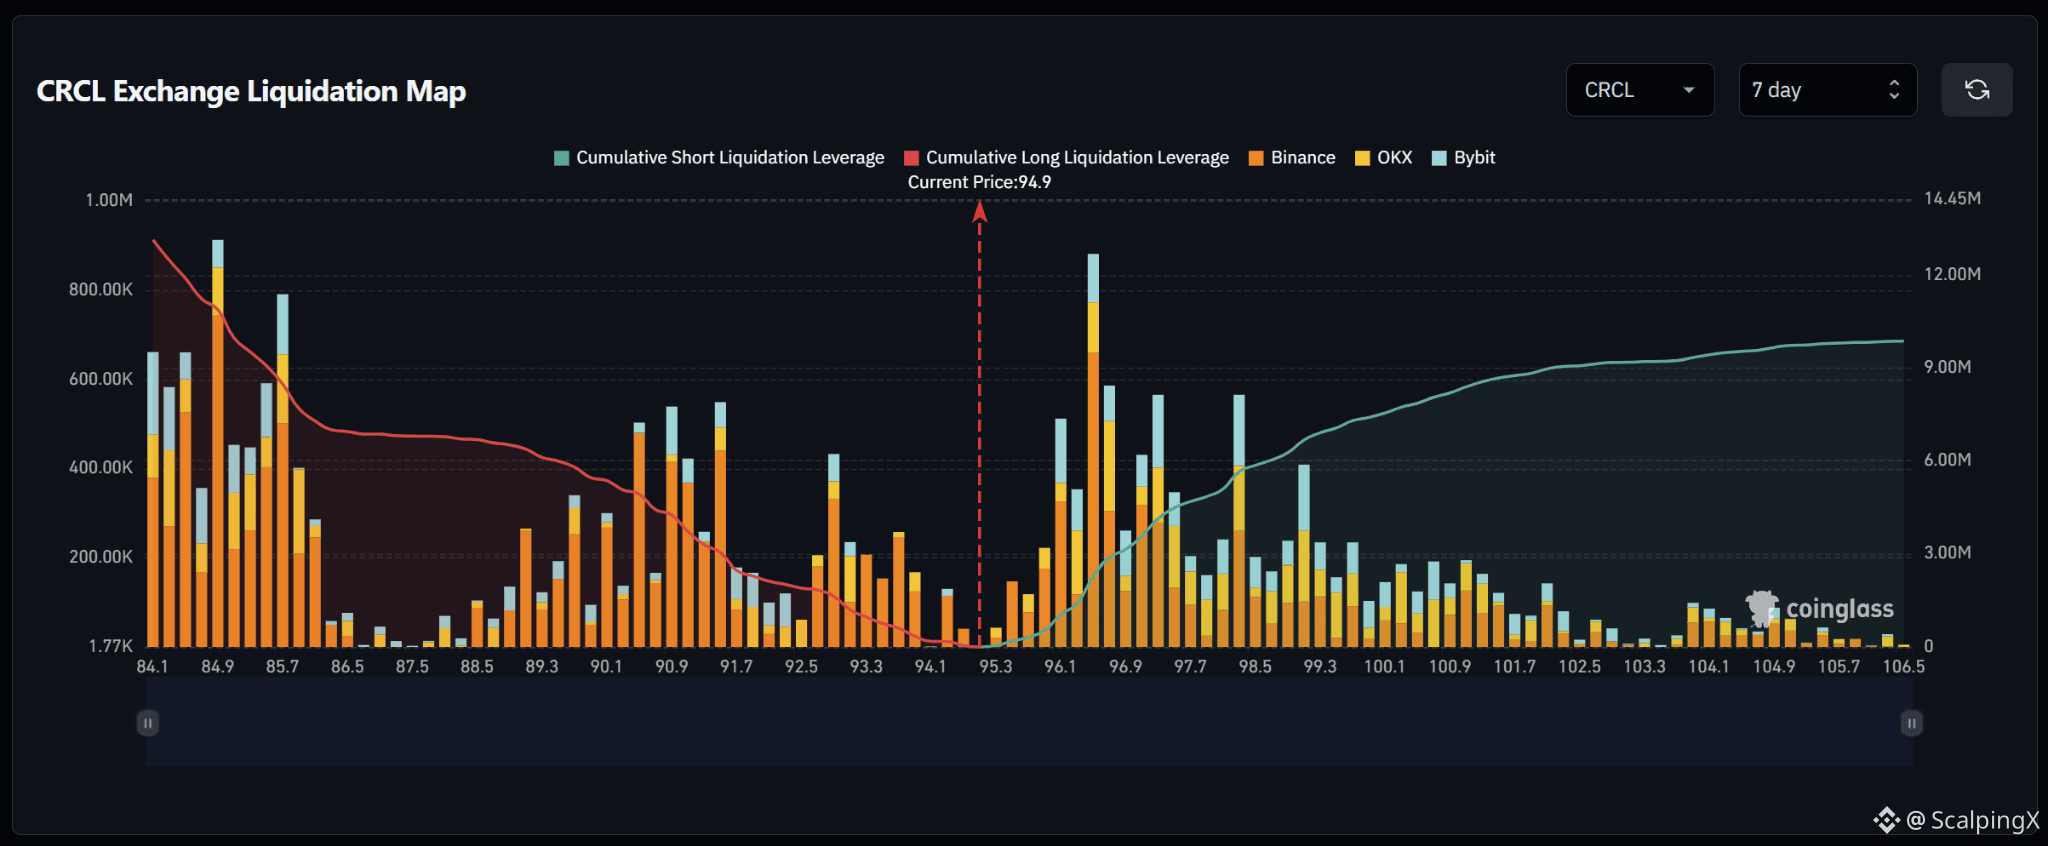
$CRCL – Ləğv Xəritəsi (7 Gün) – Cari Qiymət 94.9
🔎 7 günlük ləğv xəritəsi cari qiymətə görə təxminən 13 milyon ABŞ dolları həcmində long (uzun) ləğvlərdən ibarət olduğunu göstərir; yuxarıda isə təxminən 9–10 milyon ABŞ dolları həcmində short (qısa) ləğvlərdən üstələyir. Likvidlik strukturu buna görə enişə üstünlük verir: bazarın altında yığılmış cəmi likvidlik təxminən 1.3–1.4 dəfə daha çoxdur.
📉 Bazarın aşağı hissəsində, yaxın long-ləğv likvidliyi 94.1 ətrafında nisbətən nazikdir; daha sonra 93.3–92.5 aralığında artır. Daha aşağıda isə 91.7–90.1 daxilində 300,000–550,000 ABŞ dolları ətrafında bir neçə klaster var. 94.1-in itirilməsi 93.3–92.5 istiqamətində “sweep” (süpürmə) ehtimalını artırar.
📈 Bazarın yuxarısında, short-ləğv likvidliyi 95.3–96.1 aralığında formalaşmağa başlayır və 96.1–96.9 boyunca kəskin şəkildə artır. Ən güclü yaxın klaster 96.5 ətrafındadır; burada ləğv barı təxminən 900,000 ABŞ dollarına yaxınlaşır. Daha uzaqda isə 97.7–99.3 aralığında da nəzərəçarpan likvidlik mövcuddur. 95.3-dən yuxarı qırılma əvvəlcə 96.1–96.9 zonalarını diqqət mərkəzinə gətirər.
🧭 Ümumi quruluş modest şəkildə enişə üstünlük verir, çünki aşağıda long-ləğv ekspozisiyası təxminən 1.3–1.4 dəfə böyükdür. 94.1-in itirilməsi 93.3–92.5 istiqamətində süpürmə ehtimalını artırar, 95.3-dən yuxarı qırılma isə diqqəti 96.1–96.9-a yönəldər.
#LiquidationMap
$CRCL – Ləğv Xəritəsi (7 Gün) – Cari Qiymət 94.9
🔎 7 günlük ləğv xəritəsi cari qiymətə görə təxminən 13 milyon ABŞ dolları həcmində long (uzun) ləğvlərdən ibarət olduğunu göstərir; yuxarıda isə təxminən 9–10 milyon ABŞ dolları həcmində short (qısa) ləğvlərdən üstələyir. Likvidlik strukturu buna görə enişə üstünlük verir: bazarın altında yığılmış cəmi likvidlik təxminən 1.3–1.4 dəfə daha çoxdur.
📉 Bazarın aşağı hissəsində, yaxın long-ləğv likvidliyi 94.1 ətrafında nisbətən nazikdir; daha sonra 93.3–92.5 aralığında artır. Daha aşağıda isə 91.7–90.1 daxilində 300,000–550,000 ABŞ dolları ətrafında bir neçə klaster var. 94.1-in itirilməsi 93.3–92.5 istiqamətində “sweep” (süpürmə) ehtimalını artırar.
📈 Bazarın yuxarısında, short-ləğv likvidliyi 95.3–96.1 aralığında formalaşmağa başlayır və 96.1–96.9 boyunca kəskin şəkildə artır. Ən güclü yaxın klaster 96.5 ətrafındadır; burada ləğv barı təxminən 900,000 ABŞ dollarına yaxınlaşır. Daha uzaqda isə 97.7–99.3 aralığında da nəzərəçarpan likvidlik mövcuddur. 95.3-dən yuxarı qırılma əvvəlcə 96.1–96.9 zonalarını diqqət mərkəzinə gətirər.
🧭 Ümumi quruluş modest şəkildə enişə üstünlük verir, çünki aşağıda long-ləğv ekspozisiyası təxminən 1.3–1.4 dəfə böyükdür. 94.1-in itirilməsi 93.3–92.5 istiqamətində süpürmə ehtimalını artırar, 95.3-dən yuxarı qırılma isə diqqəti 96.1–96.9-a yönəldər.
#LiquidationMap
🔎 7 günlük ləğv xəritəsi cari qiymətə görə təxminən 13 milyon ABŞ dolları həcmində long (uzun) ləğvlərdən ibarət olduğunu göstərir; yuxarıda isə təxminən 9–10 milyon ABŞ dolları həcmində short (qısa) ləğvlərdən üstələyir. Likvidlik strukturu buna görə enişə üstünlük verir: bazarın altında yığılmış cəmi likvidlik təxminən 1.3–1.4 dəfə daha çoxdur.
📉 Bazarın aşağı hissəsində, yaxın long-ləğv likvidliyi 94.1 ətrafında nisbətən nazikdir; daha sonra 93.3–92.5 aralığında artır. Daha aşağıda isə 91.7–90.1 daxilində 300,000–550,000 ABŞ dolları ətrafında bir neçə klaster var. 94.1-in itirilməsi 93.3–92.5 istiqamətində “sweep” (süpürmə) ehtimalını artırar.
📈 Bazarın yuxarısında, short-ləğv likvidliyi 95.3–96.1 aralığında formalaşmağa başlayır və 96.1–96.9 boyunca kəskin şəkildə artır. Ən güclü yaxın klaster 96.5 ətrafındadır; burada ləğv barı təxminən 900,000 ABŞ dollarına yaxınlaşır. Daha uzaqda isə 97.7–99.3 aralığında da nəzərəçarpan likvidlik mövcuddur. 95.3-dən yuxarı qırılma əvvəlcə 96.1–96.9 zonalarını diqqət mərkəzinə gətirər.
🧭 Ümumi quruluş modest şəkildə enişə üstünlük verir, çünki aşağıda long-ləğv ekspozisiyası təxminən 1.3–1.4 dəfə böyükdür. 94.1-in itirilməsi 93.3–92.5 istiqamətində süpürmə ehtimalını artırar, 95.3-dən yuxarı qırılma isə diqqəti 96.1–96.9-a yönəldər.
#LiquidationMap
23
·
--
Artım
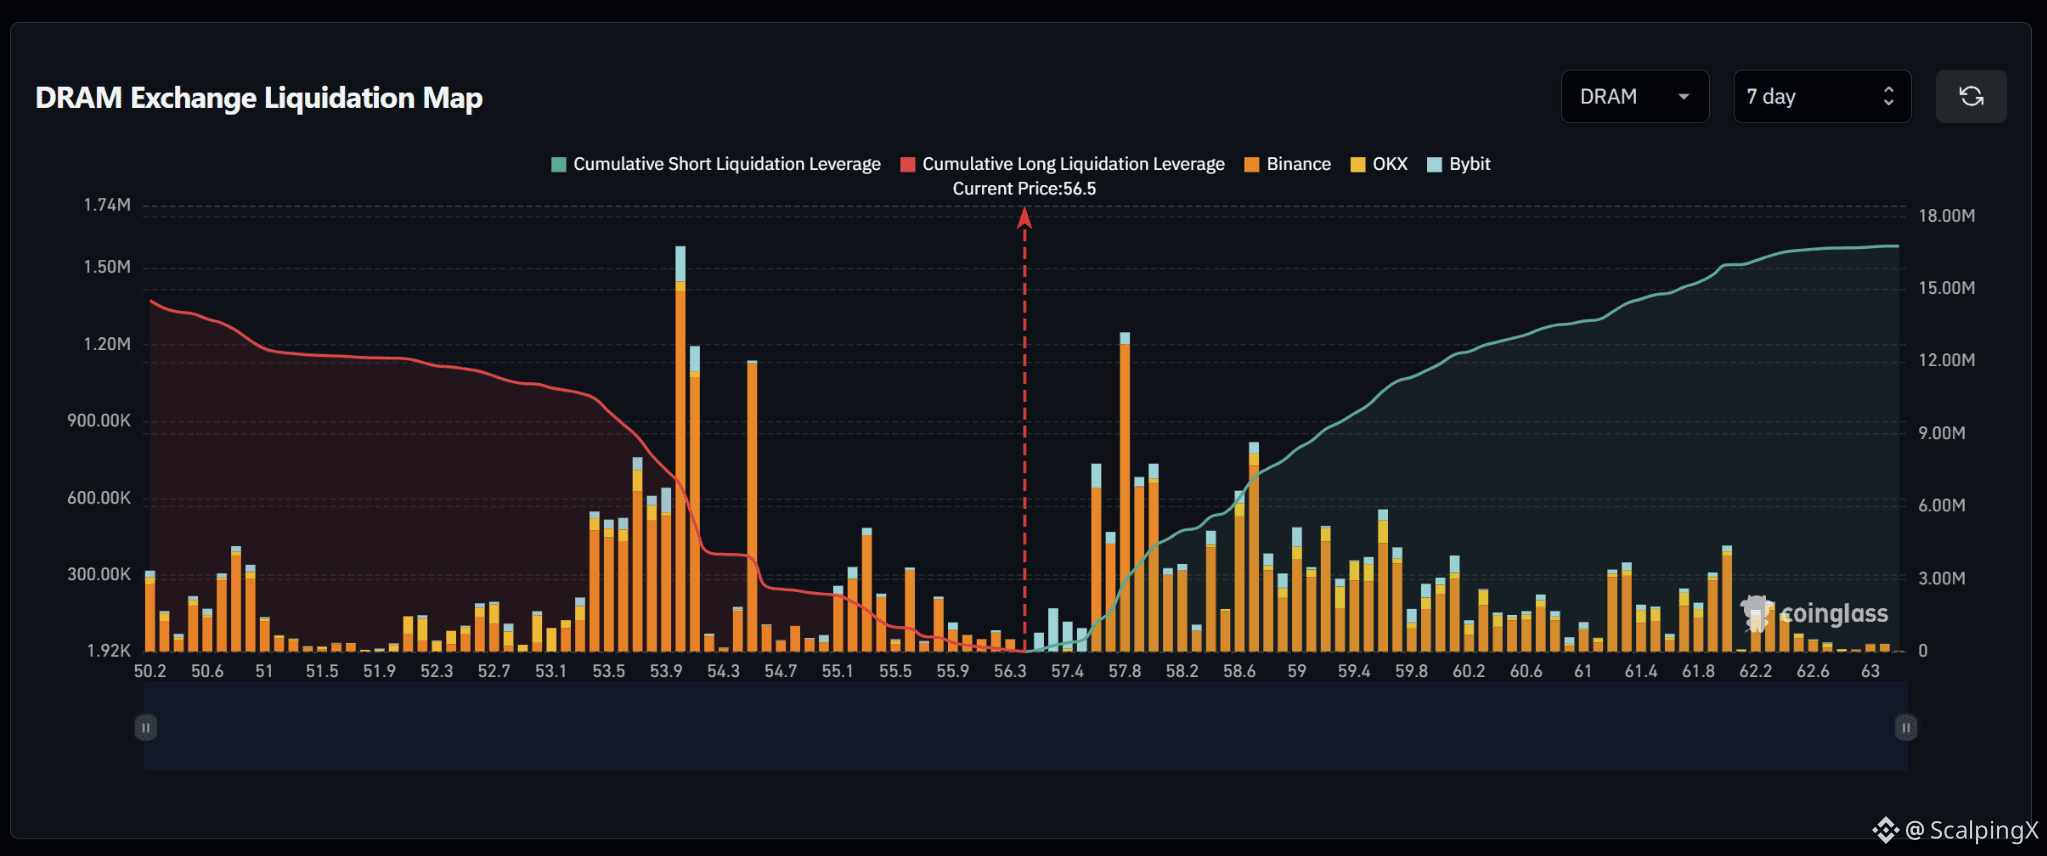
$DRAM – Ləğvetmə xəritəsi (7 gün) – Cari qiymət 56.5
🔎 7 günlük ləğvetmə xəritəsi cari qiymətin üstündə təxminən 16 milyon ABŞ dolları məbləğində qısa (short) ləğvetmələri göstərir; bu, cari qiymətin altında təxminən 14–15 milyon ABŞ dolları məbləğində uzun (long) ləğvetmələri bir az üstələyir. Ümumi struktur kifayət qədər balanslıdır, amma bir qədər yuxarı tərəfə meyllidir.
📉 Bazarın altında, yaxın long-ləğvetmə likvidliyi 55.9–55.1 aralığında cəmlənir, sonra 54.7–53.5 aralığında xeyli sıxlaşır. Ən güclü klaster 53.9–54.3 ətrafında oturur; burada ən böyük ləğvetmə çubuğu təxminən 1.6 milyon ABŞ dollarına çatır. 55.9 itirilərsə, böyük dərəcədə aşağı klaster diqqətə gəlməzdən əvvəl 55.1–54.7 istiqamətində “süpürmə” ehtimalı artar.
📈 Bazarın üstündə, short-ləğvetmə likvidliyi 57.4 ətrafında formalaşmağa başlayır və 57.8–58.6 aralığında kəskin şəkildə artır. 57.8 klasteri 1.2 milyon ABŞ dollarından yuxarı ləğvetmə çubuğu ilə seçilir, 58.6 isə nəzərəçarpan likvidlik daşıyır. Daha uzaqda isə 59.0–59.8 aralığı nisbətən sıx likvidliyi qoruyur.
🧭 Ümumi quraşdırma yuxarıya doğru cüzi üstünlük verir, çünki yuxarı tərəfdə short-ləğvetmə ekspozisiyası daha böyükdür. 57.4 qırılarsa, 57.8–58.6 istiqamətində süpürmə ehtimalı artar; 55.9 itirilərsə isə diqqət 55.1–54.7 tərəfə keçər.
#LiquidationMap
$DRAM – Ləğvetmə xəritəsi (7 gün) – Cari qiymət 56.5
🔎 7 günlük ləğvetmə xəritəsi cari qiymətin üstündə təxminən 16 milyon ABŞ dolları məbləğində qısa (short) ləğvetmələri göstərir; bu, cari qiymətin altında təxminən 14–15 milyon ABŞ dolları məbləğində uzun (long) ləğvetmələri bir az üstələyir. Ümumi struktur kifayət qədər balanslıdır, amma bir qədər yuxarı tərəfə meyllidir.
📉 Bazarın altında, yaxın long-ləğvetmə likvidliyi 55.9–55.1 aralığında cəmlənir, sonra 54.7–53.5 aralığında xeyli sıxlaşır. Ən güclü klaster 53.9–54.3 ətrafında oturur; burada ən böyük ləğvetmə çubuğu təxminən 1.6 milyon ABŞ dollarına çatır. 55.9 itirilərsə, böyük dərəcədə aşağı klaster diqqətə gəlməzdən əvvəl 55.1–54.7 istiqamətində “süpürmə” ehtimalı artar.
📈 Bazarın üstündə, short-ləğvetmə likvidliyi 57.4 ətrafında formalaşmağa başlayır və 57.8–58.6 aralığında kəskin şəkildə artır. 57.8 klasteri 1.2 milyon ABŞ dollarından yuxarı ləğvetmə çubuğu ilə seçilir, 58.6 isə nəzərəçarpan likvidlik daşıyır. Daha uzaqda isə 59.0–59.8 aralığı nisbətən sıx likvidliyi qoruyur.
🧭 Ümumi quraşdırma yuxarıya doğru cüzi üstünlük verir, çünki yuxarı tərəfdə short-ləğvetmə ekspozisiyası daha böyükdür. 57.4 qırılarsa, 57.8–58.6 istiqamətində süpürmə ehtimalı artar; 55.9 itirilərsə isə diqqət 55.1–54.7 tərəfə keçər.
#LiquidationMap
🔎 7 günlük ləğvetmə xəritəsi cari qiymətin üstündə təxminən 16 milyon ABŞ dolları məbləğində qısa (short) ləğvetmələri göstərir; bu, cari qiymətin altında təxminən 14–15 milyon ABŞ dolları məbləğində uzun (long) ləğvetmələri bir az üstələyir. Ümumi struktur kifayət qədər balanslıdır, amma bir qədər yuxarı tərəfə meyllidir.
📉 Bazarın altında, yaxın long-ləğvetmə likvidliyi 55.9–55.1 aralığında cəmlənir, sonra 54.7–53.5 aralığında xeyli sıxlaşır. Ən güclü klaster 53.9–54.3 ətrafında oturur; burada ən böyük ləğvetmə çubuğu təxminən 1.6 milyon ABŞ dollarına çatır. 55.9 itirilərsə, böyük dərəcədə aşağı klaster diqqətə gəlməzdən əvvəl 55.1–54.7 istiqamətində “süpürmə” ehtimalı artar.
📈 Bazarın üstündə, short-ləğvetmə likvidliyi 57.4 ətrafında formalaşmağa başlayır və 57.8–58.6 aralığında kəskin şəkildə artır. 57.8 klasteri 1.2 milyon ABŞ dollarından yuxarı ləğvetmə çubuğu ilə seçilir, 58.6 isə nəzərəçarpan likvidlik daşıyır. Daha uzaqda isə 59.0–59.8 aralığı nisbətən sıx likvidliyi qoruyur.
🧭 Ümumi quraşdırma yuxarıya doğru cüzi üstünlük verir, çünki yuxarı tərəfdə short-ləğvetmə ekspozisiyası daha böyükdür. 57.4 qırılarsa, 57.8–58.6 istiqamətində süpürmə ehtimalı artar; 55.9 itirilərsə isə diqqət 55.1–54.7 tərəfə keçər.
#LiquidationMap
65
·
--
Artım
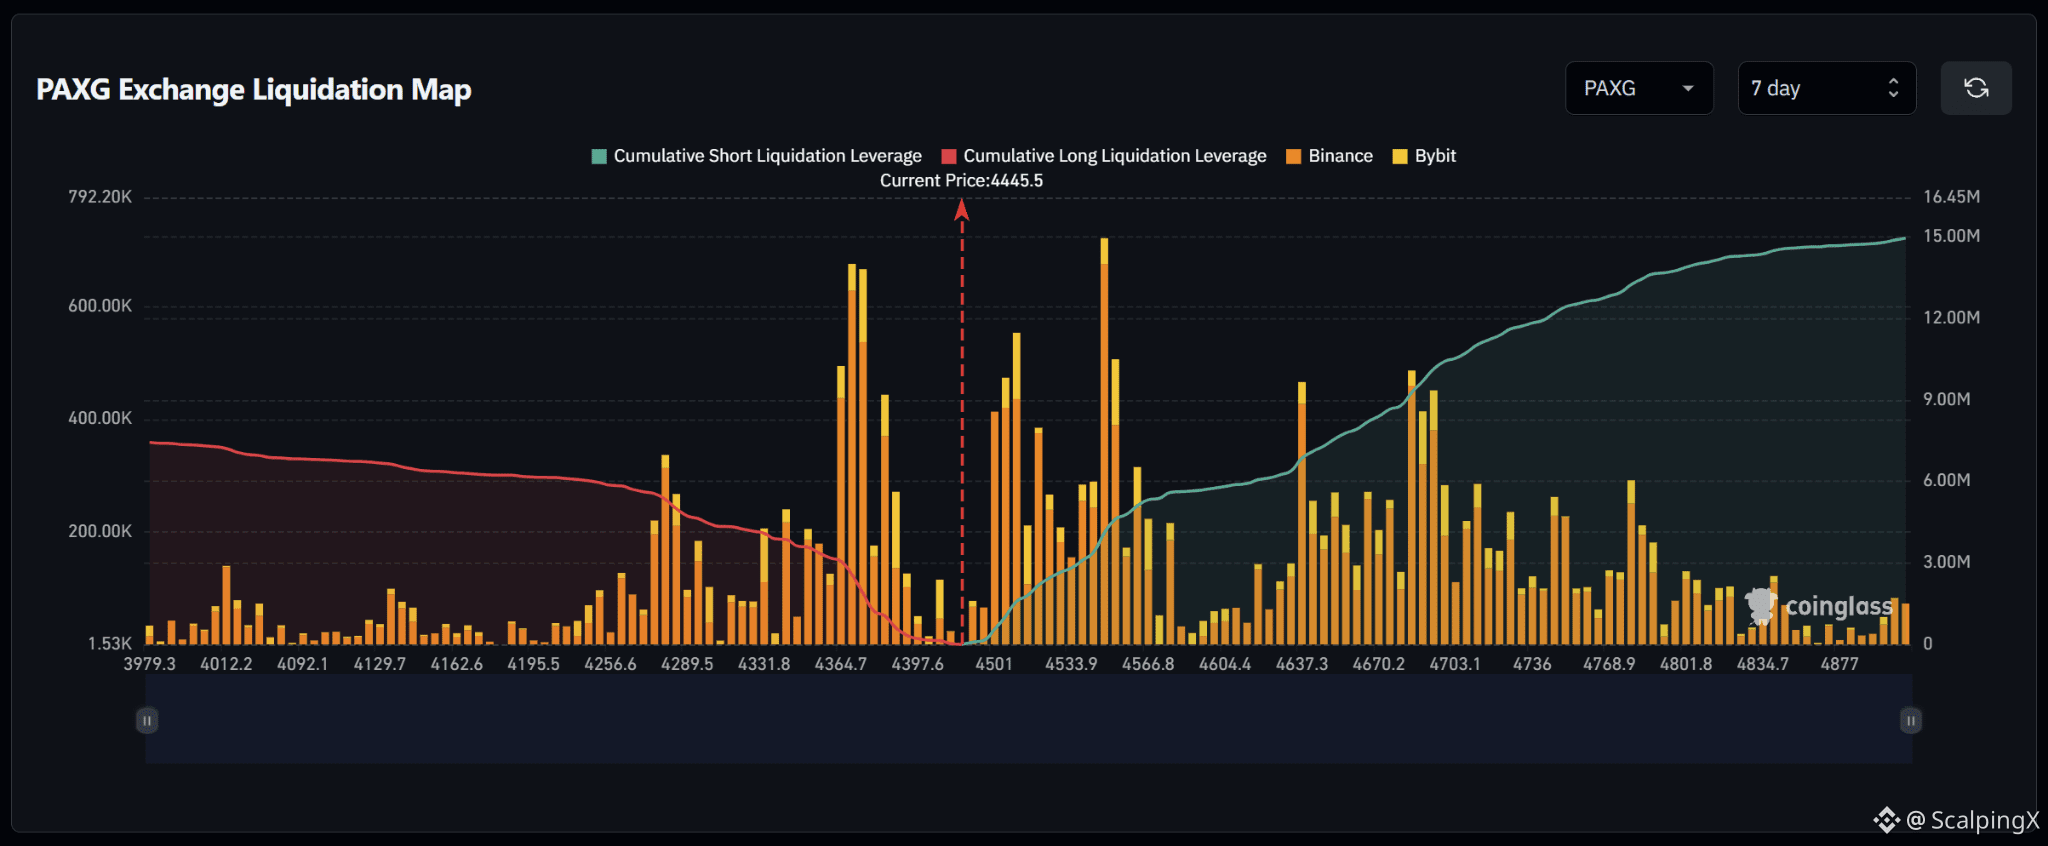
$PAXG – Ləğvetmə Xəritəsi (7 Gün) – Cari Qiymət 4,445.5
🔎 7 günlük ləğvetmə xəritəsi cari qiymətin üstündə təxminən 15 milyon dollar həcmində qısa (short) ləğvetmələr göstərir; bu isə təxminən 6,5–7 milyon dollar uzun (long) ləğvetmələrdən xeyli üstündür. Likvidlik strukturu beləliklə açıq şəkildə yüksəlişi dəstəkləyir: bazarın üstündə yığılmış məcmu likvidlik təxminən 2,2 dəfə çoxdur.
📉 Bazarın aşağısında uzun-ləğvetmə likvidliyi əsasən 4,397.6–4,364.7 aralığında cəmlənib. Ən güclü klaster 4,364.7 yaxınlığında yerləşir; burada ləğvetmə barları təxminən 650,000–700,000 dolları ötür. Həmçinin 4,331.8–4,289.5 aralığında də diqqətəlayiq likvidlik var. 4,397.6-nı itirmək 4,364.7–4,331.8 istiqamətində “sweep” ehtimalını artırar.
📈 Bazarın yuxarısında qısa-ləğvetmə likvidliyi 4,501-dən etibarən formalaşmağa başlayır və 4,533.9–4,566.8 aralığında sürətlə artır. Ən güclü klaster 4,550 civarındadır; burada ləğvetmə barı 700,000 dolları ötür. Daha uzaqda isə 4,637.3–4,703.1 də əhəmiyyətli likvidlik daşıyır. 4,501-dən yuxarı qırılma növbəti olaraq 4,533.9–4,566.8-i diqqət mərkəzinə gətirər.
🧭 Ümumi quraşdırma yüksəlişə üstünlük verir, çünki yuxarıdakı qısa-ləğvetmə ekspozisiyası təxminən 2,2 dəfə böyükdür. 4,501-dən yuxarı qırılma 4,533.9–4,566.8 istiqamətində sweep ehtimalını artırar, 4,397.6-nı itirmək isə diqqəti 4,364.7–4,331.8 tərəfə keçirər.
#LiquidationMap
$PAXG – Ləğvetmə Xəritəsi (7 Gün) – Cari Qiymət 4,445.5
🔎 7 günlük ləğvetmə xəritəsi cari qiymətin üstündə təxminən 15 milyon dollar həcmində qısa (short) ləğvetmələr göstərir; bu isə təxminən 6,5–7 milyon dollar uzun (long) ləğvetmələrdən xeyli üstündür. Likvidlik strukturu beləliklə açıq şəkildə yüksəlişi dəstəkləyir: bazarın üstündə yığılmış məcmu likvidlik təxminən 2,2 dəfə çoxdur.
📉 Bazarın aşağısında uzun-ləğvetmə likvidliyi əsasən 4,397.6–4,364.7 aralığında cəmlənib. Ən güclü klaster 4,364.7 yaxınlığında yerləşir; burada ləğvetmə barları təxminən 650,000–700,000 dolları ötür. Həmçinin 4,331.8–4,289.5 aralığında də diqqətəlayiq likvidlik var. 4,397.6-nı itirmək 4,364.7–4,331.8 istiqamətində “sweep” ehtimalını artırar.
📈 Bazarın yuxarısında qısa-ləğvetmə likvidliyi 4,501-dən etibarən formalaşmağa başlayır və 4,533.9–4,566.8 aralığında sürətlə artır. Ən güclü klaster 4,550 civarındadır; burada ləğvetmə barı 700,000 dolları ötür. Daha uzaqda isə 4,637.3–4,703.1 də əhəmiyyətli likvidlik daşıyır. 4,501-dən yuxarı qırılma növbəti olaraq 4,533.9–4,566.8-i diqqət mərkəzinə gətirər.
🧭 Ümumi quraşdırma yüksəlişə üstünlük verir, çünki yuxarıdakı qısa-ləğvetmə ekspozisiyası təxminən 2,2 dəfə böyükdür. 4,501-dən yuxarı qırılma 4,533.9–4,566.8 istiqamətində sweep ehtimalını artırar, 4,397.6-nı itirmək isə diqqəti 4,364.7–4,331.8 tərəfə keçirər.
#LiquidationMap
🔎 7 günlük ləğvetmə xəritəsi cari qiymətin üstündə təxminən 15 milyon dollar həcmində qısa (short) ləğvetmələr göstərir; bu isə təxminən 6,5–7 milyon dollar uzun (long) ləğvetmələrdən xeyli üstündür. Likvidlik strukturu beləliklə açıq şəkildə yüksəlişi dəstəkləyir: bazarın üstündə yığılmış məcmu likvidlik təxminən 2,2 dəfə çoxdur.
📉 Bazarın aşağısında uzun-ləğvetmə likvidliyi əsasən 4,397.6–4,364.7 aralığında cəmlənib. Ən güclü klaster 4,364.7 yaxınlığında yerləşir; burada ləğvetmə barları təxminən 650,000–700,000 dolları ötür. Həmçinin 4,331.8–4,289.5 aralığında də diqqətəlayiq likvidlik var. 4,397.6-nı itirmək 4,364.7–4,331.8 istiqamətində “sweep” ehtimalını artırar.
📈 Bazarın yuxarısında qısa-ləğvetmə likvidliyi 4,501-dən etibarən formalaşmağa başlayır və 4,533.9–4,566.8 aralığında sürətlə artır. Ən güclü klaster 4,550 civarındadır; burada ləğvetmə barı 700,000 dolları ötür. Daha uzaqda isə 4,637.3–4,703.1 də əhəmiyyətli likvidlik daşıyır. 4,501-dən yuxarı qırılma növbəti olaraq 4,533.9–4,566.8-i diqqət mərkəzinə gətirər.
🧭 Ümumi quraşdırma yüksəlişə üstünlük verir, çünki yuxarıdakı qısa-ləğvetmə ekspozisiyası təxminən 2,2 dəfə böyükdür. 4,501-dən yuxarı qırılma 4,533.9–4,566.8 istiqamətində sweep ehtimalını artırar, 4,397.6-nı itirmək isə diqqəti 4,364.7–4,331.8 tərəfə keçirər.
#LiquidationMap
21
·
--
Artım
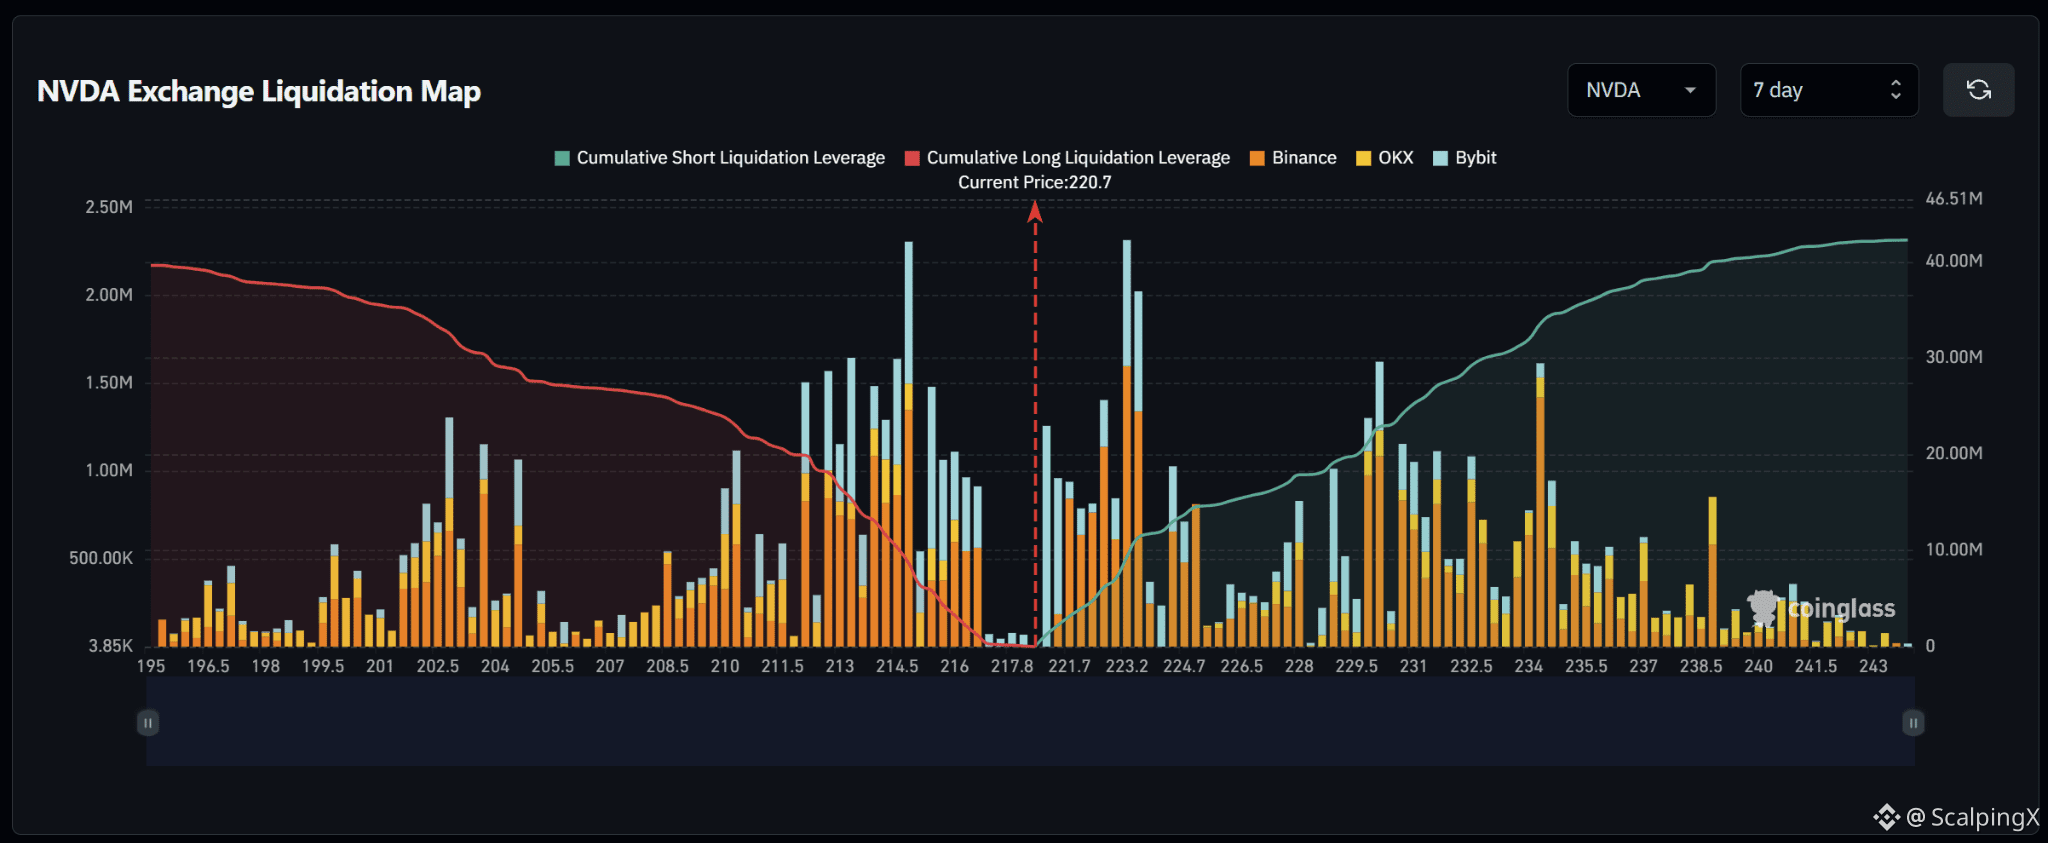
$NVDA – Likvidasiya xəritəsi (7 gün) – Cari qiymət 220.7
🔎 7 günlük likvidasiya xəritəsi cari qiymətin üstündə təxminən 42 milyon qısa likvidasiyanı göstərir; bu isə aşağı tərəfdə təxminən 40 milyon dollarlıq uzun likvidasiyadan bir qədər çoxdur. Ümumi struktur nisbətən balanslıdır, amma yuxarı tərəfə cüzi meyllidir.
📉 Bazarın aşağısında, yaxın long-likvidasiya likvidliyi
217.8–214.5 aralığında cəmlənib. Ən güclü klaster 214.5 yaxınlığında yerləşir; burada likvidasiya zolağı 2.2 milyon dollardan artıqdır. 213.0–216.0 aralığında da əhəmiyyətli likvidlik var. 217.8-in itirilməsi 216.0–214.5 istiqamətində süpürmə ehtimalını artırar.
📈 Bazarın yuxarısında, short-likvidasiya likvidliyi 221.7 ətrafında formalaşmağa başlayır və 223.2–224.7 boyunca kəskin şəkildə artır. 223.2 yaxınlığındakı klaster likvidasiya zolağı 2.2 milyon dollardan yuxarı olduğu üçün seçilir. Daha uzaqda, 229.5–234.0 aralığında da bir neçə böyük klaster var. 221.7-dən yuxarı qırılma ilk növbədə 223.2–224.7-ni diqqətə gətirər.
🧭 Daha geniş ssenari nisbətən balanslı olaraq qalır, amma yuxarı tərəfi cüzi üstünlük verir. 221.7-nin qırılması 223.2–224.7 istiqamətində short-likvidasiya süpürməsi ehtimalını artırar, 217.8-in itirilməsi isə diqqəti 216.0–214.5-ə yönəldər.
#LiquidationMap
$NVDA – Likvidasiya xəritəsi (7 gün) – Cari qiymət 220.7
🔎 7 günlük likvidasiya xəritəsi cari qiymətin üstündə təxminən 42 milyon qısa likvidasiyanı göstərir; bu isə aşağı tərəfdə təxminən 40 milyon dollarlıq uzun likvidasiyadan bir qədər çoxdur. Ümumi struktur nisbətən balanslıdır, amma yuxarı tərəfə cüzi meyllidir.
📉 Bazarın aşağısında, yaxın long-likvidasiya likvidliyi
217.8–214.5 aralığında cəmlənib. Ən güclü klaster 214.5 yaxınlığında yerləşir; burada likvidasiya zolağı 2.2 milyon dollardan artıqdır. 213.0–216.0 aralığında da əhəmiyyətli likvidlik var. 217.8-in itirilməsi 216.0–214.5 istiqamətində süpürmə ehtimalını artırar.
📈 Bazarın yuxarısında, short-likvidasiya likvidliyi 221.7 ətrafında formalaşmağa başlayır və 223.2–224.7 boyunca kəskin şəkildə artır. 223.2 yaxınlığındakı klaster likvidasiya zolağı 2.2 milyon dollardan yuxarı olduğu üçün seçilir. Daha uzaqda, 229.5–234.0 aralığında da bir neçə böyük klaster var. 221.7-dən yuxarı qırılma ilk növbədə 223.2–224.7-ni diqqətə gətirər.
🧭 Daha geniş ssenari nisbətən balanslı olaraq qalır, amma yuxarı tərəfi cüzi üstünlük verir. 221.7-nin qırılması 223.2–224.7 istiqamətində short-likvidasiya süpürməsi ehtimalını artırar, 217.8-in itirilməsi isə diqqəti 216.0–214.5-ə yönəldər.
#LiquidationMap
🔎 7 günlük likvidasiya xəritəsi cari qiymətin üstündə təxminən 42 milyon qısa likvidasiyanı göstərir; bu isə aşağı tərəfdə təxminən 40 milyon dollarlıq uzun likvidasiyadan bir qədər çoxdur. Ümumi struktur nisbətən balanslıdır, amma yuxarı tərəfə cüzi meyllidir.
📉 Bazarın aşağısında, yaxın long-likvidasiya likvidliyi
217.8–214.5 aralığında cəmlənib. Ən güclü klaster 214.5 yaxınlığında yerləşir; burada likvidasiya zolağı 2.2 milyon dollardan artıqdır. 213.0–216.0 aralığında da əhəmiyyətli likvidlik var. 217.8-in itirilməsi 216.0–214.5 istiqamətində süpürmə ehtimalını artırar.
📈 Bazarın yuxarısında, short-likvidasiya likvidliyi 221.7 ətrafında formalaşmağa başlayır və 223.2–224.7 boyunca kəskin şəkildə artır. 223.2 yaxınlığındakı klaster likvidasiya zolağı 2.2 milyon dollardan yuxarı olduğu üçün seçilir. Daha uzaqda, 229.5–234.0 aralığında da bir neçə böyük klaster var. 221.7-dən yuxarı qırılma ilk növbədə 223.2–224.7-ni diqqətə gətirər.
🧭 Daha geniş ssenari nisbətən balanslı olaraq qalır, amma yuxarı tərəfi cüzi üstünlük verir. 221.7-nin qırılması 223.2–224.7 istiqamətində short-likvidasiya süpürməsi ehtimalını artırar, 217.8-in itirilməsi isə diqqəti 216.0–214.5-ə yönəldər.
#LiquidationMap
19
·
--
Artım
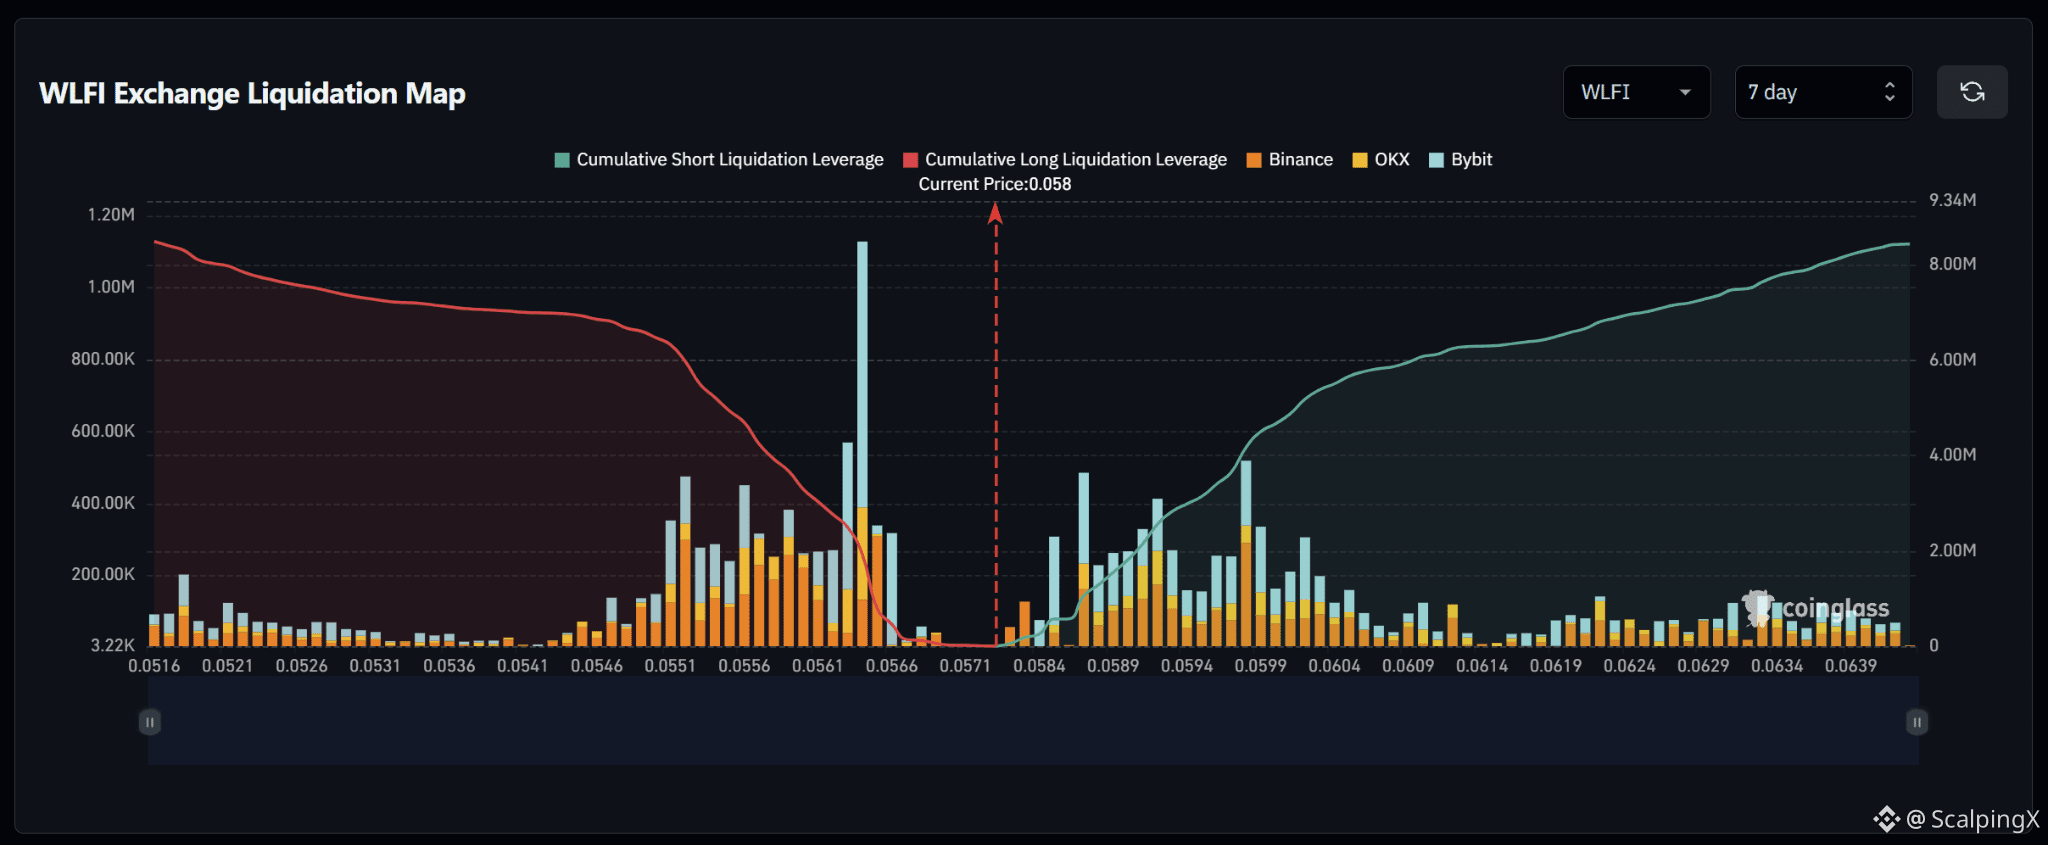
$WLFI – Likvidasiya Xəritəsi (7 Gün) – Hazırkı Qiymət 0.0580
🔎 7 günlük likvidasiya xəritəsi kifayət qədər balanslı likvidlik strukturu göstərir: həm uzun likvidasiyalar, həm də qısa likvidasiyalar müvafiq olaraq 8–9 milyon dollar civarında paylanır. Yekun hazırlıq buna görə neytrala yaxındır və güclü istiqamət pozuntusu yoxdur.
📉 Bazarın aşağısında uzun-likvidasiyaya aid likvidlik əsasən 0.0566–0.0551 aralığında cəmlənib. Ən güclü klaster 0.0563 yaxınlığındadır; burada likvidasiya çubuğu 1 milyon dollardan da çox olur, 0.0556–0.0551 aralığında isə əhəmiyyətli likvidlik mövcuddur. 0.0566 itirilsə, 0.0561–0.0556 istiqamətində “süpürmə” ehtimalı artar.
📈 Bazarın yuxarısında qısa-likvidasiyaya aid likvidlik 0.0584 yaxınlığından formalaşmağa başlayır və 0.0589–0.0604 aralığında daha sıxlaşır. Ən güclü yaxın klasterlər 0.0589 və 0.0599 ətrafındadır; likvidasiya çubuqları təxminən 400,000–500,000 dollar səviyyəsinə çatır. 0.0584-dən yuxarı qırılma əvvəlcə 0.0589–0.0599 diapazonunu diqqət mərkəzinə gətirər.
🧭 Ümumi hazırlıq nisbətən balanslı qalır. 0.0584-ü qırmaq 0.0589–0.0599 istiqamətində qısa-likvidasiyalı “süpürmə” ehtimalını artırar, 0.0566-nı itirmək isə diqqəti 0.0561–0.0556 tərəfə yönəldər.
#LiquidationMap
$WLFI – Likvidasiya Xəritəsi (7 Gün) – Hazırkı Qiymət 0.0580
🔎 7 günlük likvidasiya xəritəsi kifayət qədər balanslı likvidlik strukturu göstərir: həm uzun likvidasiyalar, həm də qısa likvidasiyalar müvafiq olaraq 8–9 milyon dollar civarında paylanır. Yekun hazırlıq buna görə neytrala yaxındır və güclü istiqamət pozuntusu yoxdur.
📉 Bazarın aşağısında uzun-likvidasiyaya aid likvidlik əsasən 0.0566–0.0551 aralığında cəmlənib. Ən güclü klaster 0.0563 yaxınlığındadır; burada likvidasiya çubuğu 1 milyon dollardan da çox olur, 0.0556–0.0551 aralığında isə əhəmiyyətli likvidlik mövcuddur. 0.0566 itirilsə, 0.0561–0.0556 istiqamətində “süpürmə” ehtimalı artar.
📈 Bazarın yuxarısında qısa-likvidasiyaya aid likvidlik 0.0584 yaxınlığından formalaşmağa başlayır və 0.0589–0.0604 aralığında daha sıxlaşır. Ən güclü yaxın klasterlər 0.0589 və 0.0599 ətrafındadır; likvidasiya çubuqları təxminən 400,000–500,000 dollar səviyyəsinə çatır. 0.0584-dən yuxarı qırılma əvvəlcə 0.0589–0.0599 diapazonunu diqqət mərkəzinə gətirər.
🧭 Ümumi hazırlıq nisbətən balanslı qalır. 0.0584-ü qırmaq 0.0589–0.0599 istiqamətində qısa-likvidasiyalı “süpürmə” ehtimalını artırar, 0.0566-nı itirmək isə diqqəti 0.0561–0.0556 tərəfə yönəldər.
#LiquidationMap
🔎 7 günlük likvidasiya xəritəsi kifayət qədər balanslı likvidlik strukturu göstərir: həm uzun likvidasiyalar, həm də qısa likvidasiyalar müvafiq olaraq 8–9 milyon dollar civarında paylanır. Yekun hazırlıq buna görə neytrala yaxındır və güclü istiqamət pozuntusu yoxdur.
📉 Bazarın aşağısında uzun-likvidasiyaya aid likvidlik əsasən 0.0566–0.0551 aralığında cəmlənib. Ən güclü klaster 0.0563 yaxınlığındadır; burada likvidasiya çubuğu 1 milyon dollardan da çox olur, 0.0556–0.0551 aralığında isə əhəmiyyətli likvidlik mövcuddur. 0.0566 itirilsə, 0.0561–0.0556 istiqamətində “süpürmə” ehtimalı artar.
📈 Bazarın yuxarısında qısa-likvidasiyaya aid likvidlik 0.0584 yaxınlığından formalaşmağa başlayır və 0.0589–0.0604 aralığında daha sıxlaşır. Ən güclü yaxın klasterlər 0.0589 və 0.0599 ətrafındadır; likvidasiya çubuqları təxminən 400,000–500,000 dollar səviyyəsinə çatır. 0.0584-dən yuxarı qırılma əvvəlcə 0.0589–0.0599 diapazonunu diqqət mərkəzinə gətirər.
🧭 Ümumi hazırlıq nisbətən balanslı qalır. 0.0584-ü qırmaq 0.0589–0.0599 istiqamətində qısa-likvidasiyalı “süpürmə” ehtimalını artırar, 0.0566-nı itirmək isə diqqəti 0.0561–0.0556 tərəfə yönəldər.
#LiquidationMap
8
·
--
Artım
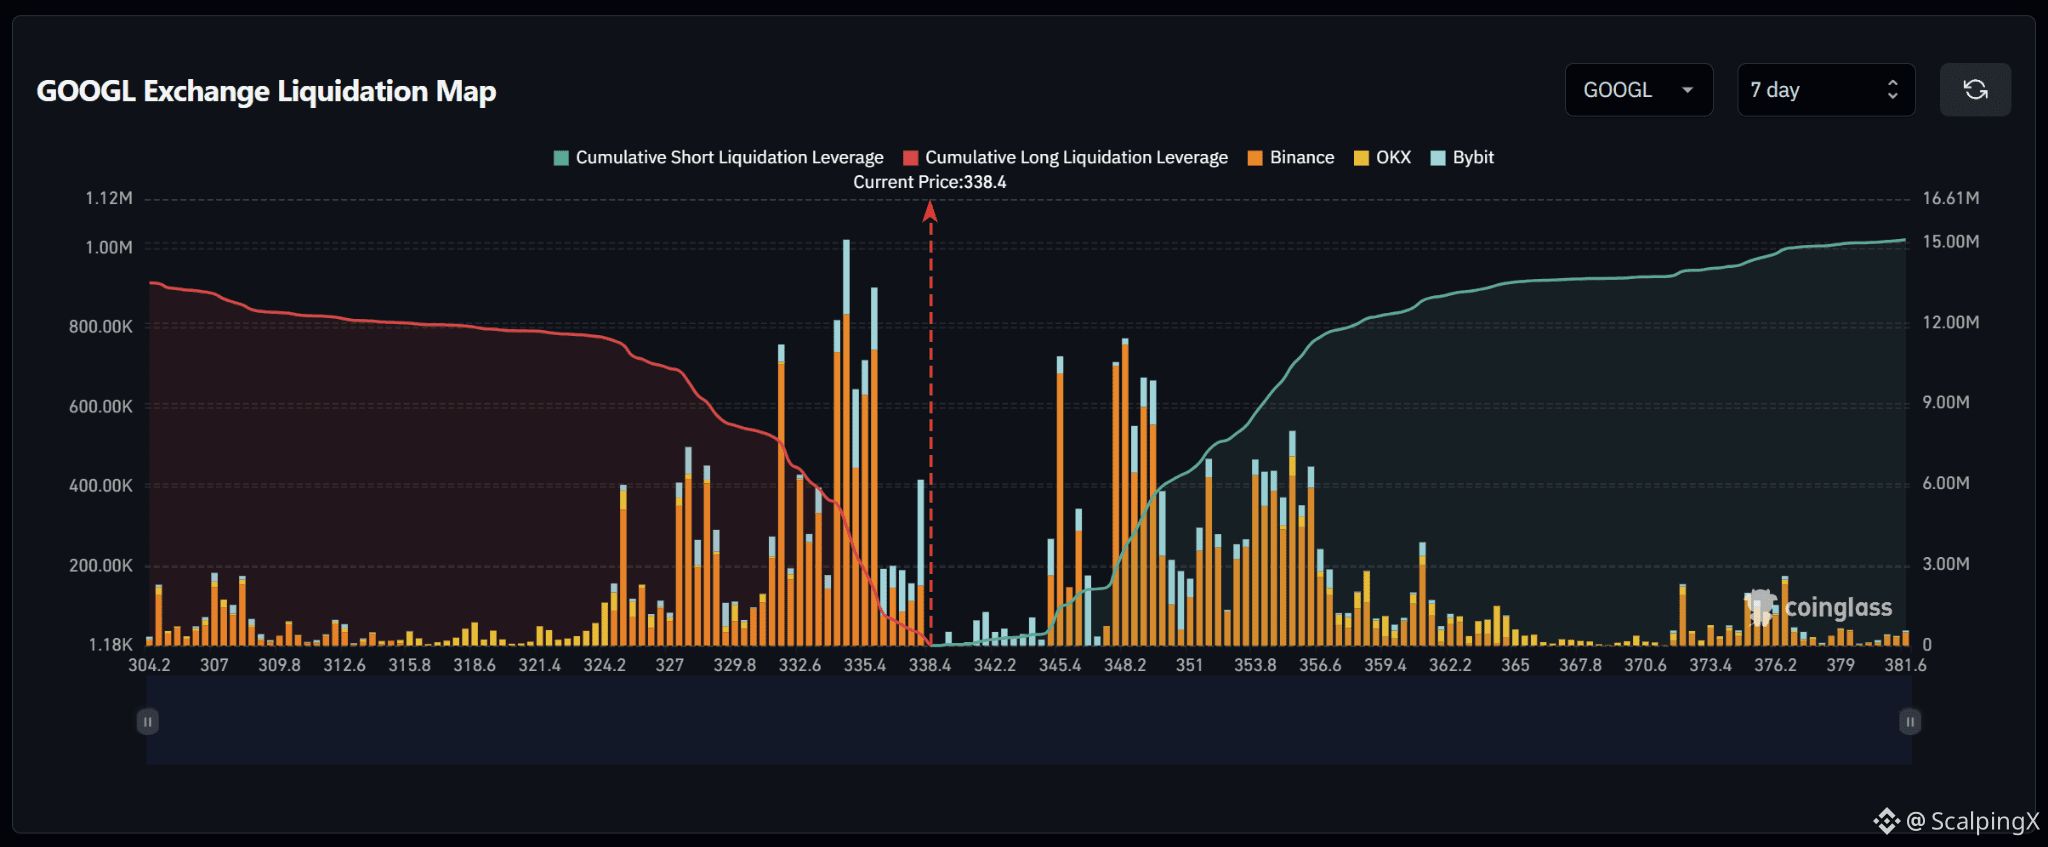
$GOOGL – Ləğvetmə Xəritəsi (7 Gün) – Hazırkı Qiymət 338.4
🔎 7 günlük ləğvetmə xəritəsi hazırkı qiymətin üstündə təxminən 15 milyon ABŞ dolları həcmində qısa (short) ləğvetmə, hazırkı qiymətin altında isə təxminən 13 milyon ABŞ dollarına yaxın uzun (long) ləğvetmə göstərir. Ümumi struktura nisbətən balanslıdır, lakin yuxarı tərəfə bir qədər meyllidir; bazarın üstündə yığılmış likvidlikdə təxminən 1.15 dəfə artım var.
📉 Bazarın altında uzun-ləğvetmə likvidliyi əsasən 335.4–332.6 aralığında cəmləşib. Ən güclü klasterlər 335.4 və 334.0 yaxınlığında görünür: burada ləğvetmə çubuqları təxminən 900,000–1 milyon ABŞ dollarına yaxınlaşır, 332.6 da diqqətəlayiq likvidlik daşıyır. 335.4 itirilsə, 334.0–332.6 istiqamətində süpürmə ehtimalı artar.
📈 Bazarın üstündə isə likvidlik 338.4 ilə 342.2 arasında nisbətən azdır; 345.4-dən qısa-ləğvetməyə məruz qalma isə kəskin şəkildə artır. Güclü klasterlər 345.4 və 348.2–351.0 ətrafında formalaşır; bir neçə çubuq təxminən 600,000–800,000 ABŞ dollarına çatır. 342.2-dən yuxarı qırılma 345.4–348.2 zonalarını növbəti plana çıxarar.
🧭 Ümumilikdə quruluş yuxarı tərəfi bir qədər dəstəkləyir, çünki yuxarıda qısa-ləğvetmə məruz qalması daha böyükdür. 342.2-dən qırılma 345.4–348.2 istiqamətində süpürmə ehtimalını artırar, 335.4 isə itirilsə diqqət 334.0–332.6-ya yönələr.
#LiquidationMap
$GOOGL – Ləğvetmə Xəritəsi (7 Gün) – Hazırkı Qiymət 338.4
🔎 7 günlük ləğvetmə xəritəsi hazırkı qiymətin üstündə təxminən 15 milyon ABŞ dolları həcmində qısa (short) ləğvetmə, hazırkı qiymətin altında isə təxminən 13 milyon ABŞ dollarına yaxın uzun (long) ləğvetmə göstərir. Ümumi struktura nisbətən balanslıdır, lakin yuxarı tərəfə bir qədər meyllidir; bazarın üstündə yığılmış likvidlikdə təxminən 1.15 dəfə artım var.
📉 Bazarın altında uzun-ləğvetmə likvidliyi əsasən 335.4–332.6 aralığında cəmləşib. Ən güclü klasterlər 335.4 və 334.0 yaxınlığında görünür: burada ləğvetmə çubuqları təxminən 900,000–1 milyon ABŞ dollarına yaxınlaşır, 332.6 da diqqətəlayiq likvidlik daşıyır. 335.4 itirilsə, 334.0–332.6 istiqamətində süpürmə ehtimalı artar.
📈 Bazarın üstündə isə likvidlik 338.4 ilə 342.2 arasında nisbətən azdır; 345.4-dən qısa-ləğvetməyə məruz qalma isə kəskin şəkildə artır. Güclü klasterlər 345.4 və 348.2–351.0 ətrafında formalaşır; bir neçə çubuq təxminən 600,000–800,000 ABŞ dollarına çatır. 342.2-dən yuxarı qırılma 345.4–348.2 zonalarını növbəti plana çıxarar.
🧭 Ümumilikdə quruluş yuxarı tərəfi bir qədər dəstəkləyir, çünki yuxarıda qısa-ləğvetmə məruz qalması daha böyükdür. 342.2-dən qırılma 345.4–348.2 istiqamətində süpürmə ehtimalını artırar, 335.4 isə itirilsə diqqət 334.0–332.6-ya yönələr.
#LiquidationMap
🔎 7 günlük ləğvetmə xəritəsi hazırkı qiymətin üstündə təxminən 15 milyon ABŞ dolları həcmində qısa (short) ləğvetmə, hazırkı qiymətin altında isə təxminən 13 milyon ABŞ dollarına yaxın uzun (long) ləğvetmə göstərir. Ümumi struktura nisbətən balanslıdır, lakin yuxarı tərəfə bir qədər meyllidir; bazarın üstündə yığılmış likvidlikdə təxminən 1.15 dəfə artım var.
📉 Bazarın altında uzun-ləğvetmə likvidliyi əsasən 335.4–332.6 aralığında cəmləşib. Ən güclü klasterlər 335.4 və 334.0 yaxınlığında görünür: burada ləğvetmə çubuqları təxminən 900,000–1 milyon ABŞ dollarına yaxınlaşır, 332.6 da diqqətəlayiq likvidlik daşıyır. 335.4 itirilsə, 334.0–332.6 istiqamətində süpürmə ehtimalı artar.
📈 Bazarın üstündə isə likvidlik 338.4 ilə 342.2 arasında nisbətən azdır; 345.4-dən qısa-ləğvetməyə məruz qalma isə kəskin şəkildə artır. Güclü klasterlər 345.4 və 348.2–351.0 ətrafında formalaşır; bir neçə çubuq təxminən 600,000–800,000 ABŞ dollarına çatır. 342.2-dən yuxarı qırılma 345.4–348.2 zonalarını növbəti plana çıxarar.
🧭 Ümumilikdə quruluş yuxarı tərəfi bir qədər dəstəkləyir, çünki yuxarıda qısa-ləğvetmə məruz qalması daha böyükdür. 342.2-dən qırılma 345.4–348.2 istiqamətində süpürmə ehtimalını artırar, 335.4 isə itirilsə diqqət 334.0–332.6-ya yönələr.
#LiquidationMap
23
·
--
Artım
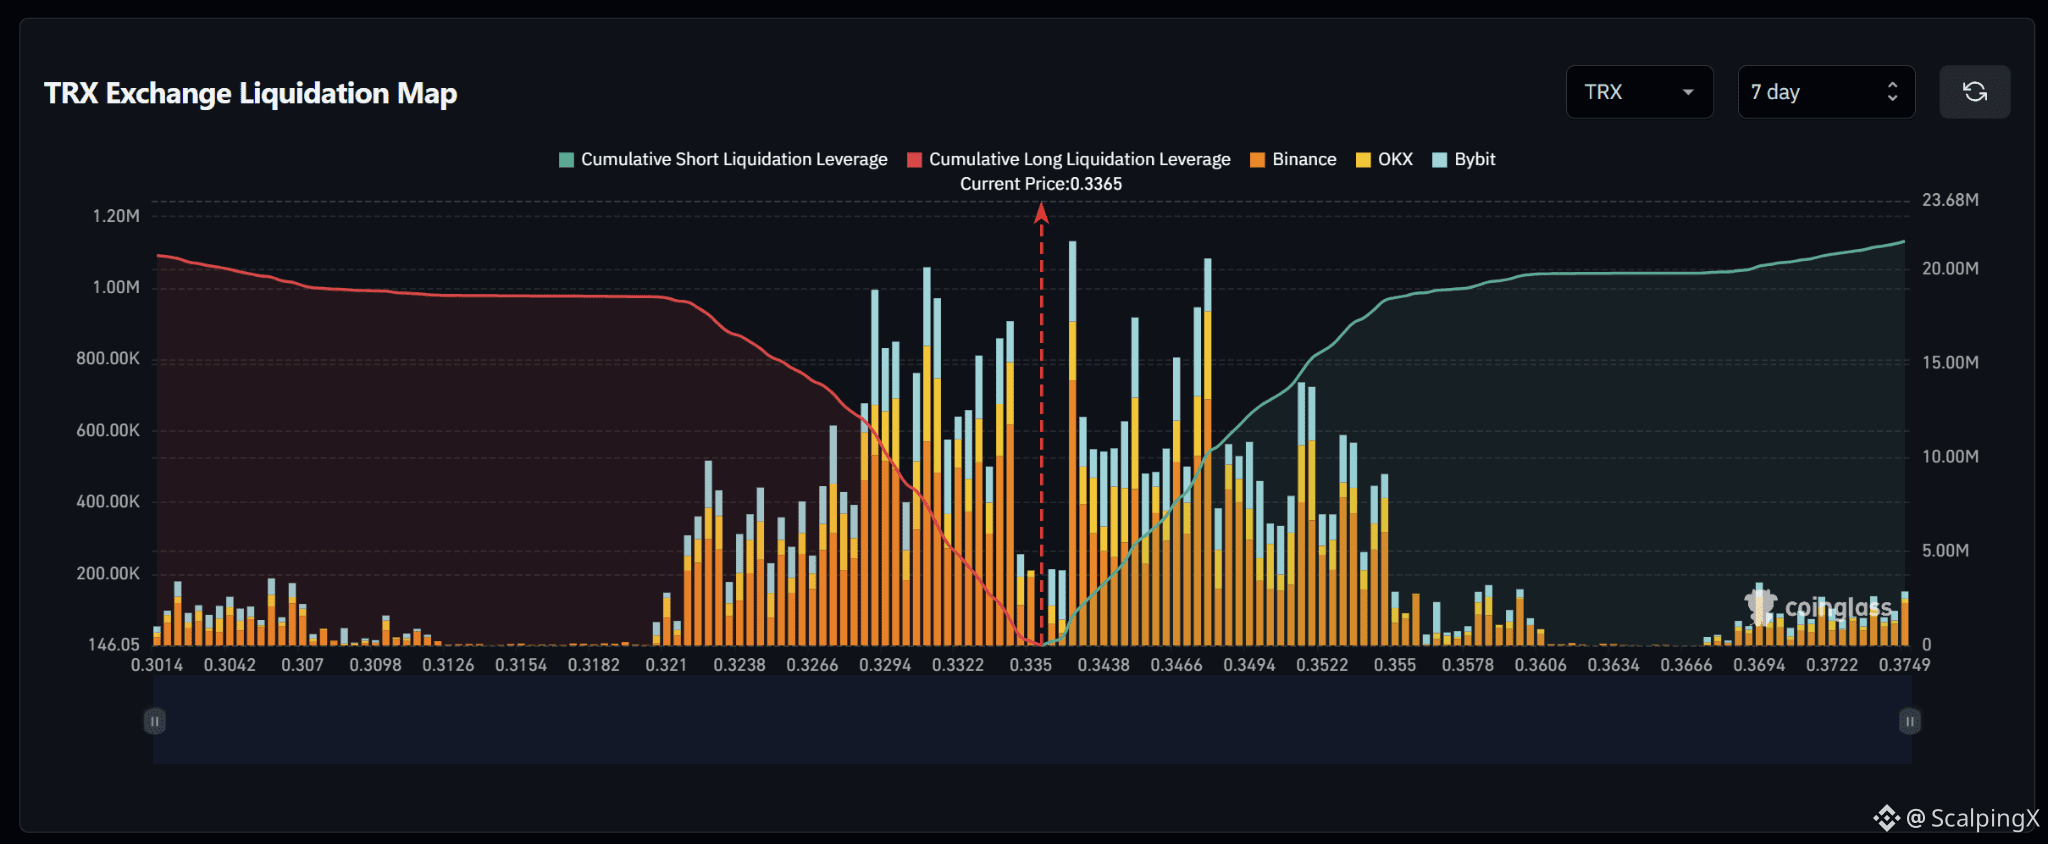
$TRX – Likvidasiya Xəritəsi (7 Gün) – Cari Qiymət 0.3365
🔎 7 günlük likvidasiya xəritəsi nisbətən balanslaşdırılmış likvidlik strukturunu göstərir: cari qiymətin üstündə təxminən $21–22 milyon qısa (short) likvidasiya, cari qiymətin altında isə təxminən $21 milyon uzun (long) likvidasiya var. Ümumi vəziyyət buna görə neytrala yaxındır, amma bir qədər yüksəlişə meyillidir.
📉 Bazarın altında, yaxın long-likvidasiya likvidliyi 0.3332–0.3294 aralığında daha sıx toplanıb. Bu zonada bir neçə likvidasiya şaxəsi təxminən $800,000–1 milyon təşkil edir, 0.3266–0.3238 aralığında da nəzərə çarpan likvidlik mövcuddur. 0.3350 səviyyəsini itirmək 0.3332–0.3294 istiqamətində “sweep” ehtimalını artırar.
📈 Bazarın üstündə, short-likvidasiya likvidliyi 0.3438–0.3494 aralığında kəskin şəkildə formalaşmağa başlayır. Ən güclü klasterlər 0.3438 və 0.3466–0.3494 yaxınlığında yerləşir; bir neçə şaxə $1 milyondan çoxdur. Daha uzaqda, 0.3522–0.3550 aralığında da nəzərə çarpan likvidlik var.
🧭 Ümumi setup nisbətən balanslıdır, amma bir qədər yüksəlişə üstünlük verir. 0.3438-i qırmaq 0.3466–0.3494 istiqamətində “sweep” ehtimalını artırar, 0.3350-i itirmək isə diqqəti 0.3332–0.3294 tərəfə yönəldər.
#LiquidationMap
$TRX – Likvidasiya Xəritəsi (7 Gün) – Cari Qiymət 0.3365
🔎 7 günlük likvidasiya xəritəsi nisbətən balanslaşdırılmış likvidlik strukturunu göstərir: cari qiymətin üstündə təxminən $21–22 milyon qısa (short) likvidasiya, cari qiymətin altında isə təxminən $21 milyon uzun (long) likvidasiya var. Ümumi vəziyyət buna görə neytrala yaxındır, amma bir qədər yüksəlişə meyillidir.
📉 Bazarın altında, yaxın long-likvidasiya likvidliyi 0.3332–0.3294 aralığında daha sıx toplanıb. Bu zonada bir neçə likvidasiya şaxəsi təxminən $800,000–1 milyon təşkil edir, 0.3266–0.3238 aralığında da nəzərə çarpan likvidlik mövcuddur. 0.3350 səviyyəsini itirmək 0.3332–0.3294 istiqamətində “sweep” ehtimalını artırar.
📈 Bazarın üstündə, short-likvidasiya likvidliyi 0.3438–0.3494 aralığında kəskin şəkildə formalaşmağa başlayır. Ən güclü klasterlər 0.3438 və 0.3466–0.3494 yaxınlığında yerləşir; bir neçə şaxə $1 milyondan çoxdur. Daha uzaqda, 0.3522–0.3550 aralığında da nəzərə çarpan likvidlik var.
🧭 Ümumi setup nisbətən balanslıdır, amma bir qədər yüksəlişə üstünlük verir. 0.3438-i qırmaq 0.3466–0.3494 istiqamətində “sweep” ehtimalını artırar, 0.3350-i itirmək isə diqqəti 0.3332–0.3294 tərəfə yönəldər.
#LiquidationMap
🔎 7 günlük likvidasiya xəritəsi nisbətən balanslaşdırılmış likvidlik strukturunu göstərir: cari qiymətin üstündə təxminən $21–22 milyon qısa (short) likvidasiya, cari qiymətin altında isə təxminən $21 milyon uzun (long) likvidasiya var. Ümumi vəziyyət buna görə neytrala yaxındır, amma bir qədər yüksəlişə meyillidir.
📉 Bazarın altında, yaxın long-likvidasiya likvidliyi 0.3332–0.3294 aralığında daha sıx toplanıb. Bu zonada bir neçə likvidasiya şaxəsi təxminən $800,000–1 milyon təşkil edir, 0.3266–0.3238 aralığında da nəzərə çarpan likvidlik mövcuddur. 0.3350 səviyyəsini itirmək 0.3332–0.3294 istiqamətində “sweep” ehtimalını artırar.
📈 Bazarın üstündə, short-likvidasiya likvidliyi 0.3438–0.3494 aralığında kəskin şəkildə formalaşmağa başlayır. Ən güclü klasterlər 0.3438 və 0.3466–0.3494 yaxınlığında yerləşir; bir neçə şaxə $1 milyondan çoxdur. Daha uzaqda, 0.3522–0.3550 aralığında da nəzərə çarpan likvidlik var.
🧭 Ümumi setup nisbətən balanslıdır, amma bir qədər yüksəlişə üstünlük verir. 0.3438-i qırmaq 0.3466–0.3494 istiqamətində “sweep” ehtimalını artırar, 0.3350-i itirmək isə diqqəti 0.3332–0.3294 tərəfə yönəldər.
#LiquidationMap
18
·
--
$AVAX – Ləğvetmə Xəritəsi (7 Gün) – Cari Qiymət 7.42
🔎 7 günlük ləğvetmə xəritəsi cari qiymətdən yuxarıda təxminən 15 milyon ABŞ dolları qısa mövqelərin (short) ləğvlərini göstərir; aşağıda isə təxminən 12 milyon ABŞ dolları uzun mövqelərin (long) ləğvlərinə çatır. Ümumilikdə strukturu nisbətən balanslıdır, lakin azacıq yüksəliş tərəfinə meyllidir; bazarın üstündə yığılmış likvidlik təxminən 1.2–1.3 dəfə çoxdur.
📉 Bazarın altında yaxın məsafədə long-ləğvetmə likvidliyi 7.30–7.22 aralığında nisbətən zəifdir, sonra 7.18–7.10 aralığında kəskin şəkildə artır. Ən güclü klaster 7.10–7.16 civarında yerləşir; burada bir neçə ləğvetmə çubuğu təxminən 600.000–700.000 ABŞ dolları civarına çatır. Əgər 7.30 itirilərsə, diqqət əvvəlcə 7.22–7.18-ə yönələr, daha böyük aşağı klaster isə sonra gəlir.
📈 Bazarın üstündə isə short-ləğvetmə likvidliyi təxminən 7.50-dən başlayaraq yığılmağa edir və 7.54–7.70 aralığında daha da sıxlaşır. Ən güclü klasterlər təxminən 7.58 və 7.66–7.70 yaxınlığındadır; burada bir neçə çubuq 500.000 ABŞ dollarını keçir. Daha uzaqda isə 7.74–7.86 aralığında da nəzərəçarpan likvidlik mövcuddur.
🧭 Daha geniş ssenari azacıq yüksəlişi dəstəkləyir, çünki yuxarıdakı short-ləğvetmə ekspozisiyası təxminən 1.2–1.3 dəfə böyükdür. 7.50-nin qırılması 7.54–7.58 istiqamətində süpürmə ehtimalını artırar, 7.30-un itirilməsi isə diqqəti 7.22–7.18-ə yönəldər.
#LiquidationMap
$AVAX – Ləğvetmə Xəritəsi (7 Gün) – Cari Qiymət 7.42
🔎 7 günlük ləğvetmə xəritəsi cari qiymətdən yuxarıda təxminən 15 milyon ABŞ dolları qısa mövqelərin (short) ləğvlərini göstərir; aşağıda isə təxminən 12 milyon ABŞ dolları uzun mövqelərin (long) ləğvlərinə çatır. Ümumilikdə strukturu nisbətən balanslıdır, lakin azacıq yüksəliş tərəfinə meyllidir; bazarın üstündə yığılmış likvidlik təxminən 1.2–1.3 dəfə çoxdur.
📉 Bazarın altında yaxın məsafədə long-ləğvetmə likvidliyi 7.30–7.22 aralığında nisbətən zəifdir, sonra 7.18–7.10 aralığında kəskin şəkildə artır. Ən güclü klaster 7.10–7.16 civarında yerləşir; burada bir neçə ləğvetmə çubuğu təxminən 600.000–700.000 ABŞ dolları civarına çatır. Əgər 7.30 itirilərsə, diqqət əvvəlcə 7.22–7.18-ə yönələr, daha böyük aşağı klaster isə sonra gəlir.
📈 Bazarın üstündə isə short-ləğvetmə likvidliyi təxminən 7.50-dən başlayaraq yığılmağa edir və 7.54–7.70 aralığında daha da sıxlaşır. Ən güclü klasterlər təxminən 7.58 və 7.66–7.70 yaxınlığındadır; burada bir neçə çubuq 500.000 ABŞ dollarını keçir. Daha uzaqda isə 7.74–7.86 aralığında da nəzərəçarpan likvidlik mövcuddur.
🧭 Daha geniş ssenari azacıq yüksəlişi dəstəkləyir, çünki yuxarıdakı short-ləğvetmə ekspozisiyası təxminən 1.2–1.3 dəfə böyükdür. 7.50-nin qırılması 7.54–7.58 istiqamətində süpürmə ehtimalını artırar, 7.30-un itirilməsi isə diqqəti 7.22–7.18-ə yönəldər.
#LiquidationMap
🔎 7 günlük ləğvetmə xəritəsi cari qiymətdən yuxarıda təxminən 15 milyon ABŞ dolları qısa mövqelərin (short) ləğvlərini göstərir; aşağıda isə təxminən 12 milyon ABŞ dolları uzun mövqelərin (long) ləğvlərinə çatır. Ümumilikdə strukturu nisbətən balanslıdır, lakin azacıq yüksəliş tərəfinə meyllidir; bazarın üstündə yığılmış likvidlik təxminən 1.2–1.3 dəfə çoxdur.
📉 Bazarın altında yaxın məsafədə long-ləğvetmə likvidliyi 7.30–7.22 aralığında nisbətən zəifdir, sonra 7.18–7.10 aralığında kəskin şəkildə artır. Ən güclü klaster 7.10–7.16 civarında yerləşir; burada bir neçə ləğvetmə çubuğu təxminən 600.000–700.000 ABŞ dolları civarına çatır. Əgər 7.30 itirilərsə, diqqət əvvəlcə 7.22–7.18-ə yönələr, daha böyük aşağı klaster isə sonra gəlir.
📈 Bazarın üstündə isə short-ləğvetmə likvidliyi təxminən 7.50-dən başlayaraq yığılmağa edir və 7.54–7.70 aralığında daha da sıxlaşır. Ən güclü klasterlər təxminən 7.58 və 7.66–7.70 yaxınlığındadır; burada bir neçə çubuq 500.000 ABŞ dollarını keçir. Daha uzaqda isə 7.74–7.86 aralığında da nəzərəçarpan likvidlik mövcuddur.
🧭 Daha geniş ssenari azacıq yüksəlişi dəstəkləyir, çünki yuxarıdakı short-ləğvetmə ekspozisiyası təxminən 1.2–1.3 dəfə böyükdür. 7.50-nin qırılması 7.54–7.58 istiqamətində süpürmə ehtimalını artırar, 7.30-un itirilməsi isə diqqəti 7.22–7.18-ə yönəldər.
#LiquidationMap
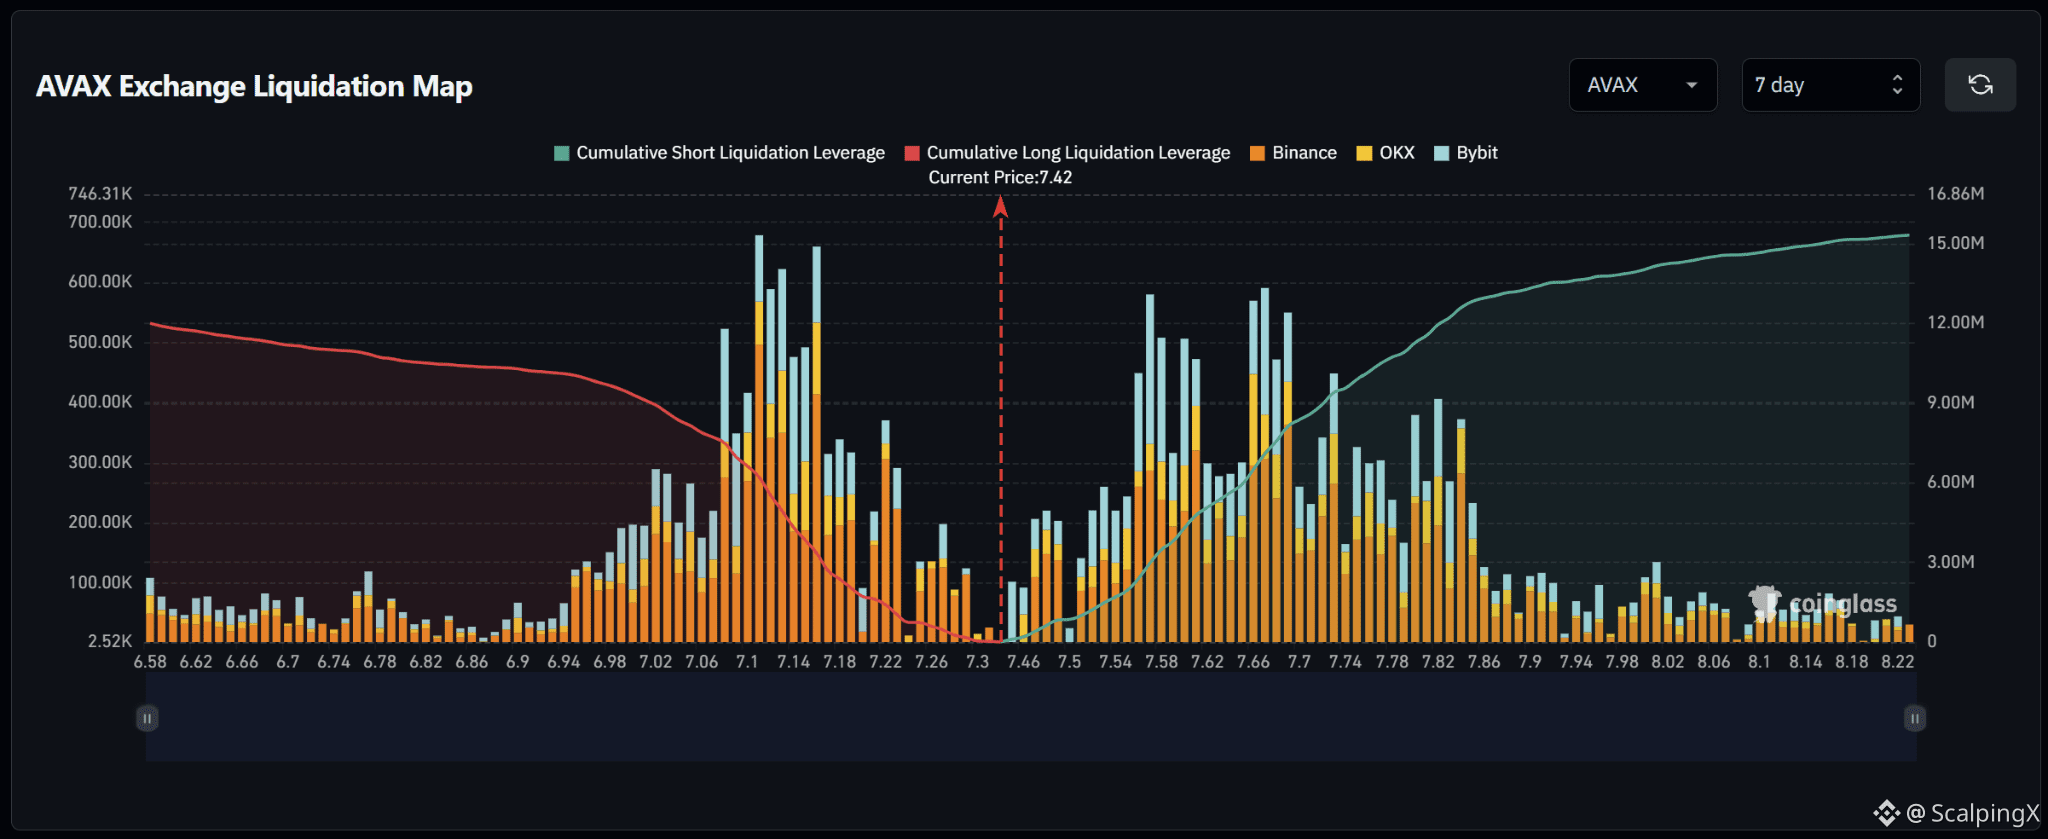
45
Daha çox kontent araşdırmaq üçün daxil olun
Binance Square-də qlobal kriptovalyuta istifadəçilərinə qoşulun
⚡️ Kriptovalyuta haqqında ən son və faydalı məlumatları əldə edin.
💬 Dünyanın ən böyük kriptovalyuta birjası tərəfindən etibar edilir.
👍 Doğrulanmış yaradıcılardan gələn real məlumatları kəşf edin.
E-poçt/Telefon nömrəsi
Trenddə olan mövzular
1
#FedRateWatch
649,588 baxış
Müzakirə edir: 3,029
2
#EthereumFallsBelow$2400
154 baxış
Müzakirə edir: 25
3
#USSenateBlocksClarityAct
1,003 baxış
Müzakirə edir: 63
4
#BitcoinSlidesTo$76000
27,033 baxış
Müzakirə edir: 130
5
#BitcoinReboundsTo$79K
63,869 baxış
Müzakirə edir: 408
6
#StrategyMarketCapPassesFord
46,785 baxış
Müzakirə edir: 735
7
#ClarityActOddsHalveOnPolymarket
76,120 baxış
Müzakirə edir: 627
8
#US30YTreasuryYieldTops5.40%
40,207 baxış
Müzakirə edir: 411
9
#BessentEndorsesFinalClarityActDraft
62,591 baxış
Müzakirə edir: 790
10
#ZamaOpens16ConfidentialMorphoVaults
22,020 baxış
Müzakirə edir: 386