

#chartanalysis
chartanalysis
1M baxış
Müzakirə edir: 3,210
Populyar
Sonuncu

Tərcüməyə bax
🚀 $NEAR SNEAKING THROUGH CHOP ZONE WITH LIQUIDITY SWEEP POTENTIAL 🦈
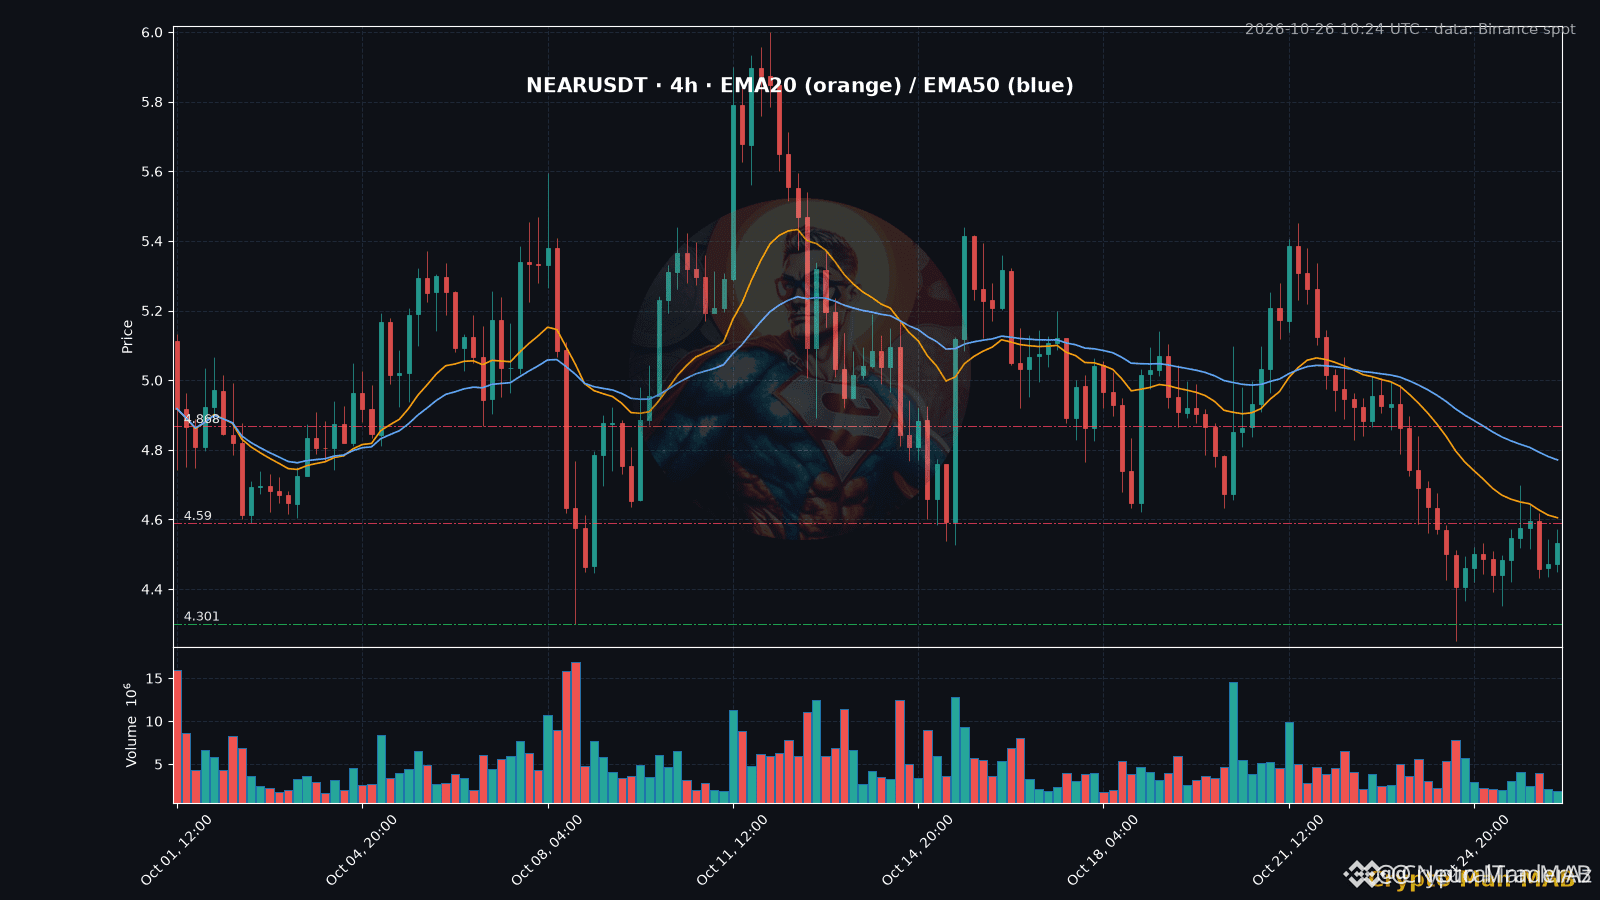
📊 After a 20% plunge from $5.45 to $4.25 in three days, $NEAR now oscillates between $4.43 – $4.70, still hugging the 4H EMAs. The 20‑EMA sits near $4.60, repeatedly capping each bounce and forcing the price to respect the $4.70 ceiling. 📌 A clean 4H close above that line would unlock the next order block around $4.87, while a break back through $4.43 could reignite a test of the $4.25 low.
💬 Are you holding $NEAR or waiting for the next liquidity sweep? 👇
⚠️ Not financial advice. Always manage your risk. 🛡️
🏷️ #NEAR #Altcoin #LiquiditySweep #ChartAnalysis
🦈 🚀
🚀 $NEAR SNEAKING THROUGH CHOP ZONE WITH LIQUIDITY SWEEP POTENTIAL 🦈
📊 After a 20% plunge from $5.45 to $4.25 in three days, $NEAR now oscillates between $4.43 – $4.70, still hugging the 4H EMAs. The 20‑EMA sits near $4.60, repeatedly capping each bounce and forcing the price to respect the $4.70 ceiling. 📌 A clean 4H close above that line would unlock the next order block around $4.87, while a break back through $4.43 could reignite a test of the $4.25 low.
💬 Are you holding $NEAR or waiting for the next liquidity sweep? 👇
⚠️ Not financial advice. Always manage your risk. 🛡️
🏷️ #NEAR #Altcoin #LiquiditySweep #ChartAnalysis
🦈 🚀
📊 After a 20% plunge from $5.45 to $4.25 in three days, $NEAR now oscillates between $4.43 – $4.70, still hugging the 4H EMAs. The 20‑EMA sits near $4.60, repeatedly capping each bounce and forcing the price to respect the $4.70 ceiling. 📌 A clean 4H close above that line would unlock the next order block around $4.87, while a break back through $4.43 could reignite a test of the $4.25 low.
💬 Are you holding $NEAR or waiting for the next liquidity sweep? 👇
⚠️ Not financial advice. Always manage your risk. 🛡️
🏷️ #NEAR #Altcoin #LiquiditySweep #ChartAnalysis
🦈 🚀
2

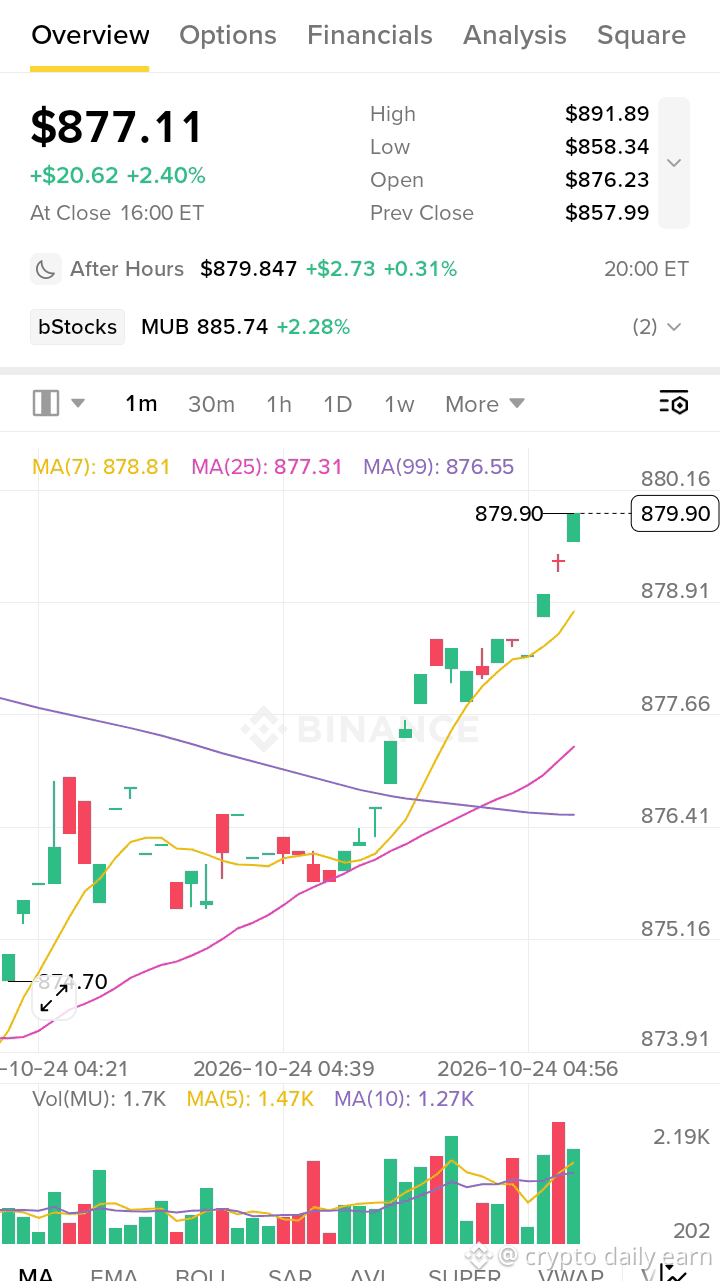
📊 $MU Qrafik yeniləməsi | 1 dəqiqəlik momentum yoxlaması
MA(7) | MA(25) | MA(99) — Qiymət bütün MA-ların üzərində hərəkət edir
Həcm artımı görünür
Bu, yalnız maarifləndirmə məqsədi daşıyır, maliyyə məsləhəti deyil.
Bu hərəkət barədə nə düşünürsünüz? 👇
#MU #Micron #Səhmlər #Ticarət #Binance #ChartAnalysis
📊 $MU Qrafik yeniləməsi | 1 dəqiqəlik momentum yoxlaması
MA(7) | MA(25) | MA(99) — Qiymət bütün MA-ların üzərində hərəkət edir
Həcm artımı görünür
Bu, yalnız maarifləndirmə məqsədi daşıyır, maliyyə məsləhəti deyil.
Bu hərəkət barədə nə düşünürsünüz? 👇
#MU #Micron #Səhmlər #Ticarət #Binance #ChartAnalysis
MA(7) | MA(25) | MA(99) — Qiymət bütün MA-ların üzərində hərəkət edir
Həcm artımı görünür
Bu, yalnız maarifləndirmə məqsədi daşıyır, maliyyə məsləhəti deyil.
Bu hərəkət barədə nə düşünürsünüz? 👇
#MU #Micron #Səhmlər #Ticarət #Binance #ChartAnalysis
1
1
194

Tərcüməyə bax
🚀 $BTC FLIPPED VIEW REVEALS HIDDEN BULLISH SURGE 🟢
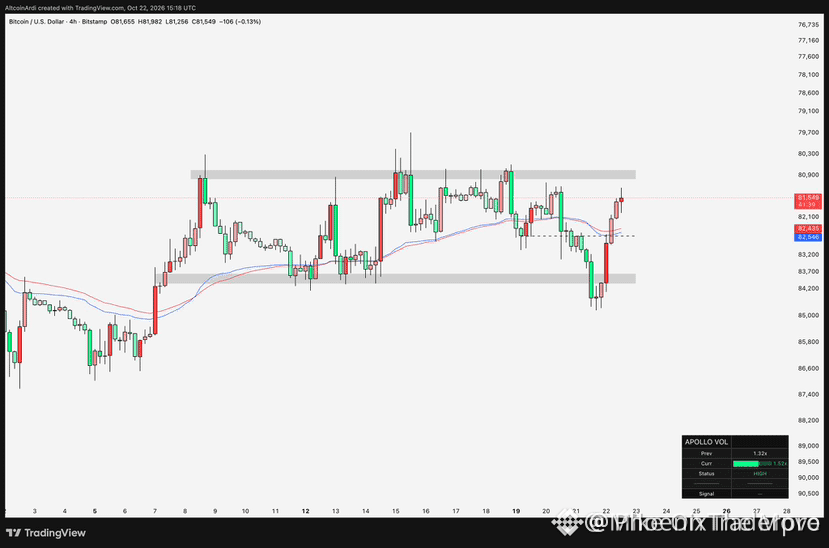
📊 Turning the chart upside‑down strips away the noise, exposing a clean ascending wedge that’s been silently feeding liquidity to the longs. ⚡ The volume profile spikes right where the inverted trendline meets the 4‑hour swing low, a classic smart‑money grab that often precedes a breakout. 💡 With the order flow now pointing upward, buyers are reclaiming control faster than the bears can regroup.
💬 How are you positioning for the next leg now that the perspective has shifted? 👇
⚠️ Not financial advice. Always manage your risk. 🛡️
🏷️ #BTC #ChartAnalysis #Bullish #Crypto
🔥 💎
🚀 $BTC FLIPPED VIEW REVEALS HIDDEN BULLISH SURGE 🟢
📊 Turning the chart upside‑down strips away the noise, exposing a clean ascending wedge that’s been silently feeding liquidity to the longs. ⚡ The volume profile spikes right where the inverted trendline meets the 4‑hour swing low, a classic smart‑money grab that often precedes a breakout. 💡 With the order flow now pointing upward, buyers are reclaiming control faster than the bears can regroup.
💬 How are you positioning for the next leg now that the perspective has shifted? 👇
⚠️ Not financial advice. Always manage your risk. 🛡️
🏷️ #BTC #ChartAnalysis #Bullish #Crypto
🔥 💎
📊 Turning the chart upside‑down strips away the noise, exposing a clean ascending wedge that’s been silently feeding liquidity to the longs. ⚡ The volume profile spikes right where the inverted trendline meets the 4‑hour swing low, a classic smart‑money grab that often precedes a breakout. 💡 With the order flow now pointing upward, buyers are reclaiming control faster than the bears can regroup.
💬 How are you positioning for the next leg now that the perspective has shifted? 👇
⚠️ Not financial advice. Always manage your risk. 🛡️
🏷️ #BTC #ChartAnalysis #Bullish #Crypto
🔥 💎
9
·
--
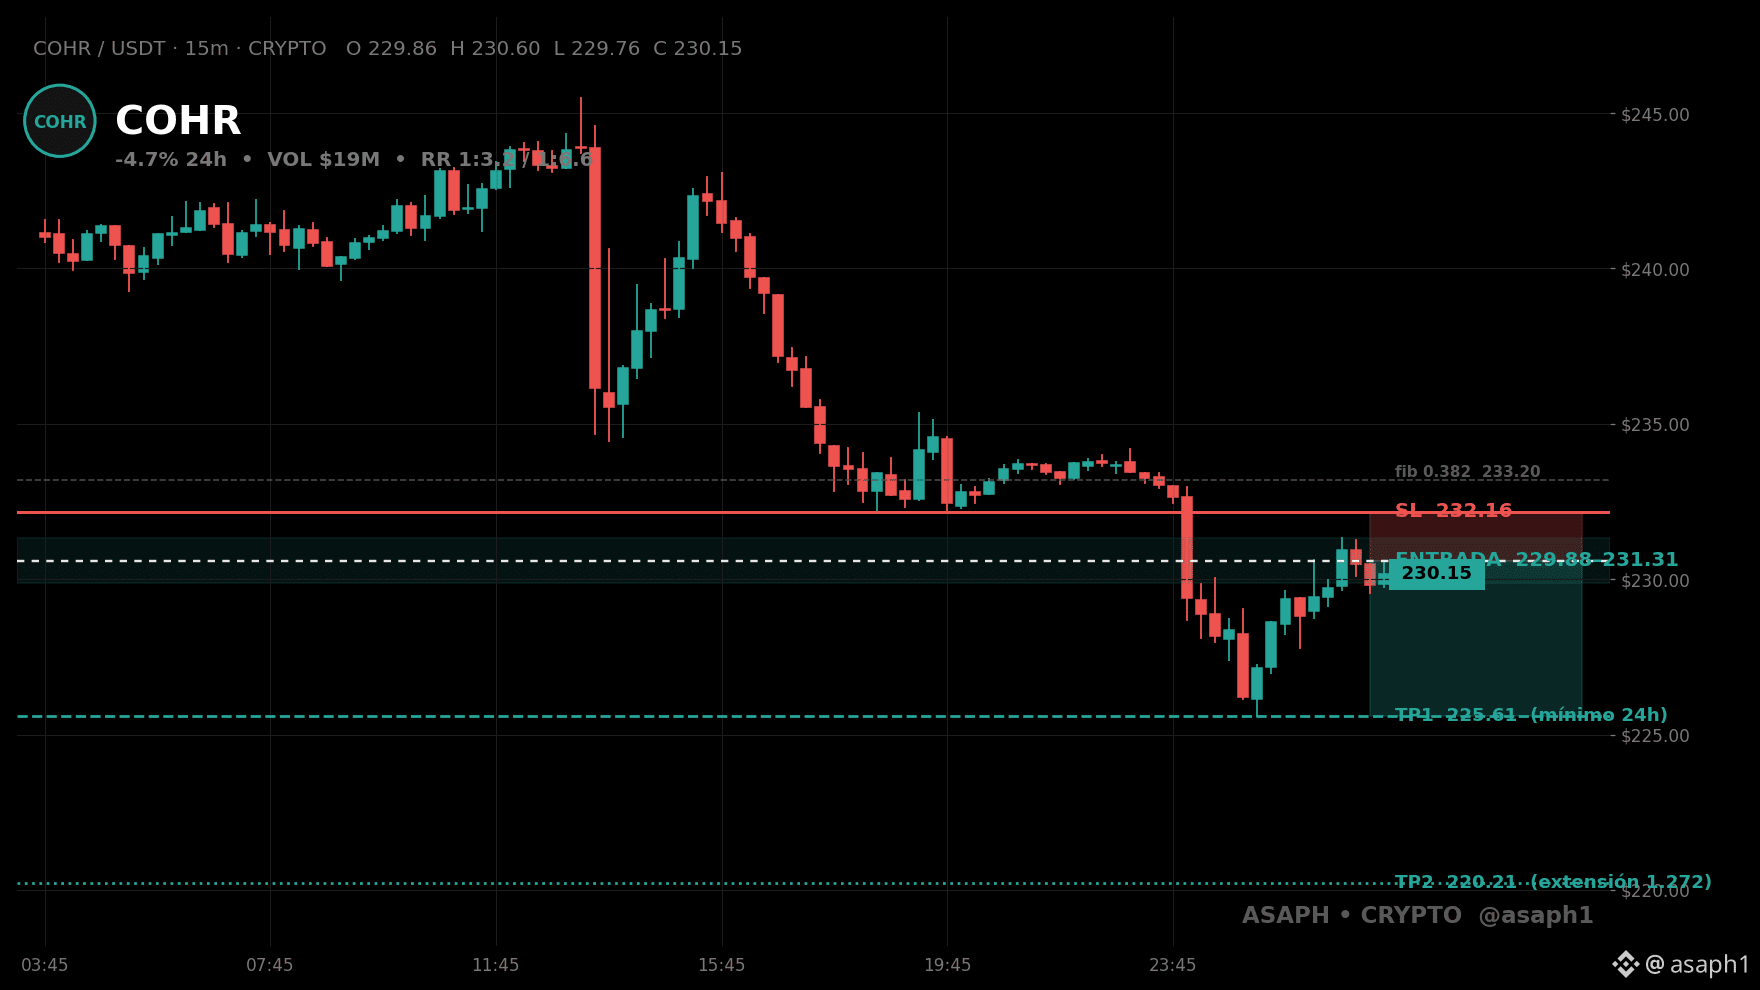
COHR əvvəllər rahatlıqla keçdiyi səviyyələri itirir 🧨
-4.7%, $19M həcm ilə. $229.9–$231.3 səviyyəsi 8 müdafiə cəhdindən sonra qırıldı və qiymət heç geriyə də baxmadı. Səviyyələr müqavimətsiz qırılırsa, struktur daxildən dağılır.
Aşağıdakı $225.6 qiymətin yeni tarazlıq axtara biləcəyi növbəti zonadır. İtirilən hər səviyyə adətən müqavimətə çevrilir.
$232.2-ni geri alıb bu səviyyənin üzərində qalmaq qəhrəmanlıq olardı. Hələlik isə istiqamət cənubu göstərir.
COHR növbəti hansı səviyyəni itirəcək? $COHR
#Scalping #ChartAnalysis #Momentum
COHR əvvəllər rahatlıqla keçdiyi səviyyələri itirir 🧨
-4.7%, $19M həcm ilə. $229.9–$231.3 səviyyəsi 8 müdafiə cəhdindən sonra qırıldı və qiymət heç geriyə də baxmadı. Səviyyələr müqavimətsiz qırılırsa, struktur daxildən dağılır.
Aşağıdakı $225.6 qiymətin yeni tarazlıq axtara biləcəyi növbəti zonadır. İtirilən hər səviyyə adətən müqavimətə çevrilir.
$232.2-ni geri alıb bu səviyyənin üzərində qalmaq qəhrəmanlıq olardı. Hələlik isə istiqamət cənubu göstərir.
COHR növbəti hansı səviyyəni itirəcək? $COHR
#Scalping #ChartAnalysis #Momentum
-4.7%, $19M həcm ilə. $229.9–$231.3 səviyyəsi 8 müdafiə cəhdindən sonra qırıldı və qiymət heç geriyə də baxmadı. Səviyyələr müqavimətsiz qırılırsa, struktur daxildən dağılır.
Aşağıdakı $225.6 qiymətin yeni tarazlıq axtara biləcəyi növbəti zonadır. İtirilən hər səviyyə adətən müqavimətə çevrilir.
$232.2-ni geri alıb bu səviyyənin üzərində qalmaq qəhrəmanlıq olardı. Hələlik isə istiqamət cənubu göstərir.
COHR növbəti hansı səviyyəni itirəcək? $COHR
#Scalping #ChartAnalysis #Momentum
125
·
--
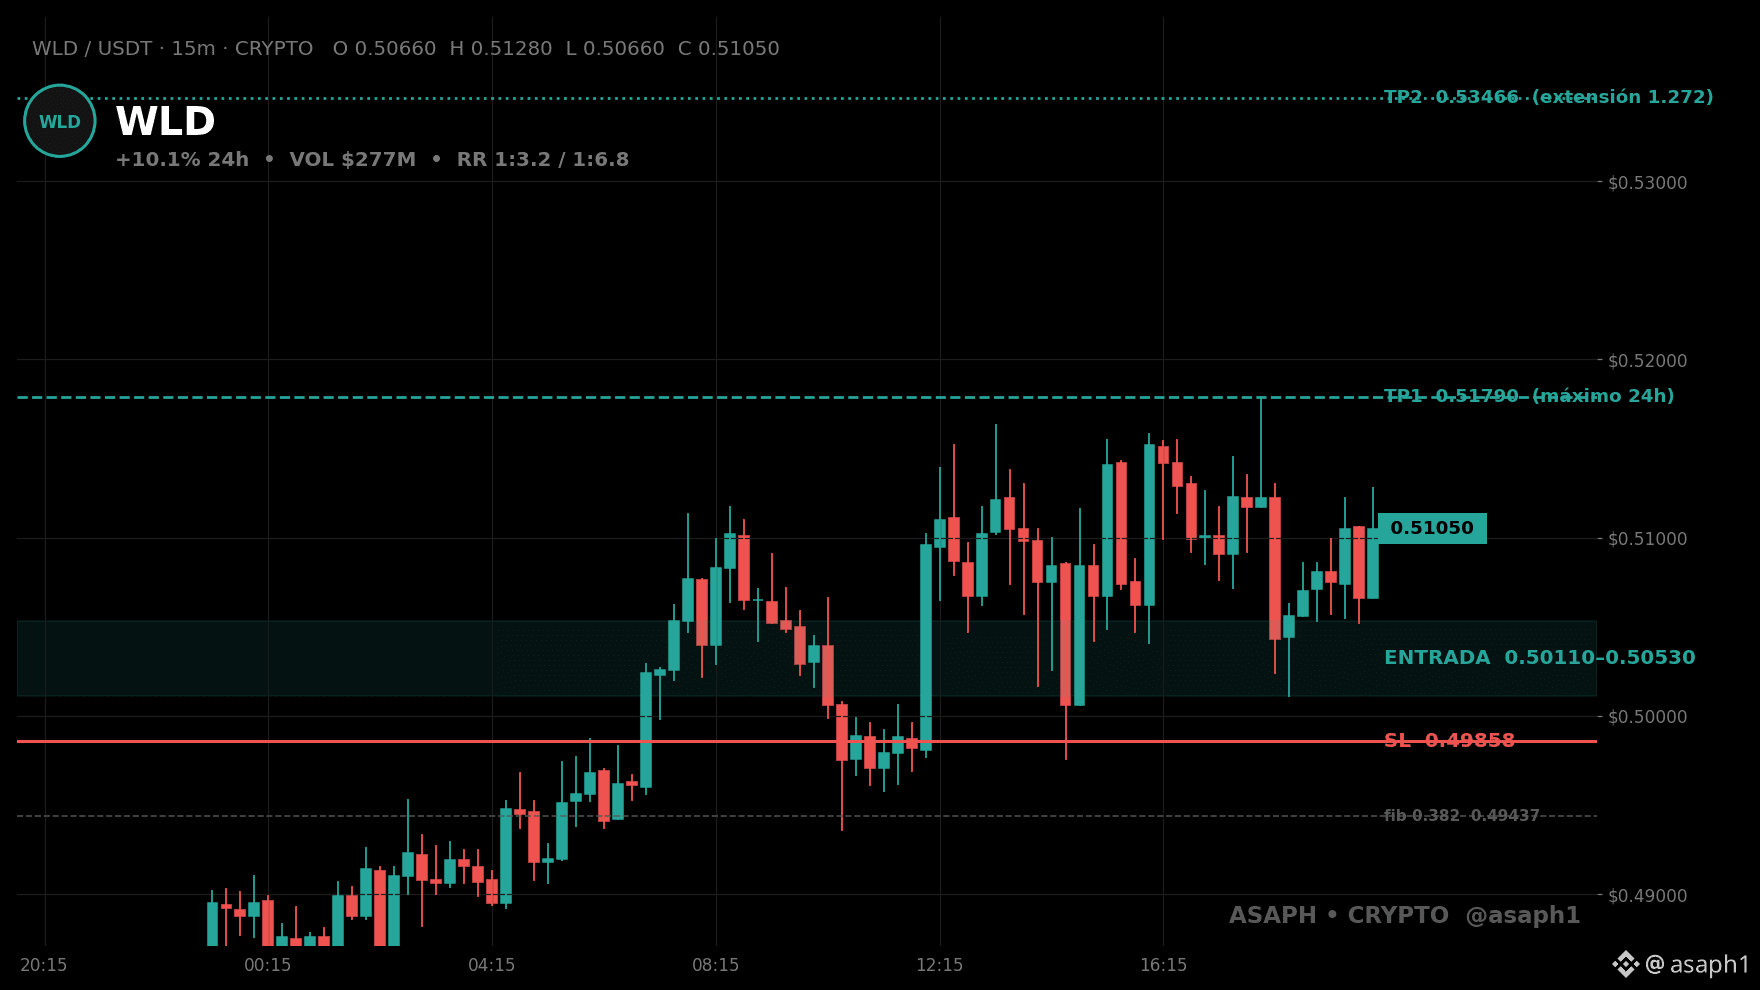
WLD bu gün eyni zonanı iki dəfə müdafiə etdi və bu, önəmlidir 💪
$277M həcmində ticarətlə +10.1%. İlk müdafiə $0.50–$0.51-də oldu, qiymət geri çəkildi, sonra ikinci müdafiə gəldi (26 şam fitili heç nəyi qırmadan uduldu). İkinci müdafiə adətən birincidən daha çox məna daşıyır: bunun təsadüf olmadığını təsdiqləyir.
$0.52 növbəti sınaq ola bilər — əgər alıcılar aşağıda müdafiə etsələr, yuxarıda tavanı shortlayanların stopları ola bilər. Qiymət adətən onları ovlamağa gedir.
Həcm artımı ilə $0.50-nin itirilməsi bütün bu ssenarini etibarsız edər. Zona davam gətirdiyi müddətdə struktur alıcıların xeyrinədir.
WLD-nin bu ikiqat müdafiəsi sizə nəsə deyir, yoxsa təsadüfdür? $WLD
#OrderFlow #ChartAnalysis #TradingSetup
WLD bu gün eyni zonanı iki dəfə müdafiə etdi və bu, önəmlidir 💪
$277M həcmində ticarətlə +10.1%. İlk müdafiə $0.50–$0.51-də oldu, qiymət geri çəkildi, sonra ikinci müdafiə gəldi (26 şam fitili heç nəyi qırmadan uduldu). İkinci müdafiə adətən birincidən daha çox məna daşıyır: bunun təsadüf olmadığını təsdiqləyir.
$0.52 növbəti sınaq ola bilər — əgər alıcılar aşağıda müdafiə etsələr, yuxarıda tavanı shortlayanların stopları ola bilər. Qiymət adətən onları ovlamağa gedir.
Həcm artımı ilə $0.50-nin itirilməsi bütün bu ssenarini etibarsız edər. Zona davam gətirdiyi müddətdə struktur alıcıların xeyrinədir.
WLD-nin bu ikiqat müdafiəsi sizə nəsə deyir, yoxsa təsadüfdür? $WLD
#OrderFlow #ChartAnalysis #TradingSetup
$277M həcmində ticarətlə +10.1%. İlk müdafiə $0.50–$0.51-də oldu, qiymət geri çəkildi, sonra ikinci müdafiə gəldi (26 şam fitili heç nəyi qırmadan uduldu). İkinci müdafiə adətən birincidən daha çox məna daşıyır: bunun təsadüf olmadığını təsdiqləyir.
$0.52 növbəti sınaq ola bilər — əgər alıcılar aşağıda müdafiə etsələr, yuxarıda tavanı shortlayanların stopları ola bilər. Qiymət adətən onları ovlamağa gedir.
Həcm artımı ilə $0.50-nin itirilməsi bütün bu ssenarini etibarsız edər. Zona davam gətirdiyi müddətdə struktur alıcıların xeyrinədir.
WLD-nin bu ikiqat müdafiəsi sizə nəsə deyir, yoxsa təsadüfdür? $WLD
#OrderFlow #ChartAnalysis #TradingSetup
161

·
--
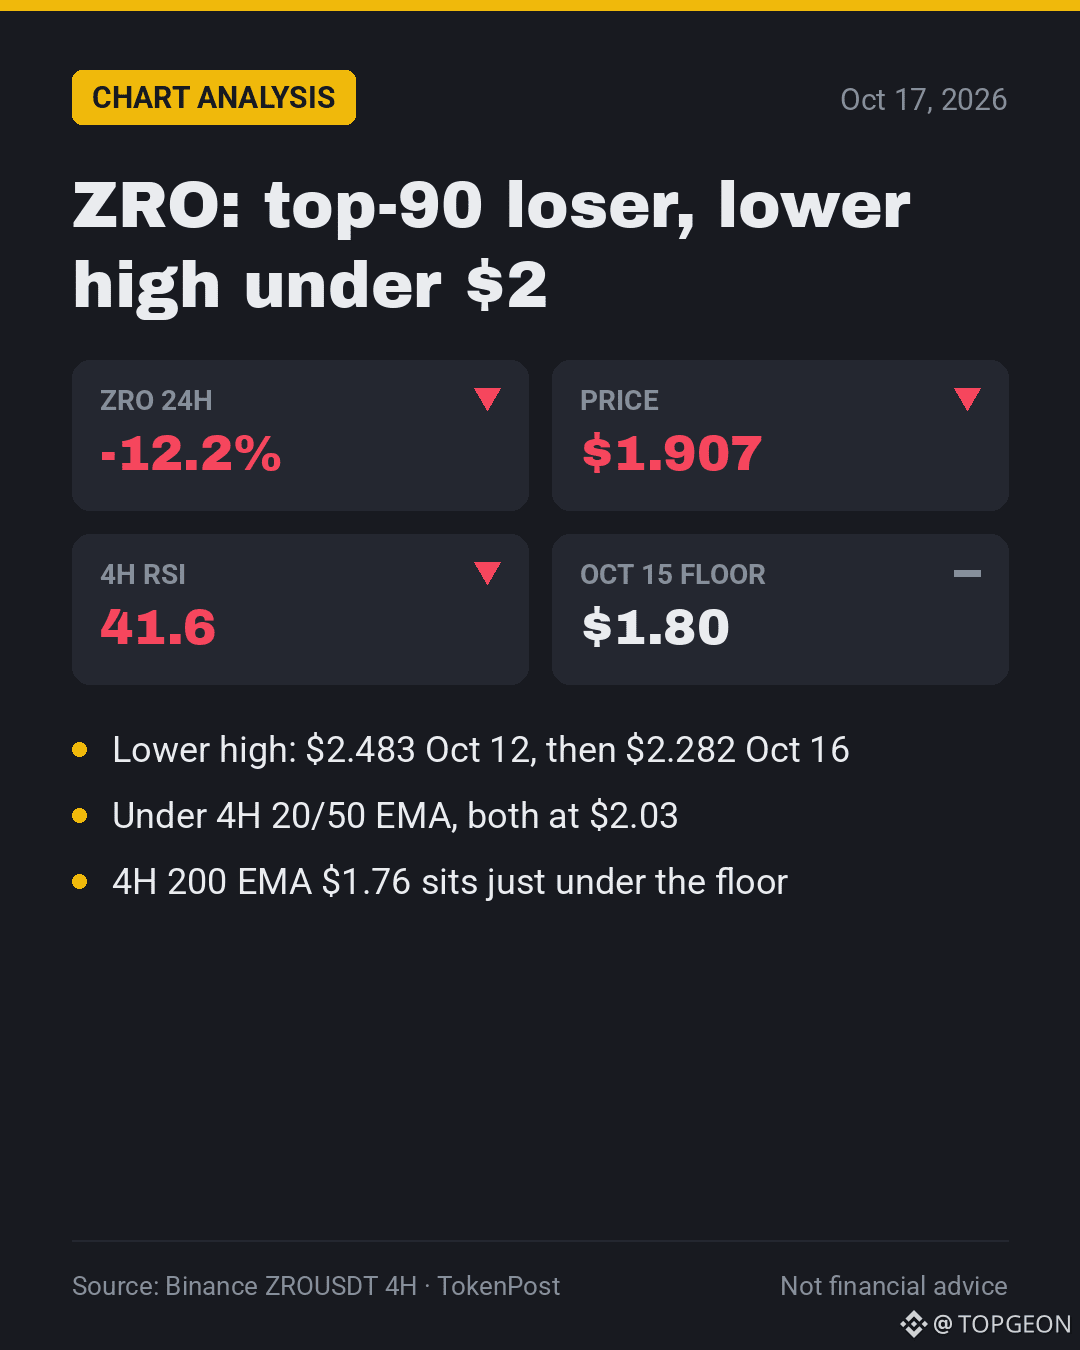
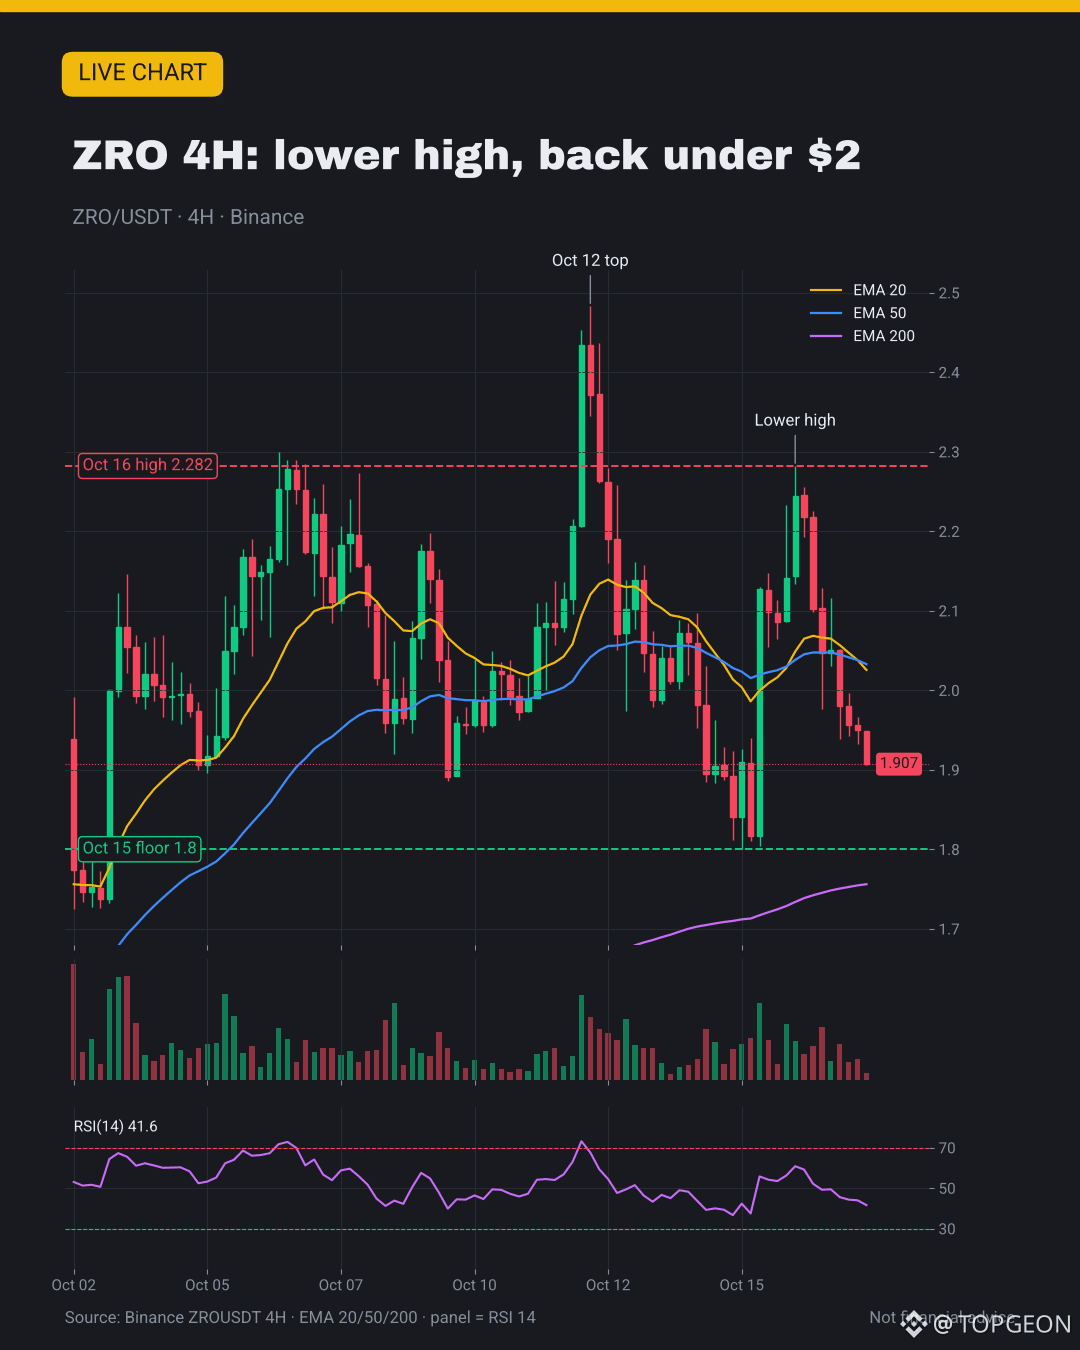
🤔 $ZRO -12%-lik gündən sonra yenidən $1.80 dib səviyyəsinə enirmi?
⚠️ UTC vaxtı ilə 08:00-da ilk 90 coin arasında ən çox dəyər itirən (TokenPost)
⚠️ Daha aşağı zirvə: oktyabrın 12-də $2.483, oktyabrın 16-da isə cəmi $2.282
⚠️ Hazırda $1.907 — 4 saatlıq 20/50 EMA-nın (hər ikisi $2.03) altında; RSI 41.6
✅ Oktyabrın 15-də $1.80 səviyyəsindəki dib qiymət $2.13-ə qədər 18%-lik sıçrayışa səbəb oldu
✅ 4 saatlıq 200 EMA — $1.76 — əlavə dayaq rolunu oynayır
🎯 Məncə: $1.80-dən aşağı düşərsə → $1.76-nın testi; $2.03-ü geri alarsa → $2.28-in təkrar testi
💬 ZRO üçün $1.80-dən sıçrayış, yoxsa daha da aşağı eniş? 👇
#LayerZero #ZRO #ChartAnalysis
🤔 $ZRO -12%-lik gündən sonra yenidən $1.80 dib səviyyəsinə enirmi?
⚠️ UTC vaxtı ilə 08:00-da ilk 90 coin arasında ən çox dəyər itirən (TokenPost)
⚠️ Daha aşağı zirvə: oktyabrın 12-də $2.483, oktyabrın 16-da isə cəmi $2.282
⚠️ Hazırda $1.907 — 4 saatlıq 20/50 EMA-nın (hər ikisi $2.03) altında; RSI 41.6
✅ Oktyabrın 15-də $1.80 səviyyəsindəki dib qiymət $2.13-ə qədər 18%-lik sıçrayışa səbəb oldu
✅ 4 saatlıq 200 EMA — $1.76 — əlavə dayaq rolunu oynayır
🎯 Məncə: $1.80-dən aşağı düşərsə → $1.76-nın testi; $2.03-ü geri alarsa → $2.28-in təkrar testi
💬 ZRO üçün $1.80-dən sıçrayış, yoxsa daha da aşağı eniş? 👇
#LayerZero #ZRO #ChartAnalysis
⚠️ UTC vaxtı ilə 08:00-da ilk 90 coin arasında ən çox dəyər itirən (TokenPost)
⚠️ Daha aşağı zirvə: oktyabrın 12-də $2.483, oktyabrın 16-da isə cəmi $2.282
⚠️ Hazırda $1.907 — 4 saatlıq 20/50 EMA-nın (hər ikisi $2.03) altında; RSI 41.6
✅ Oktyabrın 15-də $1.80 səviyyəsindəki dib qiymət $2.13-ə qədər 18%-lik sıçrayışa səbəb oldu
✅ 4 saatlıq 200 EMA — $1.76 — əlavə dayaq rolunu oynayır
🎯 Məncə: $1.80-dən aşağı düşərsə → $1.76-nın testi; $2.03-ü geri alarsa → $2.28-in təkrar testi
💬 ZRO üçün $1.80-dən sıçrayış, yoxsa daha da aşağı eniş? 👇
#LayerZero #ZRO #ChartAnalysis
110
·
--
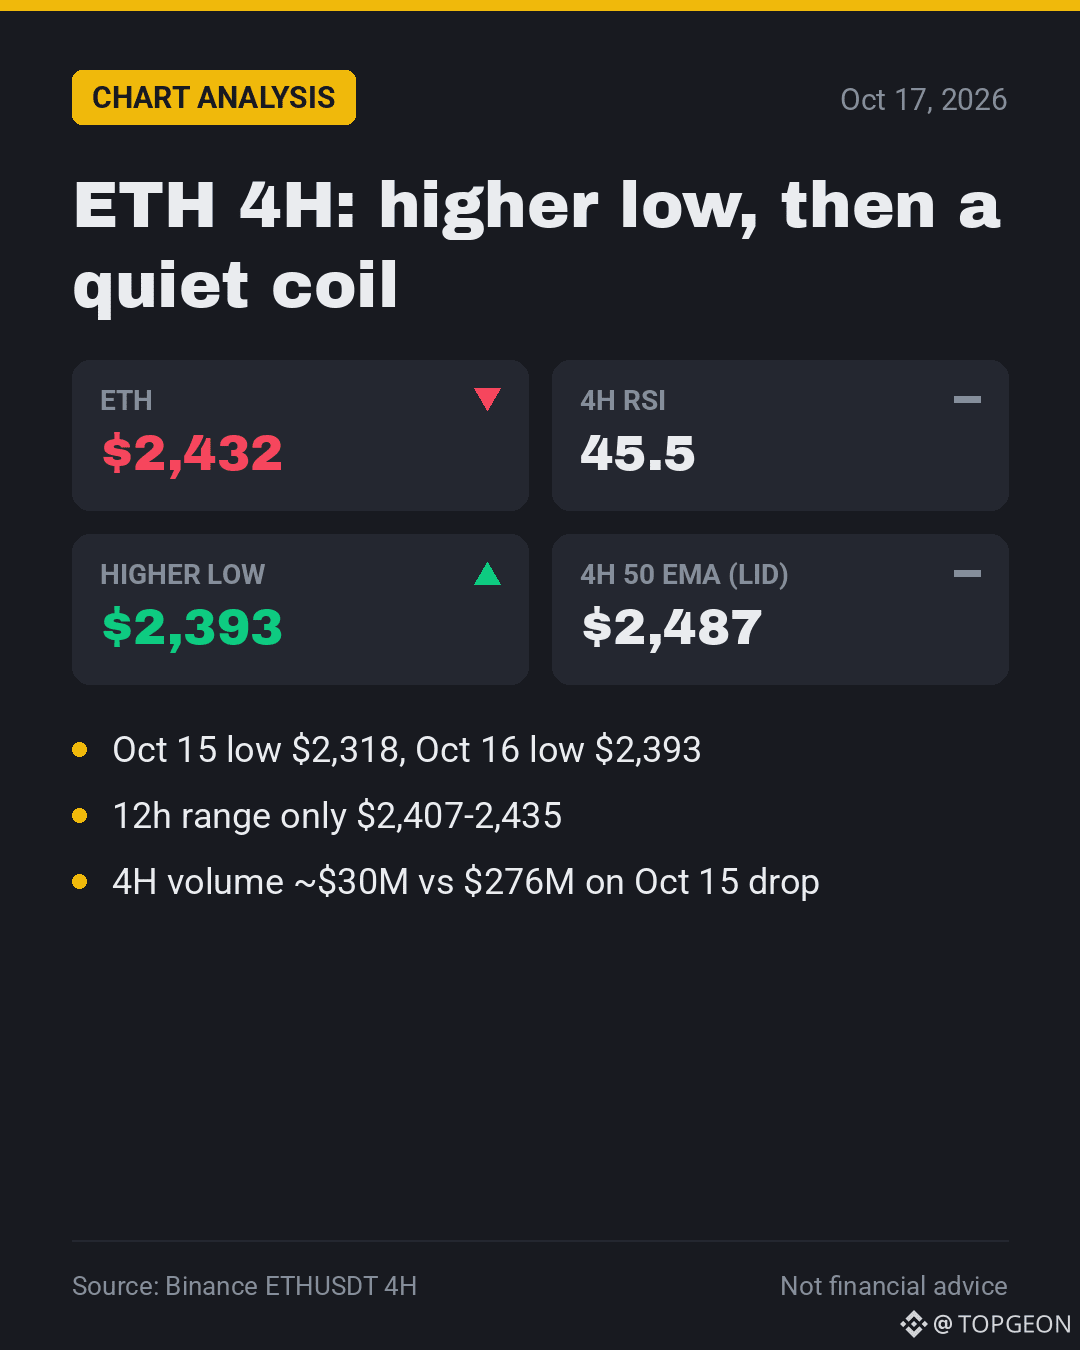
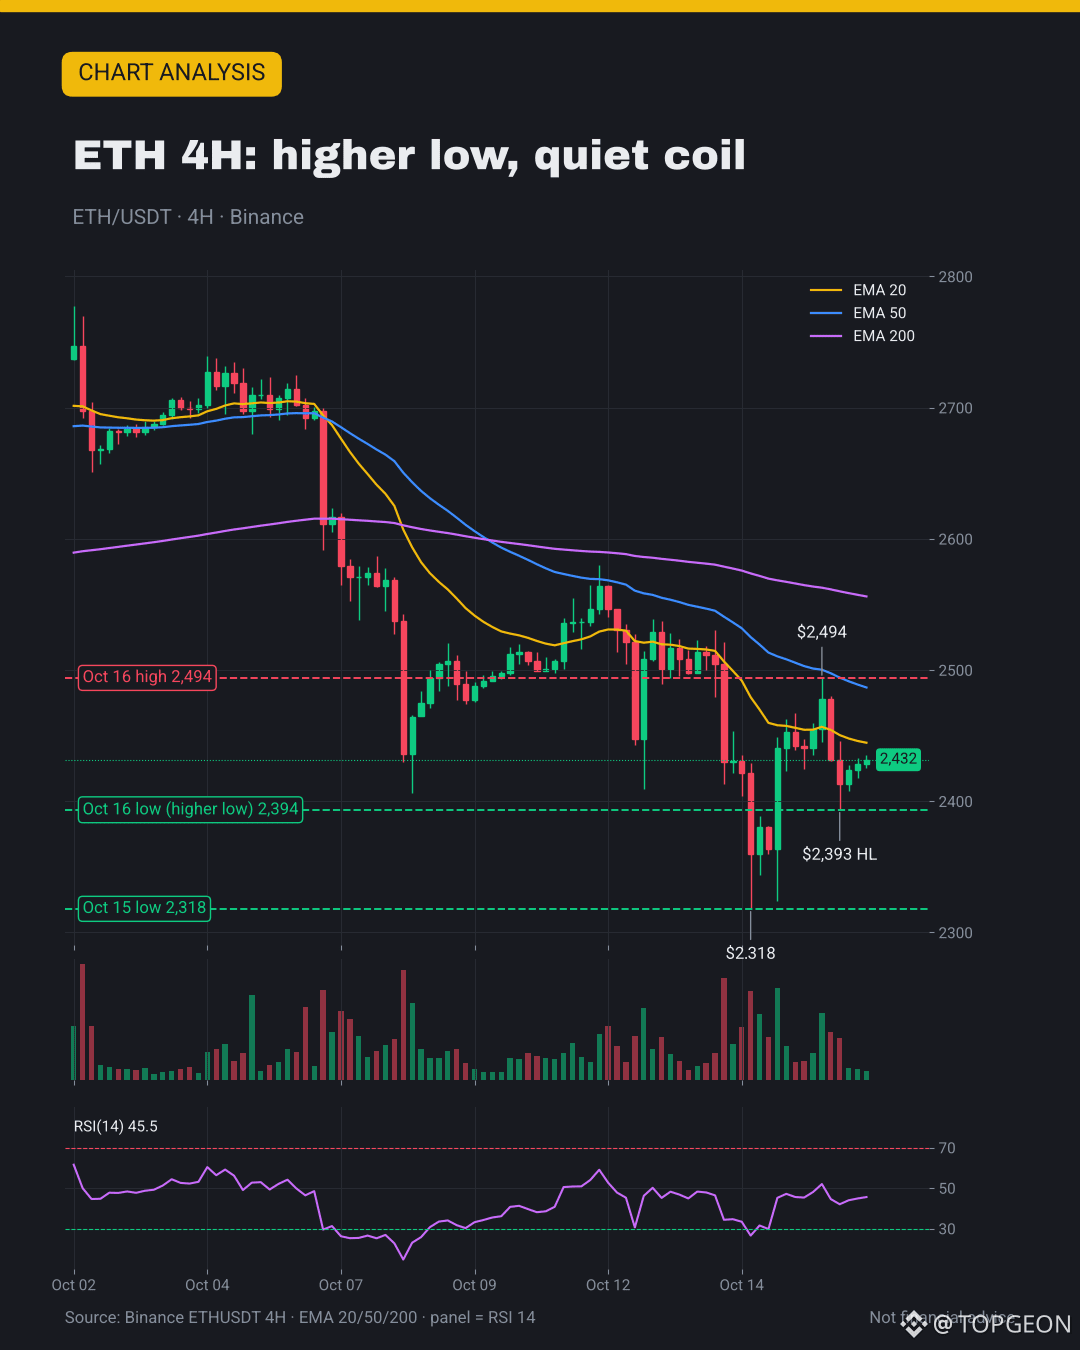
🤔 $ETH daha yüksək minimumdan sonra hərəkətə hazırlaşaraq sıxılır?
✅ 16 oktabr minimumu $2,393, 15 oktyabrın $2,318 minimumundan yuxarı qaldı
✅ 12 saatdır dar $2,407-2,435 diapazonunda hərəkətsiz qalıb
⚠️ Hələ də 4H 20/50 EMA səviyyələrindən — $2,445 / $2,487 — aşağıdadır
⚠️ 16 oktyabr sıçrayışı $2,494-də dayandı, RSI cəmi 45.5 oldu
📉 4H həcm təxminən $30M-dir; 15 oktyabr enişində isə $276M olmuşdu
🎯 Mənim fikrimcə: 4H bağlanışı > $2,494 → $2,556 (200 EMA); < $2,393 → $2,318
💬 ETH üçün bu sıxılma hansı istiqamətdə əvvəlcə qırılacaq? 👇
#ETH #Ethereum #ChartAnalysis
🤔 $ETH daha yüksək minimumdan sonra hərəkətə hazırlaşaraq sıxılır?
✅ 16 oktabr minimumu $2,393, 15 oktyabrın $2,318 minimumundan yuxarı qaldı
✅ 12 saatdır dar $2,407-2,435 diapazonunda hərəkətsiz qalıb
⚠️ Hələ də 4H 20/50 EMA səviyyələrindən — $2,445 / $2,487 — aşağıdadır
⚠️ 16 oktyabr sıçrayışı $2,494-də dayandı, RSI cəmi 45.5 oldu
📉 4H həcm təxminən $30M-dir; 15 oktyabr enişində isə $276M olmuşdu
🎯 Mənim fikrimcə: 4H bağlanışı > $2,494 → $2,556 (200 EMA); < $2,393 → $2,318
💬 ETH üçün bu sıxılma hansı istiqamətdə əvvəlcə qırılacaq? 👇
#ETH #Ethereum #ChartAnalysis
✅ 16 oktabr minimumu $2,393, 15 oktyabrın $2,318 minimumundan yuxarı qaldı
✅ 12 saatdır dar $2,407-2,435 diapazonunda hərəkətsiz qalıb
⚠️ Hələ də 4H 20/50 EMA səviyyələrindən — $2,445 / $2,487 — aşağıdadır
⚠️ 16 oktyabr sıçrayışı $2,494-də dayandı, RSI cəmi 45.5 oldu
📉 4H həcm təxminən $30M-dir; 15 oktyabr enişində isə $276M olmuşdu
🎯 Mənim fikrimcə: 4H bağlanışı > $2,494 → $2,556 (200 EMA); < $2,393 → $2,318
💬 ETH üçün bu sıxılma hansı istiqamətdə əvvəlcə qırılacaq? 👇
#ETH #Ethereum #ChartAnalysis
23
·
--
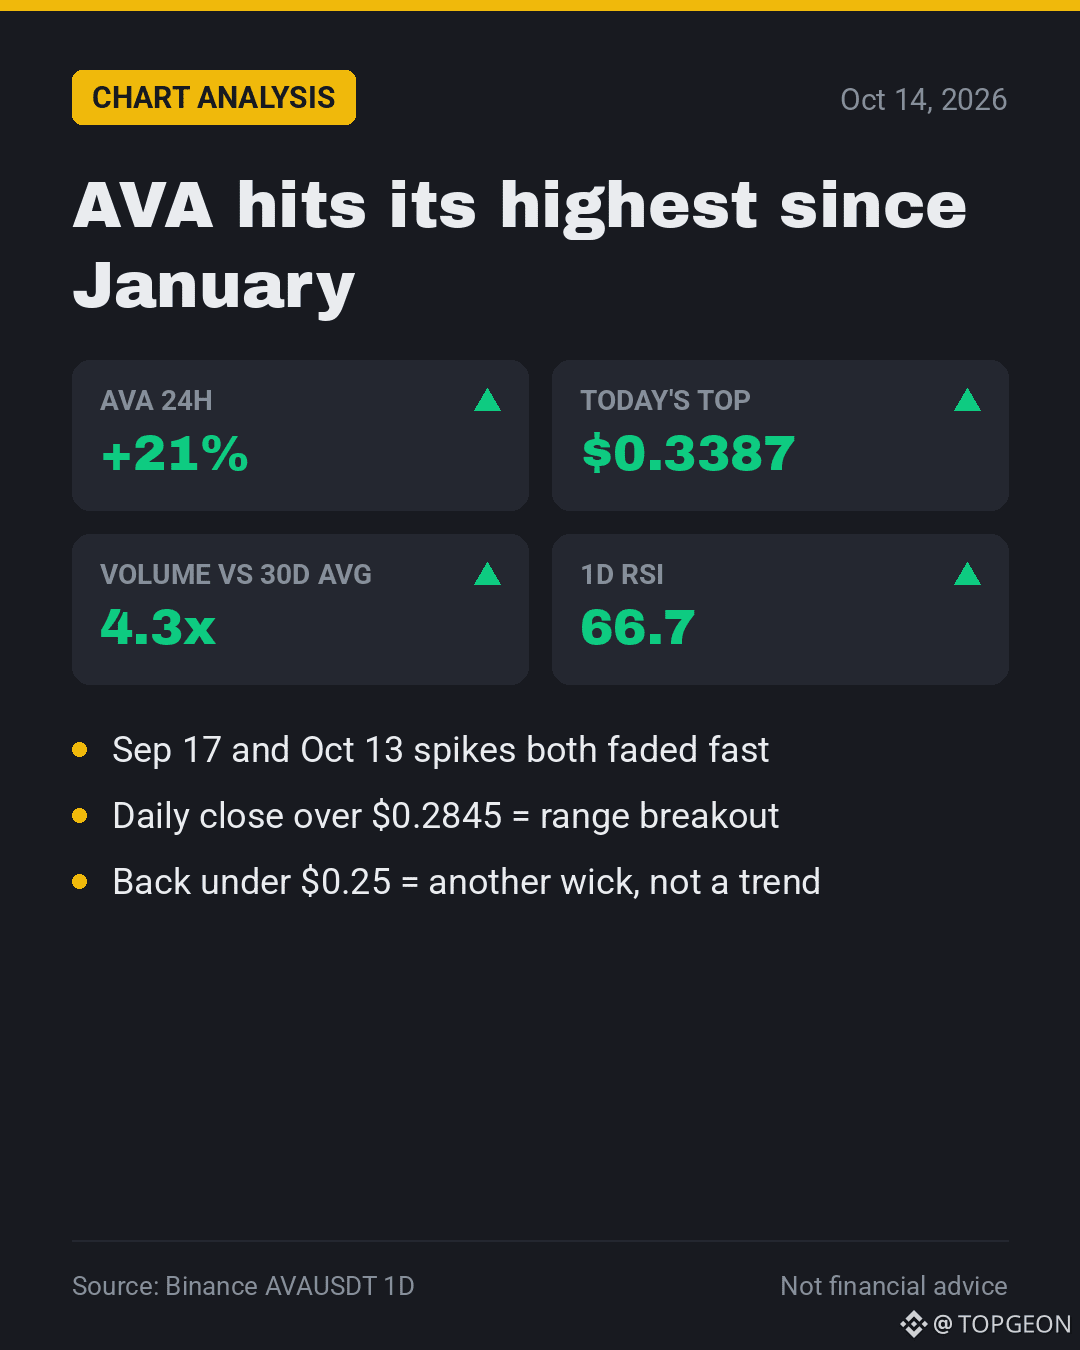
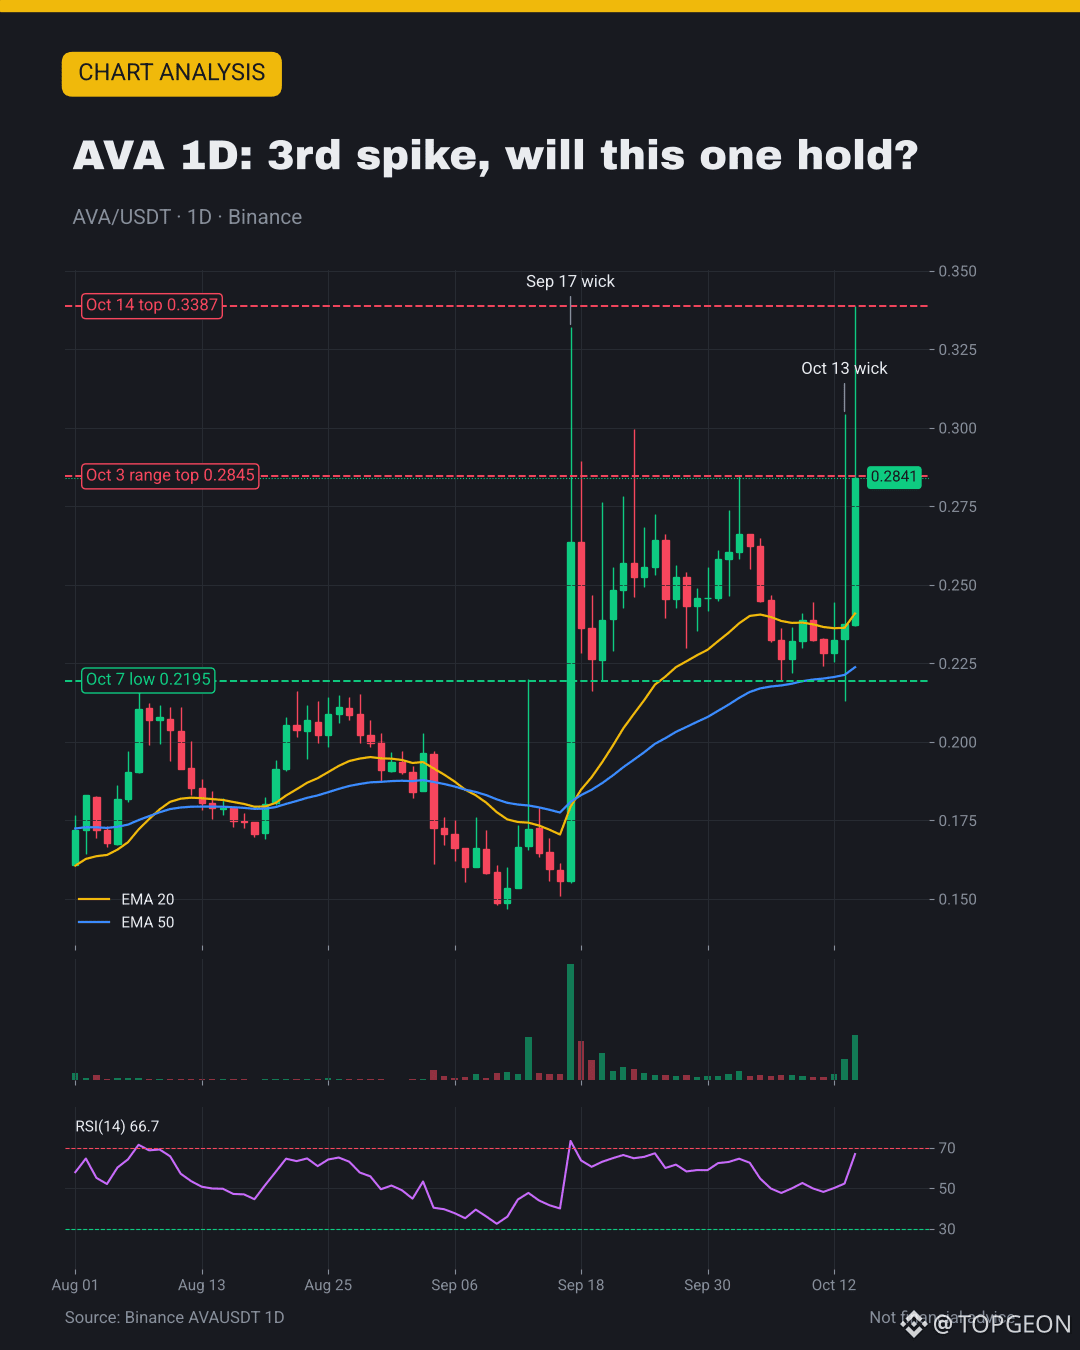
❓ $AVA nəhayət müqaviməti qırır, yoxsa bu, 3-cü fitildir?
📍 İndi $0.2874, 24 saatda +21%, zirvə $0.3387 = yanvardan bəri ən yüksək
✅ Həcm $11.3M, 30 günlük ortalamadan təxminən 4.3 dəfə çox
✅ Yenidən 1D EMA 20/50 səviyyələrinin ($0.24/$0.22) üzərindədir, RSI 66.7
⚠️ 17 sentyabrda ($0.332) və 13 oktyabrda ($0.304) olan sıçrayışların ikisi də sönüb
⚠️ Hələlik bu hərəkətin arxasında aydın xəbər yoxdur
🎯 Məncə: gündəlik bağlanış $0.2845-dən yuxarı = qırılma; $0.25-dən aşağı = eniş
💬 Gündəlik bağlanışadək saxlayırsınız, yoxsa mənfəəti götürürsünüz? 👇
#AVA #Altcoins #ChartAnalysis
❓ $AVA nəhayət müqaviməti qırır, yoxsa bu, 3-cü fitildir?
📍 İndi $0.2874, 24 saatda +21%, zirvə $0.3387 = yanvardan bəri ən yüksək
✅ Həcm $11.3M, 30 günlük ortalamadan təxminən 4.3 dəfə çox
✅ Yenidən 1D EMA 20/50 səviyyələrinin ($0.24/$0.22) üzərindədir, RSI 66.7
⚠️ 17 sentyabrda ($0.332) və 13 oktyabrda ($0.304) olan sıçrayışların ikisi də sönüb
⚠️ Hələlik bu hərəkətin arxasında aydın xəbər yoxdur
🎯 Məncə: gündəlik bağlanış $0.2845-dən yuxarı = qırılma; $0.25-dən aşağı = eniş
💬 Gündəlik bağlanışadək saxlayırsınız, yoxsa mənfəəti götürürsünüz? 👇
#AVA #Altcoins #ChartAnalysis
📍 İndi $0.2874, 24 saatda +21%, zirvə $0.3387 = yanvardan bəri ən yüksək
✅ Həcm $11.3M, 30 günlük ortalamadan təxminən 4.3 dəfə çox
✅ Yenidən 1D EMA 20/50 səviyyələrinin ($0.24/$0.22) üzərindədir, RSI 66.7
⚠️ 17 sentyabrda ($0.332) və 13 oktyabrda ($0.304) olan sıçrayışların ikisi də sönüb
⚠️ Hələlik bu hərəkətin arxasında aydın xəbər yoxdur
🎯 Məncə: gündəlik bağlanış $0.2845-dən yuxarı = qırılma; $0.25-dən aşağı = eniş
💬 Gündəlik bağlanışadək saxlayırsınız, yoxsa mənfəəti götürürsünüz? 👇
#AVA #Altcoins #ChartAnalysis
48

·
--
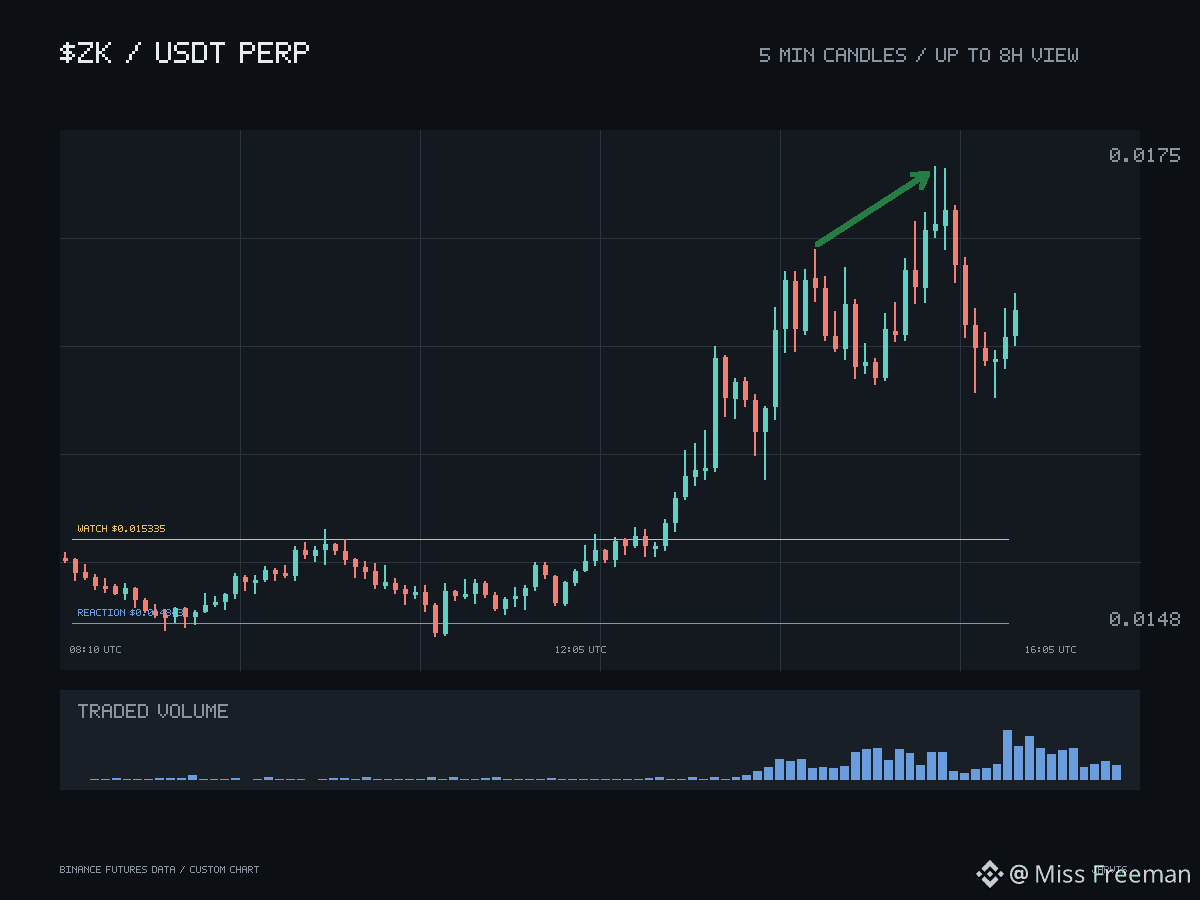
$ZK Konstruktiv qrafik əslində iddialar toplusudur və faydalı yanaşma qiymət bunu sizin üçün etməzdən əvvəl onları sıralamaqdır. üçün bu sıradakı ən zəif iddia 0.014843 səviyyəsindədir — lokal reaksiya səviyyəsi; onun rolu məhduddur: ilk təkrar testdə ya satıcıların təzyiqi udulur və qiymət yenidən bu səviyyənin üstündə bağlanır, ya da qiymət qrafikində fitil səviyyəni keçir və qiymət sürüşərək aşağı enir. Bu səviyyəyə çatanda vəziyyəti qiymətləndirmək üçün qiymət strukturu və həcm ən güclü vasitələrdir; təmas nöqtəsində taker axınına da diqqət yetirmək lazımdır. Heç nə əvvəlcədən müəyyən deyil.
Növbəti izləniləcək 0.015335 səviyyəsi yalnız reaksiya səviyyəsində ardıcıllıqla həqiqi müdafiə göründükdən sonra əhəmiyyət qazanır. Öz təkrar testini etmədən göstərilən güc kimin mövqedə qalmaq niyyətində olduğu barədə az şey deyir.
Bu sıradakı ən güclü iddia 0.013791 səviyyəsindədir və энэ нь эхнийхээс илүү гүн хувилбар биш, харин өөр төрлийн мэдэгдэл юм. Үүнийг алдах нь ганцхан буцаан таталтыг бүтэлгүйтүүлэхгүй; харин конструктив үнэлгээнд тулгуур болох өндөр оргил, өндөр ёроолын зан төлөвийг үгүйсгэнэ. Үүнээс дээш тогтох нь дангаараа юу ч батлахгүй — амьд үлдэх нь эрүүл байна гэсэн үг биш бөгөөд энэ хоёрын үүрэг тусдаа хэвээр байна.
Эсрэг хүчин зүйлс нь деривативын талд байна: нээлттэй позиц болон одоогийн санхүүжилтийн үзүүлэлт; эдгээрийн аль нь ч спотын бүтэц, хэмжээ шиг хүчийг батлахгүй. Байршуулалтын болгоомжлолтой конструктив төлөв, тодорхойгүй байдал дунд зэрэг.
#Crypto #QrafikTəhlili
$ZK Konstruktiv qrafik əslində iddialar toplusudur və faydalı yanaşma qiymət bunu sizin üçün etməzdən əvvəl onları sıralamaqdır. üçün bu sıradakı ən zəif iddia 0.014843 səviyyəsindədir — lokal reaksiya səviyyəsi; onun rolu məhduddur: ilk təkrar testdə ya satıcıların təzyiqi udulur və qiymət yenidən bu səviyyənin üstündə bağlanır, ya da qiymət qrafikində fitil səviyyəni keçir və qiymət sürüşərək aşağı enir. Bu səviyyəyə çatanda vəziyyəti qiymətləndirmək üçün qiymət strukturu və həcm ən güclü vasitələrdir; təmas nöqtəsində taker axınına da diqqət yetirmək lazımdır. Heç nə əvvəlcədən müəyyən deyil.
Növbəti izləniləcək 0.015335 səviyyəsi yalnız reaksiya səviyyəsində ardıcıllıqla həqiqi müdafiə göründükdən sonra əhəmiyyət qazanır. Öz təkrar testini etmədən göstərilən güc kimin mövqedə qalmaq niyyətində olduğu barədə az şey deyir.
Bu sıradakı ən güclü iddia 0.013791 səviyyəsindədir və энэ нь эхнийхээс илүү гүн хувилбар биш, харин өөр төрлийн мэдэгдэл юм. Үүнийг алдах нь ганцхан буцаан таталтыг бүтэлгүйтүүлэхгүй; харин конструктив үнэлгээнд тулгуур болох өндөр оргил, өндөр ёроолын зан төлөвийг үгүйсгэнэ. Үүнээс дээш тогтох нь дангаараа юу ч батлахгүй — амьд үлдэх нь эрүүл байна гэсэн үг биш бөгөөд энэ хоёрын үүрэг тусдаа хэвээр байна.
Эсрэг хүчин зүйлс нь деривативын талд байна: нээлттэй позиц болон одоогийн санхүүжилтийн үзүүлэлт; эдгээрийн аль нь ч спотын бүтэц, хэмжээ шиг хүчийг батлахгүй. Байршуулалтын болгоомжлолтой конструктив төлөв, тодорхойгүй байдал дунд зэрэг.
#Crypto #QrafikTəhlili
Növbəti izləniləcək 0.015335 səviyyəsi yalnız reaksiya səviyyəsində ardıcıllıqla həqiqi müdafiə göründükdən sonra əhəmiyyət qazanır. Öz təkrar testini etmədən göstərilən güc kimin mövqedə qalmaq niyyətində olduğu barədə az şey deyir.
Bu sıradakı ən güclü iddia 0.013791 səviyyəsindədir və энэ нь эхнийхээс илүү гүн хувилбар биш, харин өөр төрлийн мэдэгдэл юм. Үүнийг алдах нь ганцхан буцаан таталтыг бүтэлгүйтүүлэхгүй; харин конструктив үнэлгээнд тулгуур болох өндөр оргил, өндөр ёроолын зан төлөвийг үгүйсгэнэ. Үүнээс дээш тогтох нь дангаараа юу ч батлахгүй — амьд үлдэх нь эрүүл байна гэсэн үг биш бөгөөд энэ хоёрын үүрэг тусдаа хэвээр байна.
Эсрэг хүчин зүйлс нь деривативын талд байна: нээлттэй позиц болон одоогийн санхүүжилтийн үзүүлэлт; эдгээрийн аль нь ч спотын бүтэц, хэмжээ шиг хүчийг батлахгүй. Байршуулалтын болгоомжлолтой конструктив төлөв, тодорхойгүй байдал дунд зэрэг.
#Crypto #QrafikTəhlili
1
387
·
--
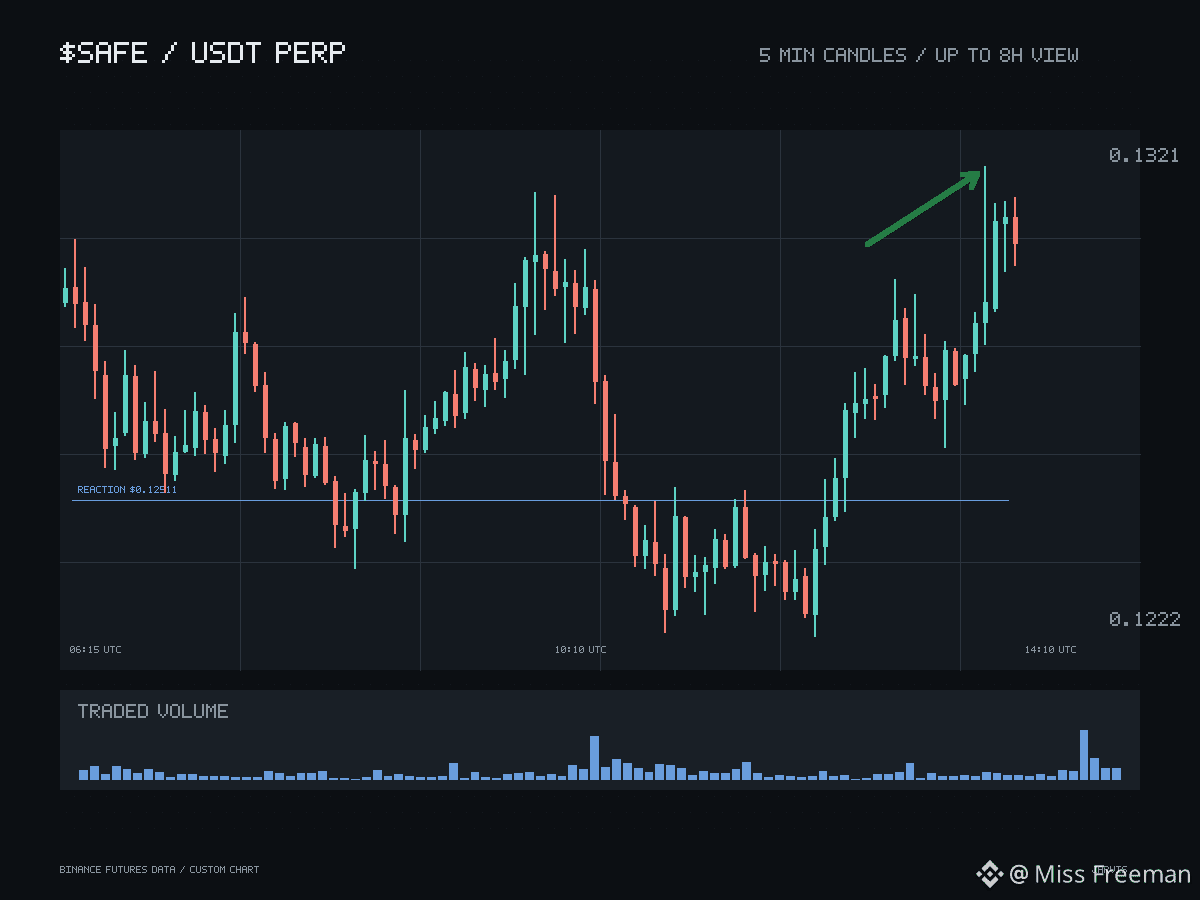
$SAFE daha yüksəkdir və qazancın özü qrafikin ən az maraqlı hissəsidir. Sürətli yüksəlişlər məsafəni göstərir; qiymətin altındakı zəminin vaxtilə lazımi qaydada alınıb-alınmadığı barədə isə heç nə demir. Bu sual yalnız hərəkətin bir hissəsi geri verildikdə ortaya çıxır.
Bu sualın ilk ünvanı 0.12511-dir. Buradakı sınaq konkretdir: ilk təkrar sınaqda ya satıcılar qarşılanıb udulur və qiymət yenidən bu səviyyənin üzərində bağlanır, ya da qiymət axını səviyyədən aşağı düşüb sürüşərək davam edir. Bu baş verdikdən sonra qiymət strukturu və həcm ən güclü dəlillərdir — əvvəlcədən heç nə bunu müəyyən etmir. Yalnız həqiqi müdafiə görünərsə, ardıcıllığı qorumaq şərtilə növbəti izlənəcək sahə kimi 0.13346 əhəmiyyət qazanır. Öz təkrar sınağını keçmədən göstərilən güc, kimin qalmaq niyyətində olduğu barədə az şey deyir.
Daha aşağıda 0.11921 başqa cür məna daşıyır; bu, eyni iddianın daha dərin səviyyədə təkrarı deyil. Bu səviyyənin itirilməsi təkcə bir geriçəkilmənin uğursuzluğu olmaz; konstruktiv şərhin əsaslandığı daha yüksək zirvə və daha yüksək dib ardıcıllığını da ləğv edər. Eyni məntiqlə, bu səviyyənin üzərində qalmaq da özlüyündə heç nəyi sübut etmir — sağ qalmaq sağlamlıq demək deyil və bu iki fikir ayrı saxlanmalıdır.
Tarazlaşdırıcı amillər törəmə alətlər tərəfindədir: açıq mövqelər və cari maliyyələşdirmə göstəricisi. Bunların heç biri spot bazarının strukturu kimi gücü təsdiqləmir. Konstruktiv mənzərə, mövqeləşmə ilə bağlı ehtiyatlılıq.
#Crypto #QrafikTəhlili
$SAFE daha yüksəkdir və qazancın özü qrafikin ən az maraqlı hissəsidir. Sürətli yüksəlişlər məsafəni göstərir; qiymətin altındakı zəminin vaxtilə lazımi qaydada alınıb-alınmadığı barədə isə heç nə demir. Bu sual yalnız hərəkətin bir hissəsi geri verildikdə ortaya çıxır.
Bu sualın ilk ünvanı 0.12511-dir. Buradakı sınaq konkretdir: ilk təkrar sınaqda ya satıcılar qarşılanıb udulur və qiymət yenidən bu səviyyənin üzərində bağlanır, ya da qiymət axını səviyyədən aşağı düşüb sürüşərək davam edir. Bu baş verdikdən sonra qiymət strukturu və həcm ən güclü dəlillərdir — əvvəlcədən heç nə bunu müəyyən etmir. Yalnız həqiqi müdafiə görünərsə, ardıcıllığı qorumaq şərtilə növbəti izlənəcək sahə kimi 0.13346 əhəmiyyət qazanır. Öz təkrar sınağını keçmədən göstərilən güc, kimin qalmaq niyyətində olduğu barədə az şey deyir.
Daha aşağıda 0.11921 başqa cür məna daşıyır; bu, eyni iddianın daha dərin səviyyədə təkrarı deyil. Bu səviyyənin itirilməsi təkcə bir geriçəkilmənin uğursuzluğu olmaz; konstruktiv şərhin əsaslandığı daha yüksək zirvə və daha yüksək dib ardıcıllığını da ləğv edər. Eyni məntiqlə, bu səviyyənin üzərində qalmaq da özlüyündə heç nəyi sübut etmir — sağ qalmaq sağlamlıq demək deyil və bu iki fikir ayrı saxlanmalıdır.
Tarazlaşdırıcı amillər törəmə alətlər tərəfindədir: açıq mövqelər və cari maliyyələşdirmə göstəricisi. Bunların heç biri spot bazarının strukturu kimi gücü təsdiqləmir. Konstruktiv mənzərə, mövqeləşmə ilə bağlı ehtiyatlılıq.
#Crypto #QrafikTəhlili
Bu sualın ilk ünvanı 0.12511-dir. Buradakı sınaq konkretdir: ilk təkrar sınaqda ya satıcılar qarşılanıb udulur və qiymət yenidən bu səviyyənin üzərində bağlanır, ya da qiymət axını səviyyədən aşağı düşüb sürüşərək davam edir. Bu baş verdikdən sonra qiymət strukturu və həcm ən güclü dəlillərdir — əvvəlcədən heç nə bunu müəyyən etmir. Yalnız həqiqi müdafiə görünərsə, ardıcıllığı qorumaq şərtilə növbəti izlənəcək sahə kimi 0.13346 əhəmiyyət qazanır. Öz təkrar sınağını keçmədən göstərilən güc, kimin qalmaq niyyətində olduğu barədə az şey deyir.
Daha aşağıda 0.11921 başqa cür məna daşıyır; bu, eyni iddianın daha dərin səviyyədə təkrarı deyil. Bu səviyyənin itirilməsi təkcə bir geriçəkilmənin uğursuzluğu olmaz; konstruktiv şərhin əsaslandığı daha yüksək zirvə və daha yüksək dib ardıcıllığını da ləğv edər. Eyni məntiqlə, bu səviyyənin üzərində qalmaq da özlüyündə heç nəyi sübut etmir — sağ qalmaq sağlamlıq demək deyil və bu iki fikir ayrı saxlanmalıdır.
Tarazlaşdırıcı amillər törəmə alətlər tərəfindədir: açıq mövqelər və cari maliyyələşdirmə göstəricisi. Bunların heç biri spot bazarının strukturu kimi gücü təsdiqləmir. Konstruktiv mənzərə, mövqeləşmə ilə bağlı ehtiyatlılıq.
#Crypto #QrafikTəhlili
101
·
--
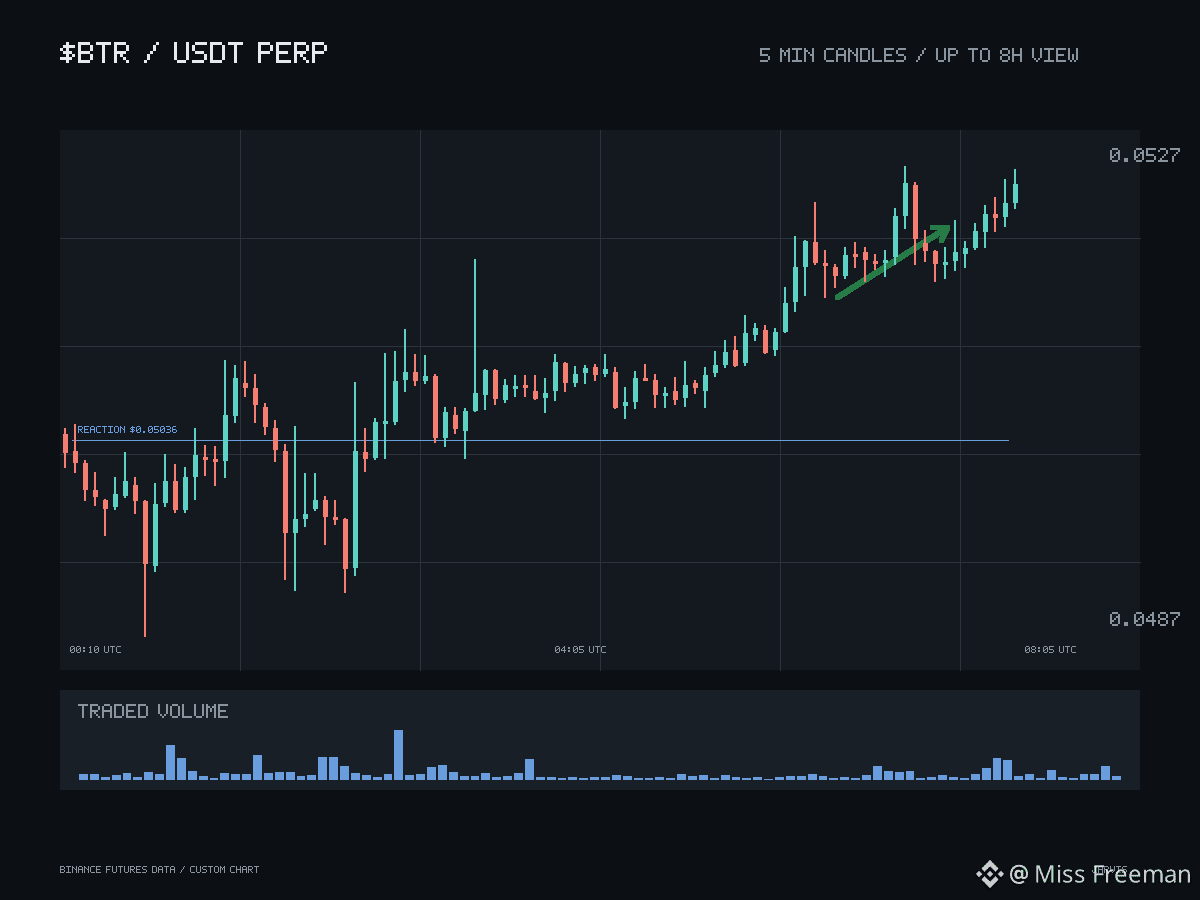
$BTR ən yaxın dəstək səviyyəsi olan 0.05036-dan yuxarıdır və bu mövqe asan suala cavab verir — qiymət hərəkət edə bilər. Daha çətin sual isə onun altındakı zəminin nə qədər dayanıqlı olduğudur; bu sual yalnız hərəkətin bir hissəsi geri qaytarılanda ortaya çıxır.
İlk təkrar sınaq 0.05036 səviyyəsində baş verir. Buradakı vəzifə konkretdir: qiymət həmin səviyyəyə toxunanda satıcılar udulur və qiymət yenidən yuxarıda bağlanır, yoxsa qiymət qrafikdə bu səviyyənin altına iynə atıb aşağı sürüşür? Bu baş verəndən sonra bunu qiymətləndirmək üçün ən güclü vasitələr qiymət strukturu və həcmdir; təmas anındakı taker axınına da diqqət yetirmək lazımdır — əvvəlcədən heç nə bunu qəti şəkildə müəyyən etmir.
Yalnız həmin səviyyənin həqiqətən müdafiə olunmasından sonra növbəti izləniləcək səviyyə kimi 0.05327 əhəmiyyət qazanır — ardıcıllıq mütləq qorunmalıdır. Öz təkrar sınağını ötüb keçən güc, kimin qalmaq niyyətində olduğu barədə çox az şey deyir.
Daha aşağıda 0.04873 eyni iddianın daha dərin variantı deyil, tamam başqa iddiadır. Bu səviyyənin itirilməsi təkcə bir geriçəkilmənin uğursuzluğu demək olmaz — konstruktiv ssenarinin əsaslandığı daha yüksək zirvə və daha yüksək dib davranışını ləğv edər. Bu səviyyənin üstündə qalmaq da öz-özlüyündə heç nəyi sübut etmir. Sağ qalmaq sağlamlıq demək deyil və reaksiya səviyyəsinin altına qısa eniş ölümcül deyil; bu iki fikir ayrı saxlanmalıdır.
Əks-təsirlər törəmə alətlər tərəfindədir: açıq mövqe və hazırkı maliyyələşdirmə göstəricisi. Bunların heç biri spot bazar strukturunun göstərdiyi şəkildə gücü təsdiqləmir. Mövqe ehtiyatlılığı ilə konstruktiv mənzərə və orta qeyri-müəyyənlik.
#Crypto #QrafikTəhlili
$BTR ən yaxın dəstək səviyyəsi olan 0.05036-dan yuxarıdır və bu mövqe asan suala cavab verir — qiymət hərəkət edə bilər. Daha çətin sual isə onun altındakı zəminin nə qədər dayanıqlı olduğudur; bu sual yalnız hərəkətin bir hissəsi geri qaytarılanda ortaya çıxır.
İlk təkrar sınaq 0.05036 səviyyəsində baş verir. Buradakı vəzifə konkretdir: qiymət həmin səviyyəyə toxunanda satıcılar udulur və qiymət yenidən yuxarıda bağlanır, yoxsa qiymət qrafikdə bu səviyyənin altına iynə atıb aşağı sürüşür? Bu baş verəndən sonra bunu qiymətləndirmək üçün ən güclü vasitələr qiymət strukturu və həcmdir; təmas anındakı taker axınına da diqqət yetirmək lazımdır — əvvəlcədən heç nə bunu qəti şəkildə müəyyən etmir.
Yalnız həmin səviyyənin həqiqətən müdafiə olunmasından sonra növbəti izləniləcək səviyyə kimi 0.05327 əhəmiyyət qazanır — ardıcıllıq mütləq qorunmalıdır. Öz təkrar sınağını ötüb keçən güc, kimin qalmaq niyyətində olduğu barədə çox az şey deyir.
Daha aşağıda 0.04873 eyni iddianın daha dərin variantı deyil, tamam başqa iddiadır. Bu səviyyənin itirilməsi təkcə bir geriçəkilmənin uğursuzluğu demək olmaz — konstruktiv ssenarinin əsaslandığı daha yüksək zirvə və daha yüksək dib davranışını ləğv edər. Bu səviyyənin üstündə qalmaq da öz-özlüyündə heç nəyi sübut etmir. Sağ qalmaq sağlamlıq demək deyil və reaksiya səviyyəsinin altına qısa eniş ölümcül deyil; bu iki fikir ayrı saxlanmalıdır.
Əks-təsirlər törəmə alətlər tərəfindədir: açıq mövqe və hazırkı maliyyələşdirmə göstəricisi. Bunların heç biri spot bazar strukturunun göstərdiyi şəkildə gücü təsdiqləmir. Mövqe ehtiyatlılığı ilə konstruktiv mənzərə və orta qeyri-müəyyənlik.
#Crypto #QrafikTəhlili
İlk təkrar sınaq 0.05036 səviyyəsində baş verir. Buradakı vəzifə konkretdir: qiymət həmin səviyyəyə toxunanda satıcılar udulur və qiymət yenidən yuxarıda bağlanır, yoxsa qiymət qrafikdə bu səviyyənin altına iynə atıb aşağı sürüşür? Bu baş verəndən sonra bunu qiymətləndirmək üçün ən güclü vasitələr qiymət strukturu və həcmdir; təmas anındakı taker axınına da diqqət yetirmək lazımdır — əvvəlcədən heç nə bunu qəti şəkildə müəyyən etmir.
Yalnız həmin səviyyənin həqiqətən müdafiə olunmasından sonra növbəti izləniləcək səviyyə kimi 0.05327 əhəmiyyət qazanır — ardıcıllıq mütləq qorunmalıdır. Öz təkrar sınağını ötüb keçən güc, kimin qalmaq niyyətində olduğu barədə çox az şey deyir.
Daha aşağıda 0.04873 eyni iddianın daha dərin variantı deyil, tamam başqa iddiadır. Bu səviyyənin itirilməsi təkcə bir geriçəkilmənin uğursuzluğu demək olmaz — konstruktiv ssenarinin əsaslandığı daha yüksək zirvə və daha yüksək dib davranışını ləğv edər. Bu səviyyənin üstündə qalmaq da öz-özlüyündə heç nəyi sübut etmir. Sağ qalmaq sağlamlıq demək deyil və reaksiya səviyyəsinin altına qısa eniş ölümcül deyil; bu iki fikir ayrı saxlanmalıdır.
Əks-təsirlər törəmə alətlər tərəfindədir: açıq mövqe və hazırkı maliyyələşdirmə göstəricisi. Bunların heç biri spot bazar strukturunun göstərdiyi şəkildə gücü təsdiqləmir. Mövqe ehtiyatlılığı ilə konstruktiv mənzərə və orta qeyri-müəyyənlik.
#Crypto #QrafikTəhlili
346
·
--
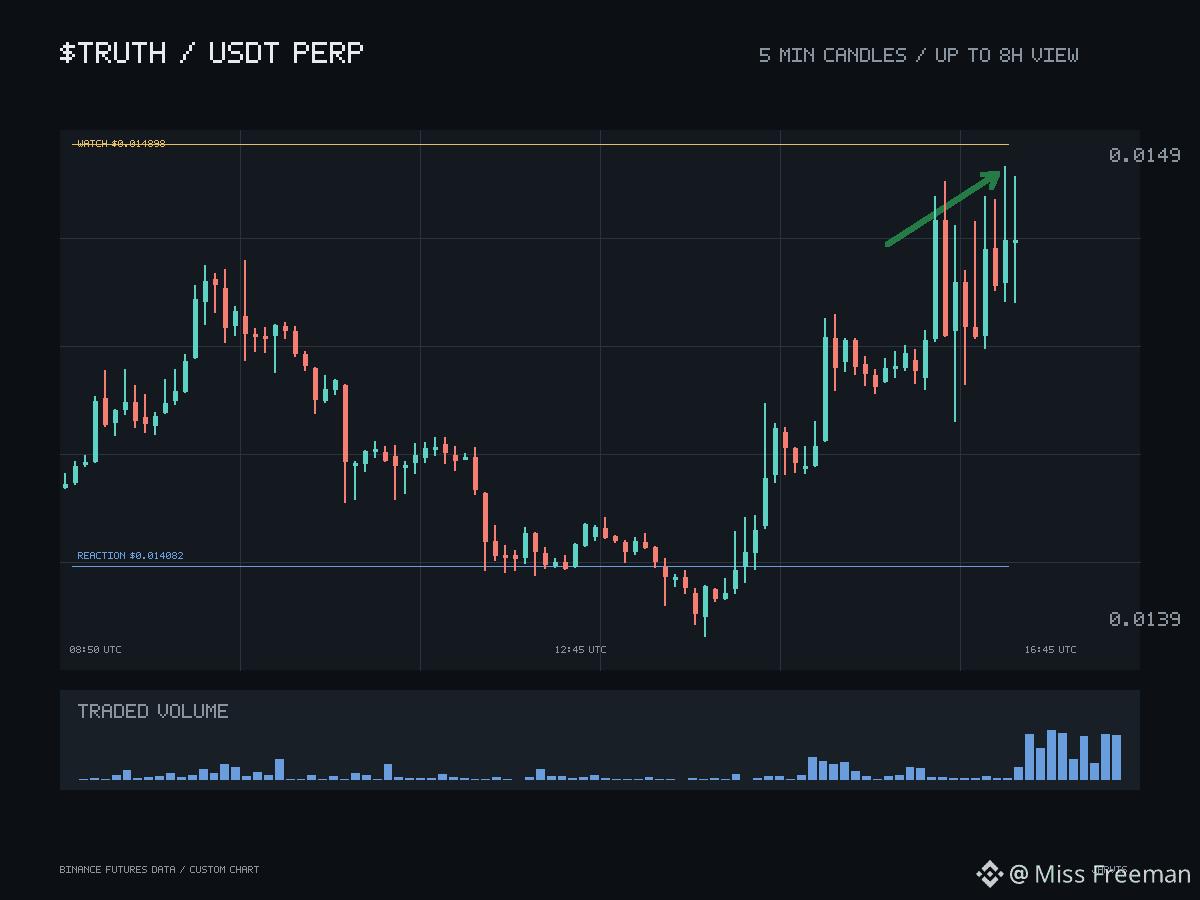
$TRUTH son lövbərindən reaksiya səviyyəsi müəyyənləşdirmək üçün kifayət qədər uzaqlaşıb və bu cür hərəkət yalnız asan suala cavab verir — qiymət hərəkət edə bilir. Açıq qalan məsələ isə qazanılmış mövqedə kimin dayanıb-dayanmadığıdır; bunu yalnız qazanılanın bir hissəsi geri verildikdən sonra müəyyən etmək olar.
İlk təkrar sınaq 0.014082 səviyyəsindədir. Onun rolu qəsdən məhdud tutulub: ya satıcılar burada qarşılanıb udulur və qiymət yenidən bu səviyyənin üzərində bağlanır, ya da şamın fitili səviyyəni keçir və qiymət sürüşməyə başlayır. Bu səviyyəyə çatanda vəziyyəti oxumaq üçün ən güclü vasitələr qiymət strukturu və həcmdir; ondan əvvəl heç nə məsələni aydınlaşdırmır.
Yalnız həmin səviyyədə həqiqi müdafiə gördükdən sonra növbəti izləniləcək səviyyə kimi 0.014898 diqqətə layiq olur — ardıcıllıq ciddi şəkildə qorunmaqla. Öz təkrar sınağını gözləmədən yüksələn güc, kimin mövqedə qalmaq niyyətində olduğu barədə az şey deyir.
Aşağıda 0.013549 eyni iddianın daha dərin variantı deyil, ayrıca bir həddir. Bu səviyyənin itirilməsi sadəcə bir geri çəkilmənin uğursuzluğu olmazdı; konstruktiv yanaşmanın əsaslandığı daha yüksək zirvə və daha yüksək dib ardıcıllığını pozardı. Bu səviyyənin üzərində qalmaq özlüyündə heç nəyi sübut etmir — sağ qalmaq sağlam olmaq demək deyil, reaksiya səviyyəsindən aşağı enmək isə həlledici zərbə deyil. Bu iki fikir ayrı saxlanmalıdır.
Эср балансы деривативlər tərəfindədir: açıq mövqelər və cari maliyyələşdirmə göstəricisi. Bunların heç biri spot bazar strukturu və həcm kimi gücü təsdiqləmir. Mövqe tutma ilə bağlı ehtiyatlı yanaşma tələb edən konstruktiv mənzərə və orta qeyri-müəyyənlik.
#Crypto #QrafikTəhlili
$TRUTH son lövbərindən reaksiya səviyyəsi müəyyənləşdirmək üçün kifayət qədər uzaqlaşıb və bu cür hərəkət yalnız asan suala cavab verir — qiymət hərəkət edə bilir. Açıq qalan məsələ isə qazanılmış mövqedə kimin dayanıb-dayanmadığıdır; bunu yalnız qazanılanın bir hissəsi geri verildikdən sonra müəyyən etmək olar.
İlk təkrar sınaq 0.014082 səviyyəsindədir. Onun rolu qəsdən məhdud tutulub: ya satıcılar burada qarşılanıb udulur və qiymət yenidən bu səviyyənin üzərində bağlanır, ya da şamın fitili səviyyəni keçir və qiymət sürüşməyə başlayır. Bu səviyyəyə çatanda vəziyyəti oxumaq üçün ən güclü vasitələr qiymət strukturu və həcmdir; ondan əvvəl heç nə məsələni aydınlaşdırmır.
Yalnız həmin səviyyədə həqiqi müdafiə gördükdən sonra növbəti izləniləcək səviyyə kimi 0.014898 diqqətə layiq olur — ardıcıllıq ciddi şəkildə qorunmaqla. Öz təkrar sınağını gözləmədən yüksələn güc, kimin mövqedə qalmaq niyyətində olduğu barədə az şey deyir.
Aşağıda 0.013549 eyni iddianın daha dərin variantı deyil, ayrıca bir həddir. Bu səviyyənin itirilməsi sadəcə bir geri çəkilmənin uğursuzluğu olmazdı; konstruktiv yanaşmanın əsaslandığı daha yüksək zirvə və daha yüksək dib ardıcıllığını pozardı. Bu səviyyənin üzərində qalmaq özlüyündə heç nəyi sübut etmir — sağ qalmaq sağlam olmaq demək deyil, reaksiya səviyyəsindən aşağı enmək isə həlledici zərbə deyil. Bu iki fikir ayrı saxlanmalıdır.
Эср балансы деривативlər tərəfindədir: açıq mövqelər və cari maliyyələşdirmə göstəricisi. Bunların heç biri spot bazar strukturu və həcm kimi gücü təsdiqləmir. Mövqe tutma ilə bağlı ehtiyatlı yanaşma tələb edən konstruktiv mənzərə və orta qeyri-müəyyənlik.
#Crypto #QrafikTəhlili
İlk təkrar sınaq 0.014082 səviyyəsindədir. Onun rolu qəsdən məhdud tutulub: ya satıcılar burada qarşılanıb udulur və qiymət yenidən bu səviyyənin üzərində bağlanır, ya da şamın fitili səviyyəni keçir və qiymət sürüşməyə başlayır. Bu səviyyəyə çatanda vəziyyəti oxumaq üçün ən güclü vasitələr qiymət strukturu və həcmdir; ondan əvvəl heç nə məsələni aydınlaşdırmır.
Yalnız həmin səviyyədə həqiqi müdafiə gördükdən sonra növbəti izləniləcək səviyyə kimi 0.014898 diqqətə layiq olur — ardıcıllıq ciddi şəkildə qorunmaqla. Öz təkrar sınağını gözləmədən yüksələn güc, kimin mövqedə qalmaq niyyətində olduğu barədə az şey deyir.
Aşağıda 0.013549 eyni iddianın daha dərin variantı deyil, ayrıca bir həddir. Bu səviyyənin itirilməsi sadəcə bir geri çəkilmənin uğursuzluğu olmazdı; konstruktiv yanaşmanın əsaslandığı daha yüksək zirvə və daha yüksək dib ardıcıllığını pozardı. Bu səviyyənin üzərində qalmaq özlüyündə heç nəyi sübut etmir — sağ qalmaq sağlam olmaq demək deyil, reaksiya səviyyəsindən aşağı enmək isə həlledici zərbə deyil. Bu iki fikir ayrı saxlanmalıdır.
Эср балансы деривативlər tərəfindədir: açıq mövqelər və cari maliyyələşdirmə göstəricisi. Bunların heç biri spot bazar strukturu və həcm kimi gücü təsdiqləmir. Mövqe tutma ilə bağlı ehtiyatlı yanaşma tələb edən konstruktiv mənzərə və orta qeyri-müəyyənlik.
#Crypto #QrafikTəhlili
162
·
--
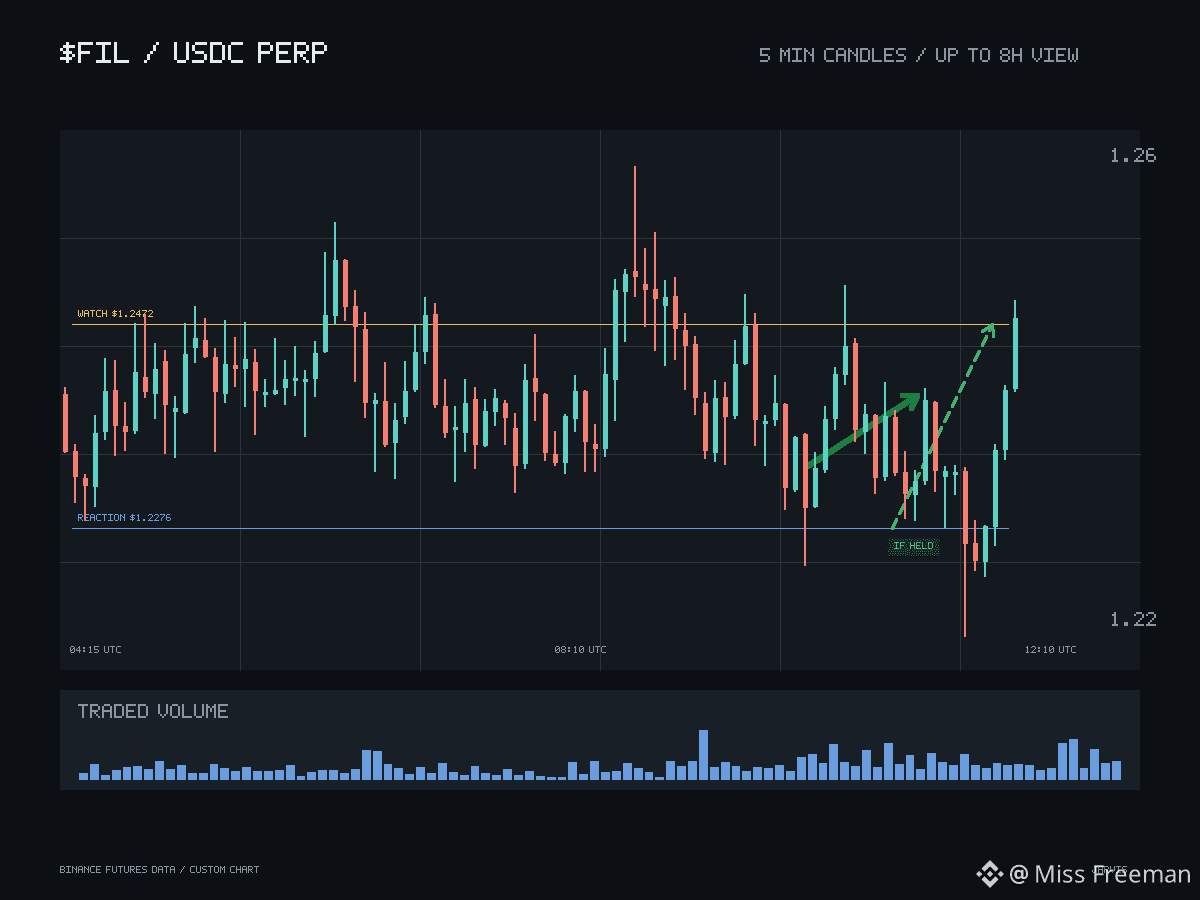
$FIL 1.2276 səviyyəsinə yaxındır və bu hərəkət hərəsi fərqli funksiyanı yerinə yetirən üç səviyyə formalaşdırıb. Onların heç biri digərini əvəz edə bilməz.
Birinci funksiya 1.2276 səviyyəsinə aiddir. Bu, lokal reaksiya səviyyəsidir və rolu məhduddur: ilk təkrar testdə bazar toxunuşu ya müdafiə olunan reaksiyaya çevirir — satıcıların təzyiqi qarşılanır, qiymət yenidən bu səviyyənin üzərində bağlanır — ya da səviyyəni fitillə keçib aşağı doğru sürüşür. Qiymət strukturu və həcm bu səviyyəyə çatdıqdan sonra vəziyyəti qiymətləndirmək üçün ən güclü alətlərdir; toxunma anındakı taker axınına da diqqət yetirmək lazımdır. Əvvəlcədən heç nə qəti nəticə vermir. Yalnız bu səviyyədə həqiqi müdafiə gördükdən sonra növbəti izləniləcək səviyyə kimi 1.2472 əhəmiyyət qazanır — ardıcıllığı qorumaq şərtilə: səviyyənin öz təkrar testini ötürən güc, kimin mövqedə qalmaq niyyətində olduğunu az göstərir.
1.2083-də isə iddianın başqa növü dayanır. Bu səviyyənin itirilməsi təkcə bir geriçəkilmənin uğursuzluğu olmazdı; konstruktiv ssenarinin əsaslandığı strukturu ləğv edərdi. Eyni məntiqlə, onun üzərində qalmaq da özlüyündə heç nəyi sübut etmir. Reaksiya səviyyəsinin aşağı qırılması ölümcül deyil, invalidasiya səviyyəsinin üzərində qalmaq isə sağlamlıq göstəricisi deyil — bu iki fikir bir-birindən ayrı tutulmalıdır.
Əks göstəricilər derivativlər tərəfindədir: açıq maraq və cari funding göstəricisi. Bunların heç biri spot bazarının strukturu və həcminin etdiyi kimi gücü təsdiqləmir. Mənzərə konstruktivdir, amma mövqelənmə ilə bağlı ehtiyatlı olmaq lazımdır.
#Crypto #QrafikTəhlili
$FIL 1.2276 səviyyəsinə yaxındır və bu hərəkət hərəsi fərqli funksiyanı yerinə yetirən üç səviyyə formalaşdırıb. Onların heç biri digərini əvəz edə bilməz.
Birinci funksiya 1.2276 səviyyəsinə aiddir. Bu, lokal reaksiya səviyyəsidir və rolu məhduddur: ilk təkrar testdə bazar toxunuşu ya müdafiə olunan reaksiyaya çevirir — satıcıların təzyiqi qarşılanır, qiymət yenidən bu səviyyənin üzərində bağlanır — ya da səviyyəni fitillə keçib aşağı doğru sürüşür. Qiymət strukturu və həcm bu səviyyəyə çatdıqdan sonra vəziyyəti qiymətləndirmək üçün ən güclü alətlərdir; toxunma anındakı taker axınına da diqqət yetirmək lazımdır. Əvvəlcədən heç nə qəti nəticə vermir. Yalnız bu səviyyədə həqiqi müdafiə gördükdən sonra növbəti izləniləcək səviyyə kimi 1.2472 əhəmiyyət qazanır — ardıcıllığı qorumaq şərtilə: səviyyənin öz təkrar testini ötürən güc, kimin mövqedə qalmaq niyyətində olduğunu az göstərir.
1.2083-də isə iddianın başqa növü dayanır. Bu səviyyənin itirilməsi təkcə bir geriçəkilmənin uğursuzluğu olmazdı; konstruktiv ssenarinin əsaslandığı strukturu ləğv edərdi. Eyni məntiqlə, onun üzərində qalmaq da özlüyündə heç nəyi sübut etmir. Reaksiya səviyyəsinin aşağı qırılması ölümcül deyil, invalidasiya səviyyəsinin üzərində qalmaq isə sağlamlıq göstəricisi deyil — bu iki fikir bir-birindən ayrı tutulmalıdır.
Əks göstəricilər derivativlər tərəfindədir: açıq maraq və cari funding göstəricisi. Bunların heç biri spot bazarının strukturu və həcminin etdiyi kimi gücü təsdiqləmir. Mənzərə konstruktivdir, amma mövqelənmə ilə bağlı ehtiyatlı olmaq lazımdır.
#Crypto #QrafikTəhlili
Birinci funksiya 1.2276 səviyyəsinə aiddir. Bu, lokal reaksiya səviyyəsidir və rolu məhduddur: ilk təkrar testdə bazar toxunuşu ya müdafiə olunan reaksiyaya çevirir — satıcıların təzyiqi qarşılanır, qiymət yenidən bu səviyyənin üzərində bağlanır — ya da səviyyəni fitillə keçib aşağı doğru sürüşür. Qiymət strukturu və həcm bu səviyyəyə çatdıqdan sonra vəziyyəti qiymətləndirmək üçün ən güclü alətlərdir; toxunma anındakı taker axınına da diqqət yetirmək lazımdır. Əvvəlcədən heç nə qəti nəticə vermir. Yalnız bu səviyyədə həqiqi müdafiə gördükdən sonra növbəti izləniləcək səviyyə kimi 1.2472 əhəmiyyət qazanır — ardıcıllığı qorumaq şərtilə: səviyyənin öz təkrar testini ötürən güc, kimin mövqedə qalmaq niyyətində olduğunu az göstərir.
1.2083-də isə iddianın başqa növü dayanır. Bu səviyyənin itirilməsi təkcə bir geriçəkilmənin uğursuzluğu olmazdı; konstruktiv ssenarinin əsaslandığı strukturu ləğv edərdi. Eyni məntiqlə, onun üzərində qalmaq da özlüyündə heç nəyi sübut etmir. Reaksiya səviyyəsinin aşağı qırılması ölümcül deyil, invalidasiya səviyyəsinin üzərində qalmaq isə sağlamlıq göstəricisi deyil — bu iki fikir bir-birindən ayrı tutulmalıdır.
Əks göstəricilər derivativlər tərəfindədir: açıq maraq və cari funding göstəricisi. Bunların heç biri spot bazarının strukturu və həcminin etdiyi kimi gücü təsdiqləmir. Mənzərə konstruktivdir, amma mövqelənmə ilə bağlı ehtiyatlı olmaq lazımdır.
#Crypto #QrafikTəhlili
1
322
·
--
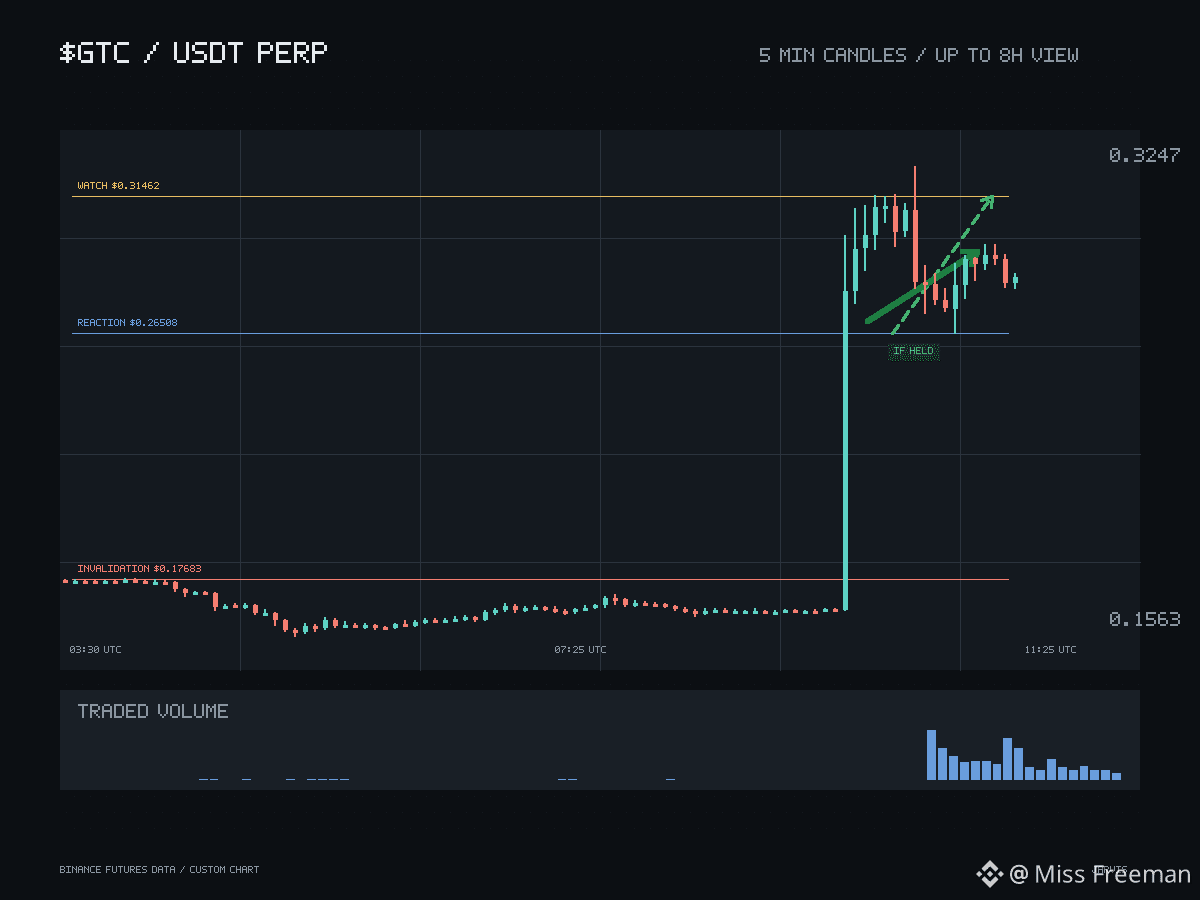
$GTC Az öncə qrafikdə görünən hərəkətin böyük hissəsi tələsik formalaşıb. Bu qədər sürətli yüksəliş qiymətin məsafə qət edə bildiyini göstərir, amma onun altında qalan səviyyələrdən hansında həqiqətən alqı-satqı razılaşmasının əldə olunduğu barədə demək olar ki, heç nə demir. Məhz bu asimmetriya ilk geriçəkilməni yüksəlişin özündən daha informativ edir.
Bu sualın ilk dəfə gündəmə gəldiyi səviyyə 0.26508-dir. Bu səviyyənin rolu məhduddur: ilk dəfə yenidən sınaqdan keçiriləndə ya satıcıların təzyiqi qarşılanar və qiymət səviyyənin üzərində bağlanar, ya da qiymət fitillə səviyyəni keçib aşağı doğru sürüşər. Bu baş verdikdən sonra bunu qiymət strukturu və həcm ən yaxşı şəkildə göstərir; təmas anındakı taker axınına da diqqət yetirməyə dəyər. Əvvəlcədən heç nə bunu qəti müəyyən etmir.
Yalnız orada həqiqi müdafiə gördükdən sonra 0.31462 növbəti izlənəcək səviyyə kimi əhəmiyyət qazanır — ardıcıllığa ciddi əməl etməklə. Öz səviyyəsini yenidən sınaqdan keçirmədən göstərilən güc kimin bazarda qalmaq niyyətində olduğu barədə az şey deyir.
0.17683 isə tamam başqa məna daşıyır. Bu səviyyənin itirilməsi təkcə bir geriçəkilmənin uğursuzluğu olmaz — konstruktiv ssenarinin əsaslandığı daha yüksək zirvə və daha yüksək dib davranışını etibarsız edər. Eyni məntiqlə, bu səviyyənin üzərində qalmaq da özlüyündə heç nəyi sübut etmir. Reaksiya səviyyəsinin altına qısa eniş ölümcül deyil, etibarsızlaşma səviyyəsinin üzərində qalmaq isə sağlamlıq demək deyil; bu iki fikir ayrı tutulmalıdır.
Əks siqnallar törəmə alətlər tərəfindədir. Açıq mövqelər və cari funding göstəricisi spot bazar strukturu və həcm kimi gücü təsdiqləməyib. Mənzərə konstruktivdir, amma mövqelənmə ilə bağlı ehtiyatlı olmaq lazımdır.
#Crypto #QrafikTəhlili
$GTC Az öncə qrafikdə görünən hərəkətin böyük hissəsi tələsik formalaşıb. Bu qədər sürətli yüksəliş qiymətin məsafə qət edə bildiyini göstərir, amma onun altında qalan səviyyələrdən hansında həqiqətən alqı-satqı razılaşmasının əldə olunduğu barədə demək olar ki, heç nə demir. Məhz bu asimmetriya ilk geriçəkilməni yüksəlişin özündən daha informativ edir.
Bu sualın ilk dəfə gündəmə gəldiyi səviyyə 0.26508-dir. Bu səviyyənin rolu məhduddur: ilk dəfə yenidən sınaqdan keçiriləndə ya satıcıların təzyiqi qarşılanar və qiymət səviyyənin üzərində bağlanar, ya da qiymət fitillə səviyyəni keçib aşağı doğru sürüşər. Bu baş verdikdən sonra bunu qiymət strukturu və həcm ən yaxşı şəkildə göstərir; təmas anındakı taker axınına da diqqət yetirməyə dəyər. Əvvəlcədən heç nə bunu qəti müəyyən etmir.
Yalnız orada həqiqi müdafiə gördükdən sonra 0.31462 növbəti izlənəcək səviyyə kimi əhəmiyyət qazanır — ardıcıllığa ciddi əməl etməklə. Öz səviyyəsini yenidən sınaqdan keçirmədən göstərilən güc kimin bazarda qalmaq niyyətində olduğu barədə az şey deyir.
0.17683 isə tamam başqa məna daşıyır. Bu səviyyənin itirilməsi təkcə bir geriçəkilmənin uğursuzluğu olmaz — konstruktiv ssenarinin əsaslandığı daha yüksək zirvə və daha yüksək dib davranışını etibarsız edər. Eyni məntiqlə, bu səviyyənin üzərində qalmaq da özlüyündə heç nəyi sübut etmir. Reaksiya səviyyəsinin altına qısa eniş ölümcül deyil, etibarsızlaşma səviyyəsinin üzərində qalmaq isə sağlamlıq demək deyil; bu iki fikir ayrı tutulmalıdır.
Əks siqnallar törəmə alətlər tərəfindədir. Açıq mövqelər və cari funding göstəricisi spot bazar strukturu və həcm kimi gücü təsdiqləməyib. Mənzərə konstruktivdir, amma mövqelənmə ilə bağlı ehtiyatlı olmaq lazımdır.
#Crypto #QrafikTəhlili
Bu sualın ilk dəfə gündəmə gəldiyi səviyyə 0.26508-dir. Bu səviyyənin rolu məhduddur: ilk dəfə yenidən sınaqdan keçiriləndə ya satıcıların təzyiqi qarşılanar və qiymət səviyyənin üzərində bağlanar, ya da qiymət fitillə səviyyəni keçib aşağı doğru sürüşər. Bu baş verdikdən sonra bunu qiymət strukturu və həcm ən yaxşı şəkildə göstərir; təmas anındakı taker axınına da diqqət yetirməyə dəyər. Əvvəlcədən heç nə bunu qəti müəyyən etmir.
Yalnız orada həqiqi müdafiə gördükdən sonra 0.31462 növbəti izlənəcək səviyyə kimi əhəmiyyət qazanır — ardıcıllığa ciddi əməl etməklə. Öz səviyyəsini yenidən sınaqdan keçirmədən göstərilən güc kimin bazarda qalmaq niyyətində olduğu barədə az şey deyir.
0.17683 isə tamam başqa məna daşıyır. Bu səviyyənin itirilməsi təkcə bir geriçəkilmənin uğursuzluğu olmaz — konstruktiv ssenarinin əsaslandığı daha yüksək zirvə və daha yüksək dib davranışını etibarsız edər. Eyni məntiqlə, bu səviyyənin üzərində qalmaq da özlüyündə heç nəyi sübut etmir. Reaksiya səviyyəsinin altına qısa eniş ölümcül deyil, etibarsızlaşma səviyyəsinin üzərində qalmaq isə sağlamlıq demək deyil; bu iki fikir ayrı tutulmalıdır.
Əks siqnallar törəmə alətlər tərəfindədir. Açıq mövqelər və cari funding göstəricisi spot bazar strukturu və həcm kimi gücü təsdiqləməyib. Mənzərə konstruktivdir, amma mövqelənmə ilə bağlı ehtiyatlı olmaq lazımdır.
#Crypto #QrafikTəhlili
236

·
--
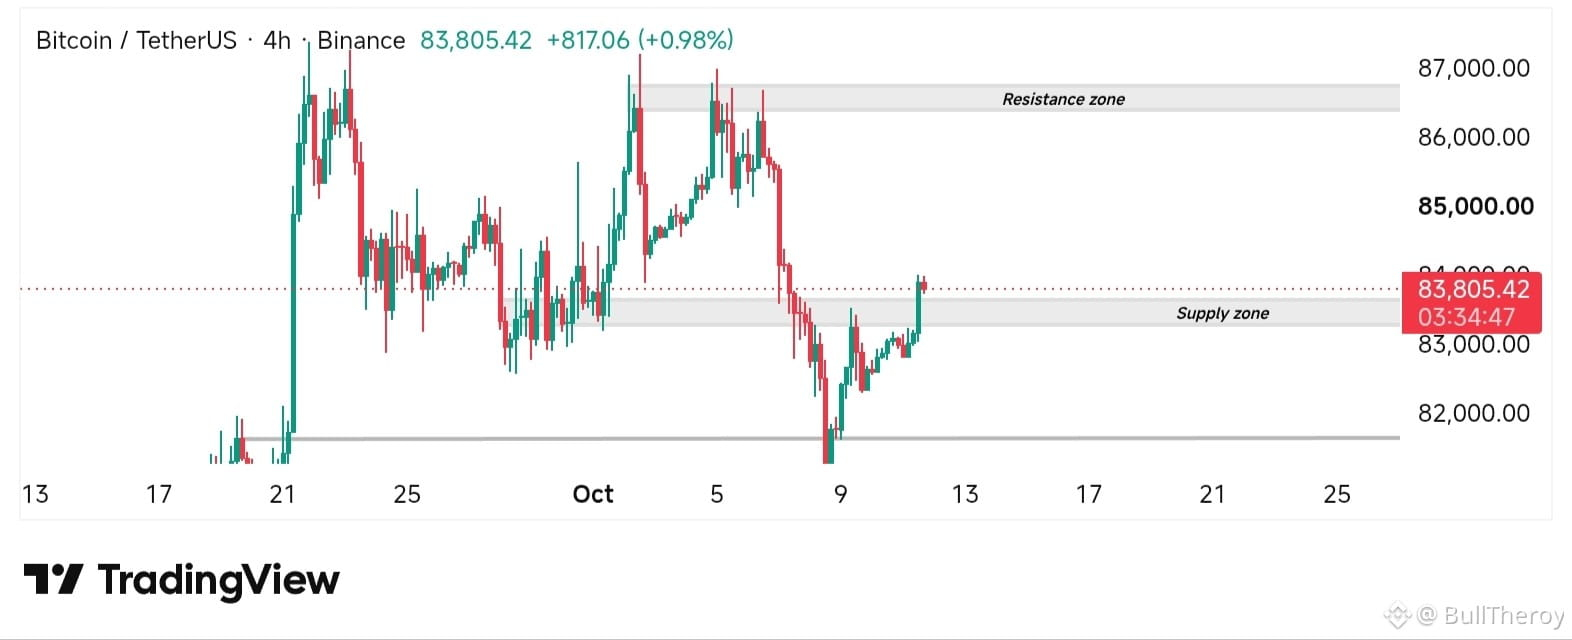
📊 Bitcoin 4H Yeniləmə: Diqqət Yetirilməli Əsas Səviyyə!
Bitcoin hazırda təxminən $83,805 səviyyəsində ticarət olunur və $81,500–$82,000 dəstək zonasından geri sıçrayıb.
🔹 Müqavimət: $83,300–$83,700
🔹 Əsas Müqavimət: $86,400–$86,800
🔹 Dəstək: $81,500–$82,000
👀 Növbəti Nədir?
BTC $83,300–$83,700 zonasını sınaqdan keçirir və burada satış təzyiqi yarana bilər.
Əgər qiymət bu zonanın üzərində qırılma edib orada qala bilsə, daha da yüksəliş görə bilərik. Amma BTC rədd olunarsa, daha aşağı dəstək səviyyələrinə geri çəkilə bilər.
Mənim diqqətim: kor-koranə daxil olmaq əvəzinə təsdiq üçün 4 saatlıq şamın bağlanmasını izləməkdir.
⚠️ Hələ təsdiqlənmiş qırılma yoxdur. Səbirli olun və riskinizi idarə edin.
$BTC
#btcupdate #chartanalysis
📊 Bitcoin 4H Yeniləmə: Diqqət Yetirilməli Əsas Səviyyə!
Bitcoin hazırda təxminən $83,805 səviyyəsində ticarət olunur və $81,500–$82,000 dəstək zonasından geri sıçrayıb.
🔹 Müqavimət: $83,300–$83,700
🔹 Əsas Müqavimət: $86,400–$86,800
🔹 Dəstək: $81,500–$82,000
👀 Növbəti Nədir?
BTC $83,300–$83,700 zonasını sınaqdan keçirir və burada satış təzyiqi yarana bilər.
Əgər qiymət bu zonanın üzərində qırılma edib orada qala bilsə, daha da yüksəliş görə bilərik. Amma BTC rədd olunarsa, daha aşağı dəstək səviyyələrinə geri çəkilə bilər.
Mənim diqqətim: kor-koranə daxil olmaq əvəzinə təsdiq üçün 4 saatlıq şamın bağlanmasını izləməkdir.
⚠️ Hələ təsdiqlənmiş qırılma yoxdur. Səbirli olun və riskinizi idarə edin.
$BTC
#btcupdate #chartanalysis
Bitcoin hazırda təxminən $83,805 səviyyəsində ticarət olunur və $81,500–$82,000 dəstək zonasından geri sıçrayıb.
🔹 Müqavimət: $83,300–$83,700
🔹 Əsas Müqavimət: $86,400–$86,800
🔹 Dəstək: $81,500–$82,000
👀 Növbəti Nədir?
BTC $83,300–$83,700 zonasını sınaqdan keçirir və burada satış təzyiqi yarana bilər.
Əgər qiymət bu zonanın üzərində qırılma edib orada qala bilsə, daha da yüksəliş görə bilərik. Amma BTC rədd olunarsa, daha aşağı dəstək səviyyələrinə geri çəkilə bilər.
Mənim diqqətim: kor-koranə daxil olmaq əvəzinə təsdiq üçün 4 saatlıq şamın bağlanmasını izləməkdir.
⚠️ Hələ təsdiqlənmiş qırılma yoxdur. Səbirli olun və riskinizi idarə edin.
$BTC
#btcupdate #chartanalysis
58
·
--
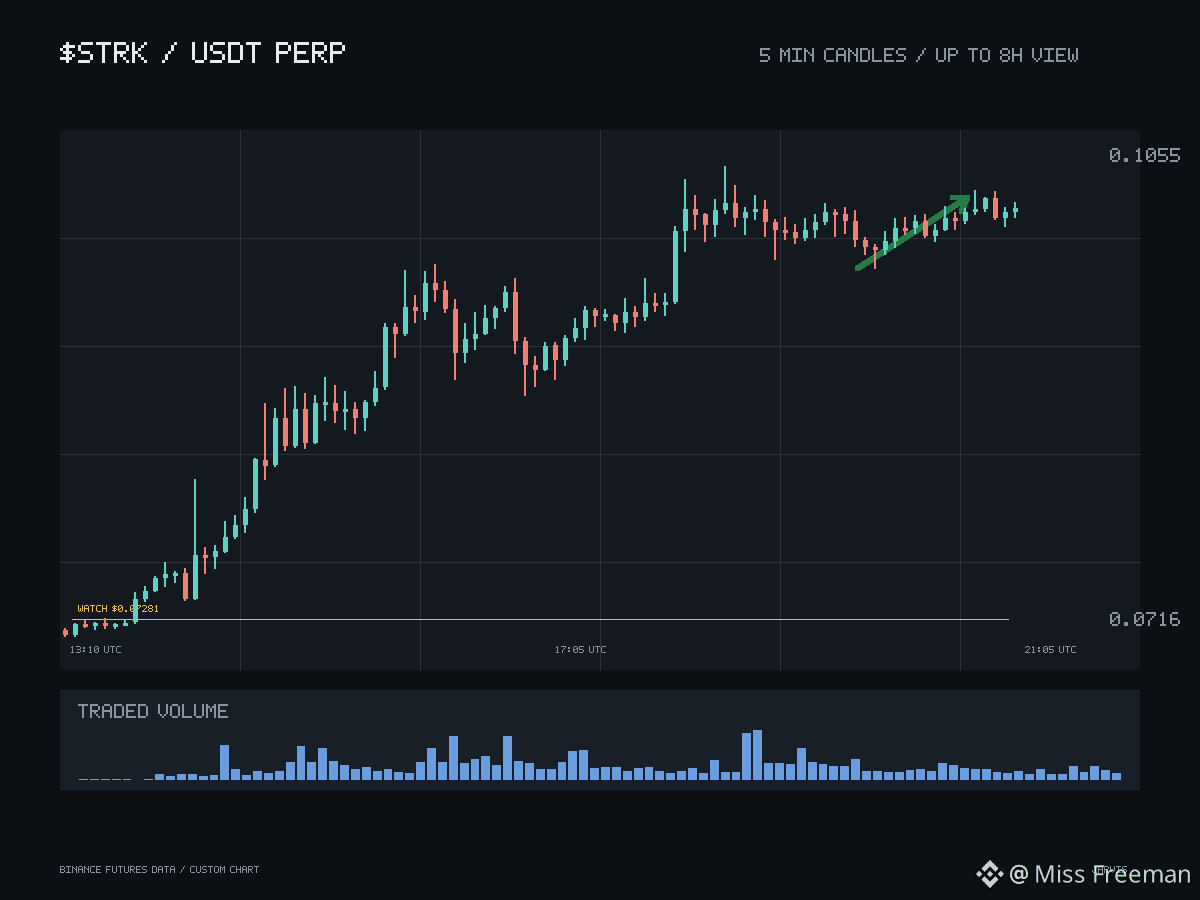
$STRK kəskin hərəkət edib və bu ölçüdə hərəkət konkret problem yaradır: cari qiymətin altındakı qrafikin böyük hissəsi tələsik formalaşıb. Şaquli sıçrayış boyunca çəkilmiş səviyyələr qiymətin üzərindən yavaş-yavaş keçdiyi səviyyələrdən daha az məlumat verir. Buna görə də burada ilk geri çəkilmə rallinin özündən daha vacibdir.
Geri çəkilmənin ilk sınaq səviyyəsi 0.07079-dur. Burada məsələ konkretdir: səviyyə yenidən sınaqdan keçiriləndə ya satış təzyiqi udulur və qiymət yenidən bu səviyyədən yuxarıda bağlanır, ya da şamın fitili səviyyəni keçir və qiymət sürüşərək uzaqlaşır. Bu baş verəndə vəziyyəti anlamaq üçün ən güclü dəlillər qiymət strukturu və həcmdir; əvvəlcədən heç nə bunu qəti müəyyən etmir. Yalnız həqiqi müdafiədən sonra 0.07281 növbəti izləniləcək səviyyə kimi diqqətə layiq olur — ardıcıllığa ciddi əməl etməklə. Öz səviyyəsini yenidən sınaqdan keçirmədən göstərilən güc, kimin qalmaq niyyətində olduğu barədə çox az şey deyir.
Daha aşağıda 0.06767 ayrıca bir məsələdir. Bu səviyyənin itirilməsi təkcə bir geri çəkilmənin uğursuzluğu deyil — konstruktiv ssenarinin əsaslandığı daha yüksək zirvə və daha yüksək dib ardıcıllığını ləğv edir. Bunun üzərində qalmaq da öz-özlüyündə heç nə sübut etmir; sağ qalmaq sağlam olmaq demək deyil və bu iki fikir ayrı tutulmalıdır.
Əks göstəricilər törəmə alətlər tərəfindəndir: açıq mövqelərin həcmi və hazırkı maliyyələşdirmə göstəricisi. Bunların heç biri spot bazardakı struktur və həcm kimi gücü təsdiqləmir. Mənzərə konstruktivdir, lakin mövqeləşmə ilə bağlı ehtiyatlı olmaq lazımdır.
#Crypto #QrafikTəhlili
$STRK kəskin hərəkət edib və bu ölçüdə hərəkət konkret problem yaradır: cari qiymətin altındakı qrafikin böyük hissəsi tələsik formalaşıb. Şaquli sıçrayış boyunca çəkilmiş səviyyələr qiymətin üzərindən yavaş-yavaş keçdiyi səviyyələrdən daha az məlumat verir. Buna görə də burada ilk geri çəkilmə rallinin özündən daha vacibdir.
Geri çəkilmənin ilk sınaq səviyyəsi 0.07079-dur. Burada məsələ konkretdir: səviyyə yenidən sınaqdan keçiriləndə ya satış təzyiqi udulur və qiymət yenidən bu səviyyədən yuxarıda bağlanır, ya da şamın fitili səviyyəni keçir və qiymət sürüşərək uzaqlaşır. Bu baş verəndə vəziyyəti anlamaq üçün ən güclü dəlillər qiymət strukturu və həcmdir; əvvəlcədən heç nə bunu qəti müəyyən etmir. Yalnız həqiqi müdafiədən sonra 0.07281 növbəti izləniləcək səviyyə kimi diqqətə layiq olur — ardıcıllığa ciddi əməl etməklə. Öz səviyyəsini yenidən sınaqdan keçirmədən göstərilən güc, kimin qalmaq niyyətində olduğu barədə çox az şey deyir.
Daha aşağıda 0.06767 ayrıca bir məsələdir. Bu səviyyənin itirilməsi təkcə bir geri çəkilmənin uğursuzluğu deyil — konstruktiv ssenarinin əsaslandığı daha yüksək zirvə və daha yüksək dib ardıcıllığını ləğv edir. Bunun üzərində qalmaq da öz-özlüyündə heç nə sübut etmir; sağ qalmaq sağlam olmaq demək deyil və bu iki fikir ayrı tutulmalıdır.
Əks göstəricilər törəmə alətlər tərəfindəndir: açıq mövqelərin həcmi və hazırkı maliyyələşdirmə göstəricisi. Bunların heç biri spot bazardakı struktur və həcm kimi gücü təsdiqləmir. Mənzərə konstruktivdir, lakin mövqeləşmə ilə bağlı ehtiyatlı olmaq lazımdır.
#Crypto #QrafikTəhlili
Geri çəkilmənin ilk sınaq səviyyəsi 0.07079-dur. Burada məsələ konkretdir: səviyyə yenidən sınaqdan keçiriləndə ya satış təzyiqi udulur və qiymət yenidən bu səviyyədən yuxarıda bağlanır, ya da şamın fitili səviyyəni keçir və qiymət sürüşərək uzaqlaşır. Bu baş verəndə vəziyyəti anlamaq üçün ən güclü dəlillər qiymət strukturu və həcmdir; əvvəlcədən heç nə bunu qəti müəyyən etmir. Yalnız həqiqi müdafiədən sonra 0.07281 növbəti izləniləcək səviyyə kimi diqqətə layiq olur — ardıcıllığa ciddi əməl etməklə. Öz səviyyəsini yenidən sınaqdan keçirmədən göstərilən güc, kimin qalmaq niyyətində olduğu barədə çox az şey deyir.
Daha aşağıda 0.06767 ayrıca bir məsələdir. Bu səviyyənin itirilməsi təkcə bir geri çəkilmənin uğursuzluğu deyil — konstruktiv ssenarinin əsaslandığı daha yüksək zirvə və daha yüksək dib ardıcıllığını ləğv edir. Bunun üzərində qalmaq da öz-özlüyündə heç nə sübut etmir; sağ qalmaq sağlam olmaq demək deyil və bu iki fikir ayrı tutulmalıdır.
Əks göstəricilər törəmə alətlər tərəfindəndir: açıq mövqelərin həcmi və hazırkı maliyyələşdirmə göstəricisi. Bunların heç biri spot bazardakı struktur və həcm kimi gücü təsdiqləmir. Mənzərə konstruktivdir, lakin mövqeləşmə ilə bağlı ehtiyatlı olmaq lazımdır.
#Crypto #QrafikTəhlili
1
543
·
--
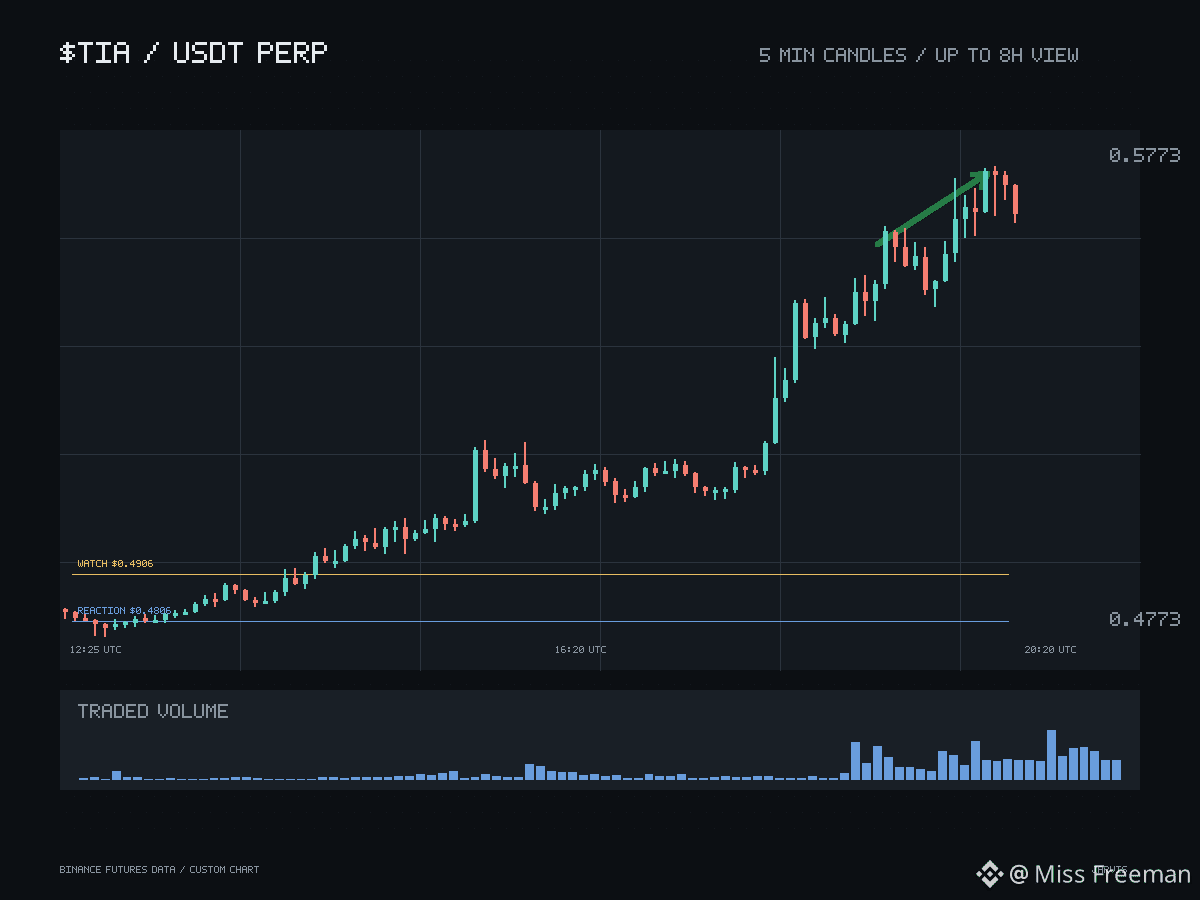
$TIA bunu hökm kimi deyil, iddialar iyerarxiyası kimi təşkil etmək daha yaxşıdır. Üç səviyyə, üç ayrı funksiya və heç biri digərinin işini görmür.
Ən geniş iddia olan 0.4396-dan başlayaq. Bu, strukturun etibarsız sayılması səviyyəsidir — bu səviyyənin itirilməsi təkcə bir enişi uğursuz etmir, konstruktiv şərhin əsaslandığı daha yüksək zirvə və daha yüksək dib davranışını da aradan qaldırır. Amma əksini də aydın demək lazımdır: bu səviyyədən yuxarıda qalmaq sağlamlıq göstəricisi deyil. Sadəcə, sualın hələ açıq qaldığını bildirir.
Daha dar iddia 0.4806 səviyyəsindədir. Bu, lokal reaksiya səviyyəsidir və yeganə funksiyası ilk təkrar testdir — satıcıların qiymət yenidən bu səviyyədən yuxarıda bağlanarkən udulub-udulmayacağı, yoxsa qiymətin bu səviyyəni kölgə ilə keçib sürüşəcəyi. Bunu qiymətləndirmək üçün qiymət strukturu və həcm ən güclü vasitələrdir; toxunma anındakı taker axını da əlavə məlumat verir, amma test baş tutmamış bunların heç biri suala cavab vermir.
Yalnız həqiqi müdafiədən sonra 0.4906 növbəti izləniləcək səviyyə kimi diqqətə layiq olur — ardıcıllıq ciddi şəkildə qorunmaqla.
Tarazlaşdırıcı amillər derivativlər tərəfindədir: açıq faiz və cari maliyyələşdirmə göstəricisi. Bunların heç biri spot strukturunun verdiyi kimi gücü təsdiqləmir. Konstruktiv mənzərə var, amma mövqelənmə ilə bağlı ehtiyatlı olmaq lazımdır.
#Crypto #QrafikTəhlili
$TIA bunu hökm kimi deyil, iddialar iyerarxiyası kimi təşkil etmək daha yaxşıdır. Üç səviyyə, üç ayrı funksiya və heç biri digərinin işini görmür.
Ən geniş iddia olan 0.4396-dan başlayaq. Bu, strukturun etibarsız sayılması səviyyəsidir — bu səviyyənin itirilməsi təkcə bir enişi uğursuz etmir, konstruktiv şərhin əsaslandığı daha yüksək zirvə və daha yüksək dib davranışını da aradan qaldırır. Amma əksini də aydın demək lazımdır: bu səviyyədən yuxarıda qalmaq sağlamlıq göstəricisi deyil. Sadəcə, sualın hələ açıq qaldığını bildirir.
Daha dar iddia 0.4806 səviyyəsindədir. Bu, lokal reaksiya səviyyəsidir və yeganə funksiyası ilk təkrar testdir — satıcıların qiymət yenidən bu səviyyədən yuxarıda bağlanarkən udulub-udulmayacağı, yoxsa qiymətin bu səviyyəni kölgə ilə keçib sürüşəcəyi. Bunu qiymətləndirmək üçün qiymət strukturu və həcm ən güclü vasitələrdir; toxunma anındakı taker axını da əlavə məlumat verir, amma test baş tutmamış bunların heç biri suala cavab vermir.
Yalnız həqiqi müdafiədən sonra 0.4906 növbəti izləniləcək səviyyə kimi diqqətə layiq olur — ardıcıllıq ciddi şəkildə qorunmaqla.
Tarazlaşdırıcı amillər derivativlər tərəfindədir: açıq faiz və cari maliyyələşdirmə göstəricisi. Bunların heç biri spot strukturunun verdiyi kimi gücü təsdiqləmir. Konstruktiv mənzərə var, amma mövqelənmə ilə bağlı ehtiyatlı olmaq lazımdır.
#Crypto #QrafikTəhlili
Ən geniş iddia olan 0.4396-dan başlayaq. Bu, strukturun etibarsız sayılması səviyyəsidir — bu səviyyənin itirilməsi təkcə bir enişi uğursuz etmir, konstruktiv şərhin əsaslandığı daha yüksək zirvə və daha yüksək dib davranışını da aradan qaldırır. Amma əksini də aydın demək lazımdır: bu səviyyədən yuxarıda qalmaq sağlamlıq göstəricisi deyil. Sadəcə, sualın hələ açıq qaldığını bildirir.
Daha dar iddia 0.4806 səviyyəsindədir. Bu, lokal reaksiya səviyyəsidir və yeganə funksiyası ilk təkrar testdir — satıcıların qiymət yenidən bu səviyyədən yuxarıda bağlanarkən udulub-udulmayacağı, yoxsa qiymətin bu səviyyəni kölgə ilə keçib sürüşəcəyi. Bunu qiymətləndirmək üçün qiymət strukturu və həcm ən güclü vasitələrdir; toxunma anındakı taker axını da əlavə məlumat verir, amma test baş tutmamış bunların heç biri suala cavab vermir.
Yalnız həqiqi müdafiədən sonra 0.4906 növbəti izləniləcək səviyyə kimi diqqətə layiq olur — ardıcıllıq ciddi şəkildə qorunmaqla.
Tarazlaşdırıcı amillər derivativlər tərəfindədir: açıq faiz və cari maliyyələşdirmə göstəricisi. Bunların heç biri spot strukturunun verdiyi kimi gücü təsdiqləmir. Konstruktiv mənzərə var, amma mövqelənmə ilə bağlı ehtiyatlı olmaq lazımdır.
#Crypto #QrafikTəhlili
2
219
·
--
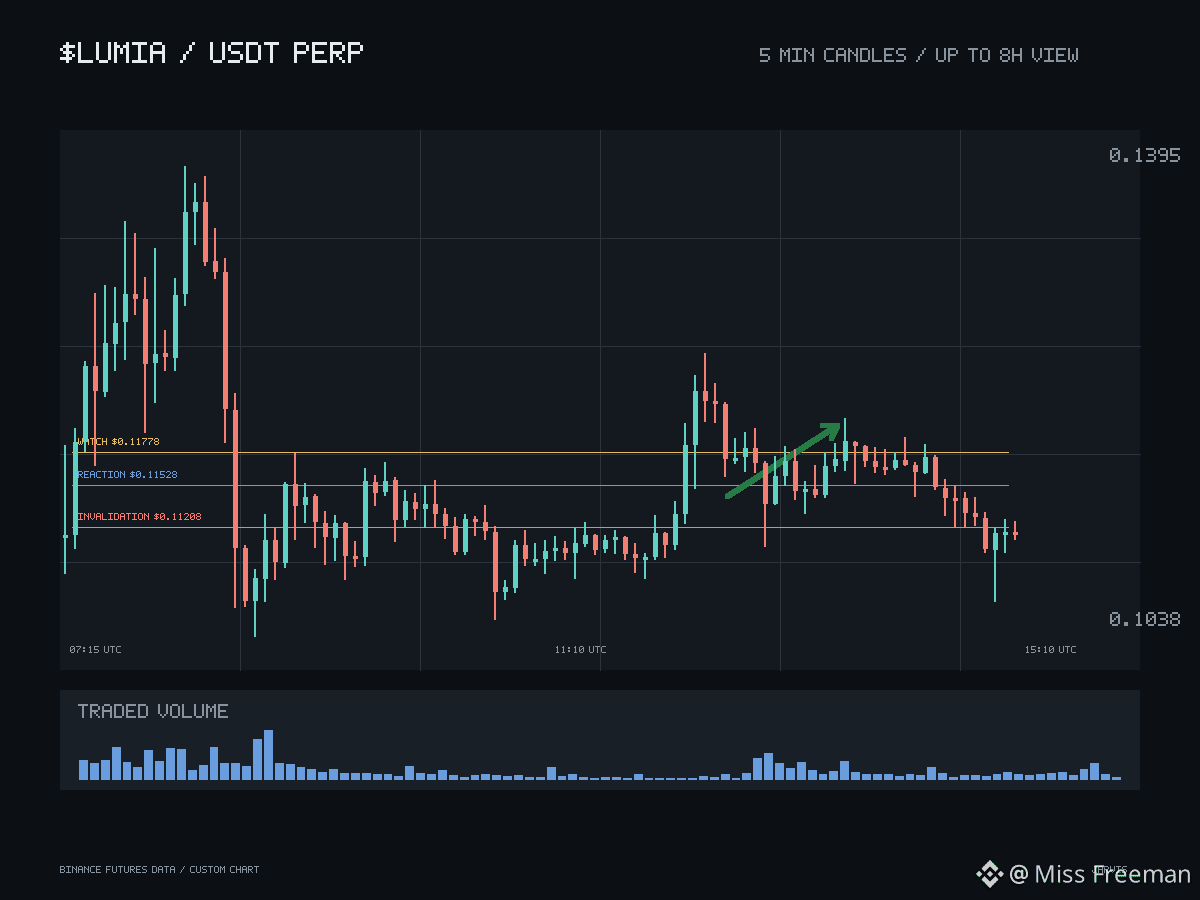
$LUMIA Hazırkı məqamın daha maraqlı tərəfi hərəkətin özü deyil — bu, sadəcə qiymətin məsafə qət edə bildiyini sübut edir. Əsas məsələ həmin yüksəlişin bir hissəsi ilk dəfə geri qaytarılanda nə baş verəcəyidir. Bu sual 0.11528 səviyyəsində ortaya çıxır. Bu, sadəcə yerli reaksiya səviyyəsidir, bundan artığı deyil: ilk təkrar sınaqda ya qiymət yenidən yuxarıda bağlanaraq satıcıların təzyiqini udacaq, ya da qiymət səviyyəni açıq şəkildə fitillə keçib aşağı doğru sürüşməyə başlayacaq. Bu nəticələrin heç birini əvvəlcədən bilmək mümkün deyil.
Bu sınaq baş verəndə onu qiymətləndirmək üçün ən güclü alətlər qiymət strukturu və həcmdir. Yalnız həqiqi müdafiə görünərsə, növbəti izləniləcək səviyyə kimi 0.11778-ə diqqət yetirməyə dəyər — ardıcıllığı ciddi qorumaq şərtilə: öz təkrar sınağını keçmədən yüksələn güc, kimin mövqedə qalmaq niyyətində olduğu barədə az şey deyir.
0.11208 isə tamam başqa səviyyədə işləyir. Bu səviyyənin itirilməsi təkcə bir korreksiyanın uğursuzluğu deyil; konstruktiv ssenarinin əsaslandığı daha yüksək zirvə və daha yüksək dib ardıcıllığını ləğv edir. Amma onun üzərində qalmaq da öz-özlüyündə heç nə sübut etmir. Reaksiya səviyyəsinin aşağısına enmək həlledici deyil, etibarsızlaşma səviyyəsinin üstündə qalmaq isə sağlam байдлыг göstərmir — эдгээр нь тус тусдаа ойлголт юм.
Үүнийг сааруулах хүчин зүйлс нь нээлттэй позицын хэмжээ болон одоогийн санхүүжилтийн үзүүлэлт бөгөөд эдгээрийн аль нь ч спот зах зээлийн бүтэц шиг хүчийг батлахгүй. Эерэг төлөвтэй ч позицтой холбоотойгоор болгоомжлох хэрэгтэй.
#Crypto #ГрафикийнШинжилгээ
$LUMIA Hazırkı məqamın daha maraqlı tərəfi hərəkətin özü deyil — bu, sadəcə qiymətin məsafə qət edə bildiyini sübut edir. Əsas məsələ həmin yüksəlişin bir hissəsi ilk dəfə geri qaytarılanda nə baş verəcəyidir. Bu sual 0.11528 səviyyəsində ortaya çıxır. Bu, sadəcə yerli reaksiya səviyyəsidir, bundan artığı deyil: ilk təkrar sınaqda ya qiymət yenidən yuxarıda bağlanaraq satıcıların təzyiqini udacaq, ya da qiymət səviyyəni açıq şəkildə fitillə keçib aşağı doğru sürüşməyə başlayacaq. Bu nəticələrin heç birini əvvəlcədən bilmək mümkün deyil.
Bu sınaq baş verəndə onu qiymətləndirmək üçün ən güclü alətlər qiymət strukturu və həcmdir. Yalnız həqiqi müdafiə görünərsə, növbəti izləniləcək səviyyə kimi 0.11778-ə diqqət yetirməyə dəyər — ardıcıllığı ciddi qorumaq şərtilə: öz təkrar sınağını keçmədən yüksələn güc, kimin mövqedə qalmaq niyyətində olduğu barədə az şey deyir.
0.11208 isə tamam başqa səviyyədə işləyir. Bu səviyyənin itirilməsi təkcə bir korreksiyanın uğursuzluğu deyil; konstruktiv ssenarinin əsaslandığı daha yüksək zirvə və daha yüksək dib ardıcıllığını ləğv edir. Amma onun üzərində qalmaq da öz-özlüyündə heç nə sübut etmir. Reaksiya səviyyəsinin aşağısına enmək həlledici deyil, etibarsızlaşma səviyyəsinin üstündə qalmaq isə sağlam байдлыг göstərmir — эдгээр нь тус тусдаа ойлголт юм.
Үүнийг сааруулах хүчин зүйлс нь нээлттэй позицын хэмжээ болон одоогийн санхүүжилтийн үзүүлэлт бөгөөд эдгээрийн аль нь ч спот зах зээлийн бүтэц шиг хүчийг батлахгүй. Эерэг төлөвтэй ч позицтой холбоотойгоор болгоомжлох хэрэгтэй.
#Crypto #ГрафикийнШинжилгээ
Bu sınaq baş verəndə onu qiymətləndirmək üçün ən güclü alətlər qiymət strukturu və həcmdir. Yalnız həqiqi müdafiə görünərsə, növbəti izləniləcək səviyyə kimi 0.11778-ə diqqət yetirməyə dəyər — ardıcıllığı ciddi qorumaq şərtilə: öz təkrar sınağını keçmədən yüksələn güc, kimin mövqedə qalmaq niyyətində olduğu barədə az şey deyir.
0.11208 isə tamam başqa səviyyədə işləyir. Bu səviyyənin itirilməsi təkcə bir korreksiyanın uğursuzluğu deyil; konstruktiv ssenarinin əsaslandığı daha yüksək zirvə və daha yüksək dib ardıcıllığını ləğv edir. Amma onun üzərində qalmaq da öz-özlüyündə heç nə sübut etmir. Reaksiya səviyyəsinin aşağısına enmək həlledici deyil, etibarsızlaşma səviyyəsinin üstündə qalmaq isə sağlam байдлыг göstərmir — эдгээр нь тус тусдаа ойлголт юм.
Үүнийг сааруулах хүчин зүйлс нь нээлттэй позицын хэмжээ болон одоогийн санхүүжилтийн үзүүлэлт бөгөөд эдгээрийн аль нь ч спот зах зээлийн бүтэц шиг хүчийг батлахгүй. Эерэг төлөвтэй ч позицтой холбоотойгоор болгоомжлох хэрэгтэй.
#Crypto #ГрафикийнШинжилгээ
149
·
--
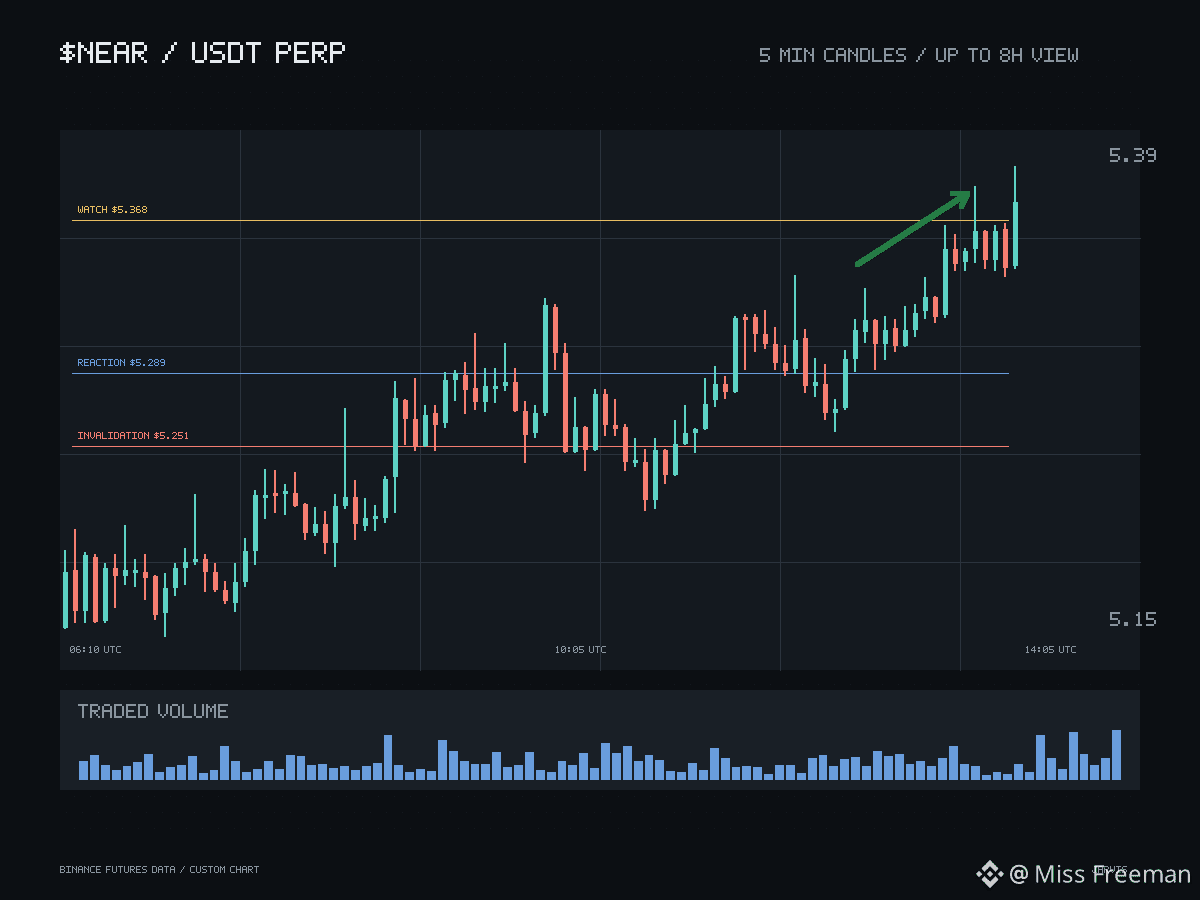
$NEAR son bir gündə yüksəlib və bu ölçüdə bir hərəkət yalnız asan suala cavab verir — qiymət hərəkət edə bilər. Açıq qalan sual isə daha yüksək zirvələr və daha yüksək diblər davranışının geri çəkilmə ilə qarşılaşdıqda davam edib-etməyəcəyidir.
Bu sınaq nöqtəsi 5.289-dur. Onun rolu məhduddur: ilk dəfə yenidən sınaqdan keçiriləndə qiymət ya bu toxunuşu müdafiə olunan reaksiyaya çevirir — satıcıların təklifi udulur, qiymət yenidən yuxarıda bağlanır — ya da səviyyənin altına iynə atıb aşağı sürüşür. Bunu qiymətləndirmək üçün ən güclü dəlillər qiymət strukturu və həcmdir; toxunuş zamanı taker axını da diqqətə layiqdir. Sınaq baş verməmiş bunların heç biri suala cavab vermir.
Bir səviyyə aşağıda, 5.251 tamam başqa iddiadır. Bu səviyyənin itirilməsi təkcə bir geri çəkilməni uğursuz etmir; konstruktiv ssenarinin söykəndiyi strukturu ləğv edir. Bunun üzərində qalmaq da öz-özlüyündə heç nəyi sübut etmir — sağ qalmaq sağlam olmaq demək deyil və bu fikirlər ayrı qalmalıdır.
Yalnız 5.289-da həqiqi müdafiə baş verdikdən sonra 5.368 ardıcıllıqla izlənəcək növbəti səviyyə kimi əhəmiyyət qazanır. Öz səviyyəsini yenidən sınaqdan keçirmədən yüksələn ralli kimin qalmaq niyyətində olduğu barədə az şey deyir.
Əks çəkilər törəmə alətlər tərəfindəndir: açıq mövqelər və cari maliyyələşdirmə göstəricisi. Bunların heç biri spot struktur və həcm kimi gücü təsdiqləmir. Ssenari konstruktivdir, lakin mövqelənmə ilə bağlı ehtiyatlı olmaq lazımdır.
#Crypto #QrafikTəhlili
$NEAR son bir gündə yüksəlib və bu ölçüdə bir hərəkət yalnız asan suala cavab verir — qiymət hərəkət edə bilər. Açıq qalan sual isə daha yüksək zirvələr və daha yüksək diblər davranışının geri çəkilmə ilə qarşılaşdıqda davam edib-etməyəcəyidir.
Bu sınaq nöqtəsi 5.289-dur. Onun rolu məhduddur: ilk dəfə yenidən sınaqdan keçiriləndə qiymət ya bu toxunuşu müdafiə olunan reaksiyaya çevirir — satıcıların təklifi udulur, qiymət yenidən yuxarıda bağlanır — ya da səviyyənin altına iynə atıb aşağı sürüşür. Bunu qiymətləndirmək üçün ən güclü dəlillər qiymət strukturu və həcmdir; toxunuş zamanı taker axını da diqqətə layiqdir. Sınaq baş verməmiş bunların heç biri suala cavab vermir.
Bir səviyyə aşağıda, 5.251 tamam başqa iddiadır. Bu səviyyənin itirilməsi təkcə bir geri çəkilməni uğursuz etmir; konstruktiv ssenarinin söykəndiyi strukturu ləğv edir. Bunun üzərində qalmaq da öz-özlüyündə heç nəyi sübut etmir — sağ qalmaq sağlam olmaq demək deyil və bu fikirlər ayrı qalmalıdır.
Yalnız 5.289-da həqiqi müdafiə baş verdikdən sonra 5.368 ardıcıllıqla izlənəcək növbəti səviyyə kimi əhəmiyyət qazanır. Öz səviyyəsini yenidən sınaqdan keçirmədən yüksələn ralli kimin qalmaq niyyətində olduğu barədə az şey deyir.
Əks çəkilər törəmə alətlər tərəfindəndir: açıq mövqelər və cari maliyyələşdirmə göstəricisi. Bunların heç biri spot struktur və həcm kimi gücü təsdiqləmir. Ssenari konstruktivdir, lakin mövqelənmə ilə bağlı ehtiyatlı olmaq lazımdır.
#Crypto #QrafikTəhlili
Bu sınaq nöqtəsi 5.289-dur. Onun rolu məhduddur: ilk dəfə yenidən sınaqdan keçiriləndə qiymət ya bu toxunuşu müdafiə olunan reaksiyaya çevirir — satıcıların təklifi udulur, qiymət yenidən yuxarıda bağlanır — ya da səviyyənin altına iynə atıb aşağı sürüşür. Bunu qiymətləndirmək üçün ən güclü dəlillər qiymət strukturu və həcmdir; toxunuş zamanı taker axını da diqqətə layiqdir. Sınaq baş verməmiş bunların heç biri suala cavab vermir.
Bir səviyyə aşağıda, 5.251 tamam başqa iddiadır. Bu səviyyənin itirilməsi təkcə bir geri çəkilməni uğursuz etmir; konstruktiv ssenarinin söykəndiyi strukturu ləğv edir. Bunun üzərində qalmaq da öz-özlüyündə heç nəyi sübut etmir — sağ qalmaq sağlam olmaq demək deyil və bu fikirlər ayrı qalmalıdır.
Yalnız 5.289-da həqiqi müdafiə baş verdikdən sonra 5.368 ardıcıllıqla izlənəcək növbəti səviyyə kimi əhəmiyyət qazanır. Öz səviyyəsini yenidən sınaqdan keçirmədən yüksələn ralli kimin qalmaq niyyətində olduğu barədə az şey deyir.
Əks çəkilər törəmə alətlər tərəfindəndir: açıq mövqelər və cari maliyyələşdirmə göstəricisi. Bunların heç biri spot struktur və həcm kimi gücü təsdiqləmir. Ssenari konstruktivdir, lakin mövqelənmə ilə bağlı ehtiyatlı olmaq lazımdır.
#Crypto #QrafikTəhlili
86
·
--
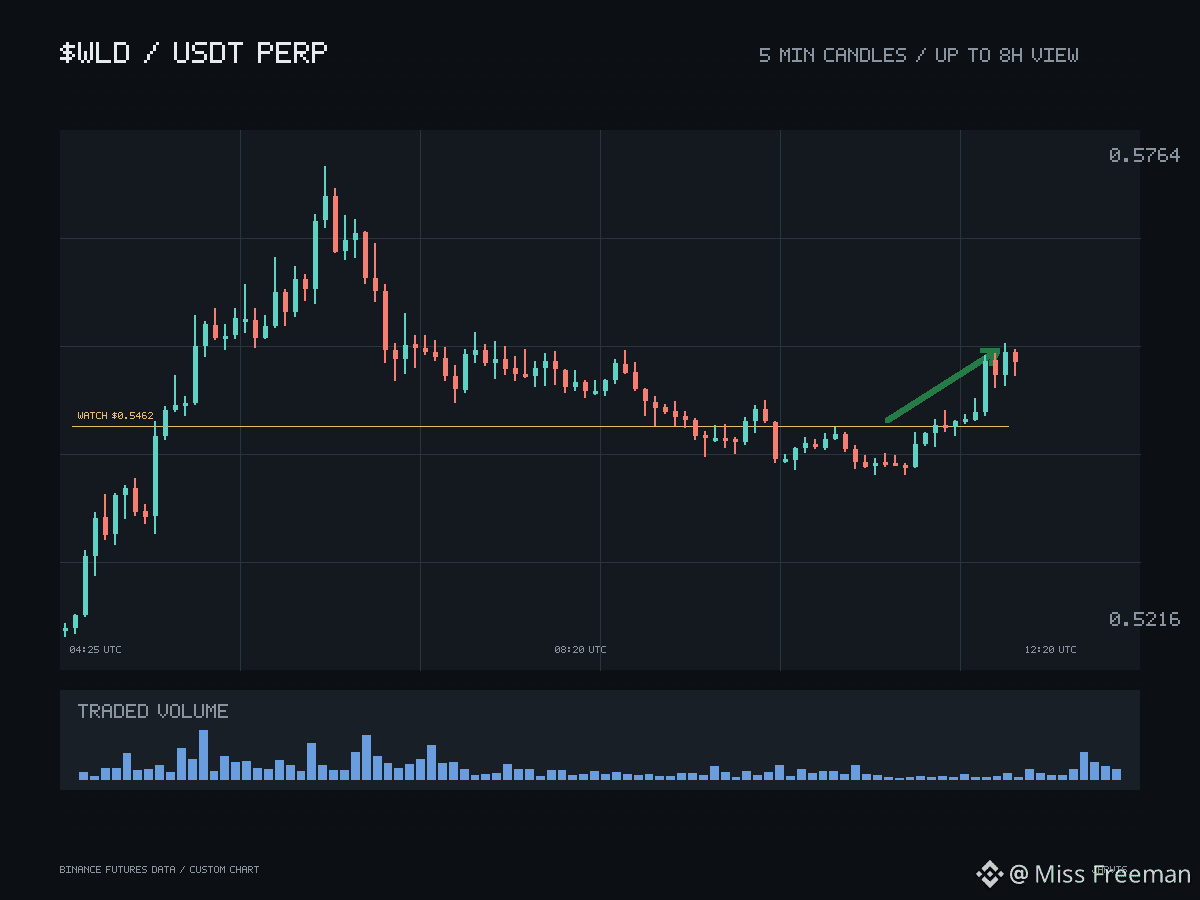
$WLD Daha aşağı zirvə və daha aşağı dib ardıcıllığı adətən zəiflik kimi qiymətləndirilir, lakin hazırda bu, konstruktiv ssenarinin əsasını təşkil edir — bir şərtlə ki, dəstəyə növbəti toxunuş sadəcə ötüb keçmək yox, həqiqi reaksiya ilə nəticələnsin. 0.5194 səviyyəsinin ilk təkrar sınağı məhz bu dar vəzifəni daşıyır: satıcıların təzyiqini qarşılamaq və qiymətin yenidən bu səviyyənin üzərində bağlanması. Qiymətin fitil vasitəsilə səviyyəni keçib sonra aşağı sürüşməsi isə suala yanlış cavab verir; toxunuş baş verməzdən əvvəl heç nə bunu aydınlaşdıra bilməz.
Bu sınaq baş verəndə onu qiymətləndirmək üçün ən güclü alətlər qiymət strukturu və həcmdir. Yalnız müdafiə özünü göstərərsə, növbəti izləniləcək səviyyə kimi 0.5462 əhəmiyyət qazanır — ardıcıllığı ciddi şəkildə qorumaq şərtilə. Öz təkrar sınağını keçmədən göstərilən güc, kimin mövqedə qalmaq niyyətində olduğu barədə az şey deyir.
Daha aşağıda, 0.5139 başqa səviyyədə işləyir. Bu səviyyənin itirilməsi təkcə bir geriçəkilmənin uğursuz olması demək deyil; bütün ssenarinin əsaslandığı daha aşağı zirvə və daha aşağı dib davranışını aradan qaldırır. Onun üzərində qalmaq da öz-özlüyündə heç nəyi sübut etmir. 0.5194-ün aşağısına enmək həlledici deyil, 0.5139-un üzərində qalmaq isə sağlamlıq əlaməti deyil — bu iddialar ayrı qiymətləndirilməlidir.
Əks-təsir göstərən amillər açıq mövqelərin həcmi və maliyyələşdirmə göstəricisinin hazırkı vəziyyətidir; bunların heç biri qiymət və həcm kimi gücü təsdiqləmir. Konstruktiv görünüş var, lakin mövqelənmə ilə bağlı ehtiyatlı olmaq lazımdır.
#Crypto #QrafikTəhlili
$WLD Daha aşağı zirvə və daha aşağı dib ardıcıllığı adətən zəiflik kimi qiymətləndirilir, lakin hazırda bu, konstruktiv ssenarinin əsasını təşkil edir — bir şərtlə ki, dəstəyə növbəti toxunuş sadəcə ötüb keçmək yox, həqiqi reaksiya ilə nəticələnsin. 0.5194 səviyyəsinin ilk təkrar sınağı məhz bu dar vəzifəni daşıyır: satıcıların təzyiqini qarşılamaq və qiymətin yenidən bu səviyyənin üzərində bağlanması. Qiymətin fitil vasitəsilə səviyyəni keçib sonra aşağı sürüşməsi isə suala yanlış cavab verir; toxunuş baş verməzdən əvvəl heç nə bunu aydınlaşdıra bilməz.
Bu sınaq baş verəndə onu qiymətləndirmək üçün ən güclü alətlər qiymət strukturu və həcmdir. Yalnız müdafiə özünü göstərərsə, növbəti izləniləcək səviyyə kimi 0.5462 əhəmiyyət qazanır — ardıcıllığı ciddi şəkildə qorumaq şərtilə. Öz təkrar sınağını keçmədən göstərilən güc, kimin mövqedə qalmaq niyyətində olduğu barədə az şey deyir.
Daha aşağıda, 0.5139 başqa səviyyədə işləyir. Bu səviyyənin itirilməsi təkcə bir geriçəkilmənin uğursuz olması demək deyil; bütün ssenarinin əsaslandığı daha aşağı zirvə və daha aşağı dib davranışını aradan qaldırır. Onun üzərində qalmaq da öz-özlüyündə heç nəyi sübut etmir. 0.5194-ün aşağısına enmək həlledici deyil, 0.5139-un üzərində qalmaq isə sağlamlıq əlaməti deyil — bu iddialar ayrı qiymətləndirilməlidir.
Əks-təsir göstərən amillər açıq mövqelərin həcmi və maliyyələşdirmə göstəricisinin hazırkı vəziyyətidir; bunların heç biri qiymət və həcm kimi gücü təsdiqləmir. Konstruktiv görünüş var, lakin mövqelənmə ilə bağlı ehtiyatlı olmaq lazımdır.
#Crypto #QrafikTəhlili
Bu sınaq baş verəndə onu qiymətləndirmək üçün ən güclü alətlər qiymət strukturu və həcmdir. Yalnız müdafiə özünü göstərərsə, növbəti izləniləcək səviyyə kimi 0.5462 əhəmiyyət qazanır — ardıcıllığı ciddi şəkildə qorumaq şərtilə. Öz təkrar sınağını keçmədən göstərilən güc, kimin mövqedə qalmaq niyyətində olduğu barədə az şey deyir.
Daha aşağıda, 0.5139 başqa səviyyədə işləyir. Bu səviyyənin itirilməsi təkcə bir geriçəkilmənin uğursuz olması demək deyil; bütün ssenarinin əsaslandığı daha aşağı zirvə və daha aşağı dib davranışını aradan qaldırır. Onun üzərində qalmaq da öz-özlüyündə heç nəyi sübut etmir. 0.5194-ün aşağısına enmək həlledici deyil, 0.5139-un üzərində qalmaq isə sağlamlıq əlaməti deyil — bu iddialar ayrı qiymətləndirilməlidir.
Əks-təsir göstərən amillər açıq mövqelərin həcmi və maliyyələşdirmə göstəricisinin hazırkı vəziyyətidir; bunların heç biri qiymət və həcm kimi gücü təsdiqləmir. Konstruktiv görünüş var, lakin mövqelənmə ilə bağlı ehtiyatlı olmaq lazımdır.
#Crypto #QrafikTəhlili
4
553
Daha çox kontent araşdırmaq üçün daxil olun
Binance Square-də qlobal kriptovalyuta istifadəçilərinə qoşulun
⚡️ Kriptovalyuta haqqında ən son və faydalı məlumatları əldə edin.
💬 Dünyanın ən böyük kriptovalyuta birjası tərəfindən etibar edilir.
👍 Doğrulanmış yaradıcılardan gələn real məlumatları kəşf edin.
E-poçt/Telefon nömrəsi
Trenddə olan mövzular
1
#BinancePick
2.8M baxış
Müzakirə edir: 147,266
2
#EarningsSeason
5.1M baxış
Müzakirə edir: 25,139
3
#AnthropicTTMRevenueGrewAbout1200%
582 baxış
Müzakirə edir: 75
4
#AnthropicS1ExpectedToday
2,605 baxış
Müzakirə edir: 96
5
#SouthKoreaReportedlyWeighsFourthCryptoTaxDelay
11,154 baxış
Müzakirə edir: 263
6
#FranklinTempletonFilesForTwoDividendToBitcoinETFs
18,027 baxış
Müzakirə edir: 388
7
#StrategyMSTRSurpassesNasdaqInMarketCap
14,621 baxış
Müzakirə edir: 302
8
#CanadaProposesStablecoinRedemptionWithin3BusinessDays
682 baxış
Müzakirə edir: 30
9
#ElectrumWalletBugLetRogueServersStealFunds
19,209 baxış
Müzakirə edir: 400
10
#ArgentineCourtDismissesLIBRACaseAgainstMilei
29,975 baxış
Müzakirə edir: 487