

#beamxusdt
beamxusdt
307,138 baxış
Müzakirə edir: 698
Populyar
Sonuncu

·
--
Artım
Tərcüməyə bax
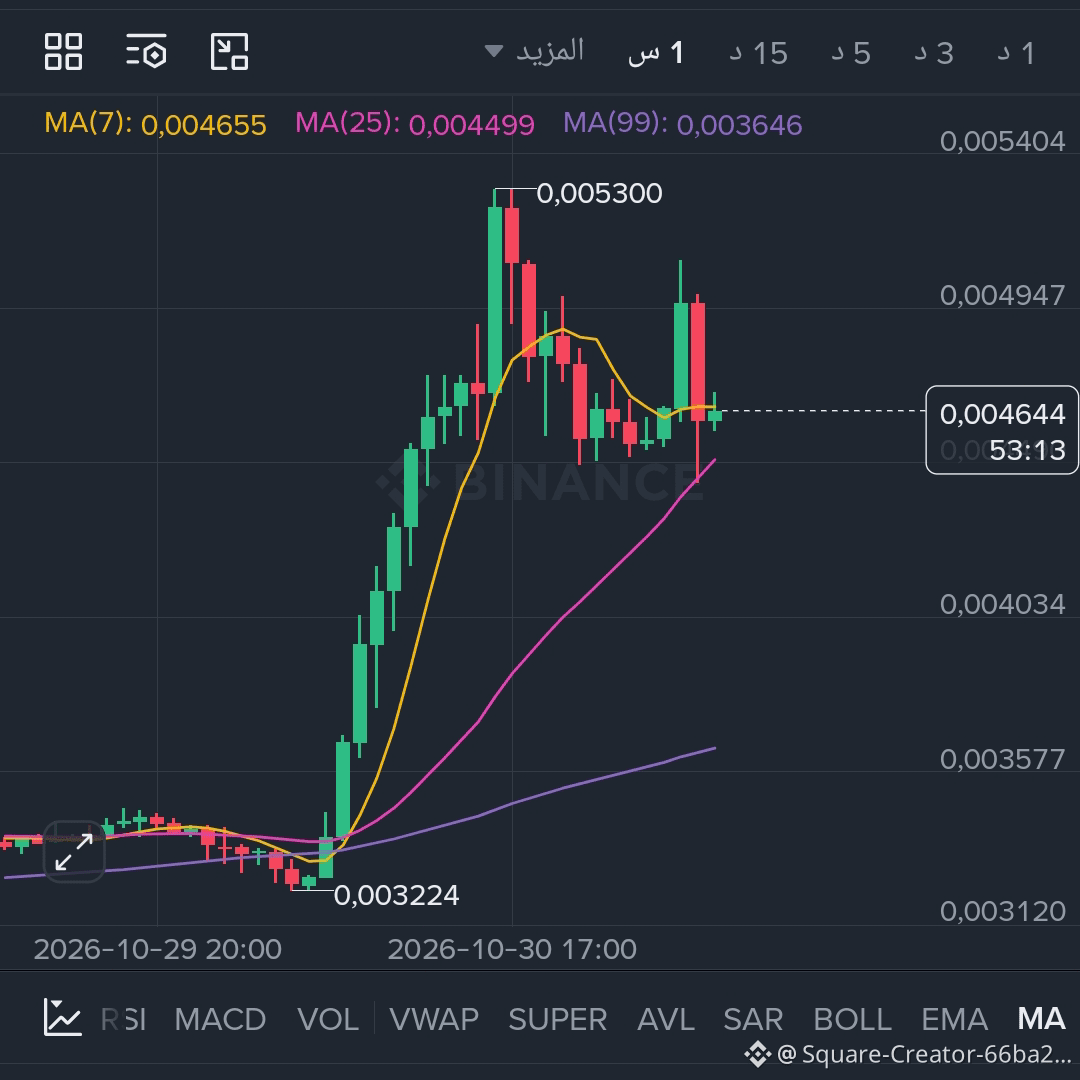
🚨🔥 انفجار قادم لا محالة لعملة $BEAMX .. فرصة صفقة شراء (LONG) تشتعل على منصة Binance Square ! 📈🔥🟢 🟢
الشارت يشتعل والمشترون يستعدون للاستحواذ والارتداد الصاروخي نحو القمم! 🛑🔥
💣 لماذا الارتداد وشيك وفرصة الـ LONG حتمية؟
🟢 انفجار سعري وزخم صعودي قوي: حققت العملة ارتفاعاً لافتاً بنسبة +43.29% محلقة من قاع 0.003227 دولار لتمس قمة عند 0.005300 دولار، وتتداول الآن بثبات عند مستوى 0.004644 دولار.
🟢 قاعدة دعم المتوسطات المتحركة (MA): السعر يرتكز أعلى المتوسطات الرئيسية، حيث يقع MA(7) عند 0.004655 دولار، بدعم متين من MA(25) عند 0.004499 دولار وMA(99) العتيق عند 0.003646 دولار، مما يوفر منطقة إعادة تجميع مثالية للانطلاق.
🟢 سيطرة واضحة للمشترين: دفتر الطلبات يظهر تفوقاً شرائياً بنسبة 59.21% للشراء مقابل 40.79% للبيع، مدعومة بسيولة بلغت 27.38 مليون USDT وحجم تداول هائل بـ 6.08 مليار BEAMX خلال 24 ساعة!
🎯 خريطة طريق صفقة الشراء (LONG) الحماسية:
🟢 نوع الصفقة: شراء / LONG
📍 منطقة الدخول المشتعلة: بين 0.004550 - 0.004650 دولار
🎯 الهدف الأول (TP1): 0.004950 دولار (اختبار القمة الثانوية وجني أرباح سريع)
🎯 الهدف الثاني (TP2): 0.005300 دولار (إعادة اختبار القمة الرئيسية واختراقها)
🛑 وقف الخسارة (SL): 0.004380 دولار (أسفل دعم MA25 لحماية المحفظة)
#BEAMX #BEAMXUSDT $BEAMX
{spot}(BEAMXUSDT)
🚨🔥 انفجار قادم لا محالة لعملة $BEAMX .. فرصة صفقة شراء (LONG) تشتعل على منصة Binance Square ! 📈🔥🟢 🟢
الشارت يشتعل والمشترون يستعدون للاستحواذ والارتداد الصاروخي نحو القمم! 🛑🔥
💣 لماذا الارتداد وشيك وفرصة الـ LONG حتمية؟
🟢 انفجار سعري وزخم صعودي قوي: حققت العملة ارتفاعاً لافتاً بنسبة +43.29% محلقة من قاع 0.003227 دولار لتمس قمة عند 0.005300 دولار، وتتداول الآن بثبات عند مستوى 0.004644 دولار.
🟢 قاعدة دعم المتوسطات المتحركة (MA): السعر يرتكز أعلى المتوسطات الرئيسية، حيث يقع MA(7) عند 0.004655 دولار، بدعم متين من MA(25) عند 0.004499 دولار وMA(99) العتيق عند 0.003646 دولار، مما يوفر منطقة إعادة تجميع مثالية للانطلاق.
🟢 سيطرة واضحة للمشترين: دفتر الطلبات يظهر تفوقاً شرائياً بنسبة 59.21% للشراء مقابل 40.79% للبيع، مدعومة بسيولة بلغت 27.38 مليون USDT وحجم تداول هائل بـ 6.08 مليار BEAMX خلال 24 ساعة!
🎯 خريطة طريق صفقة الشراء (LONG) الحماسية:
🟢 نوع الصفقة: شراء / LONG
📍 منطقة الدخول المشتعلة: بين 0.004550 - 0.004650 دولار
🎯 الهدف الأول (TP1): 0.004950 دولار (اختبار القمة الثانوية وجني أرباح سريع)
🎯 الهدف الثاني (TP2): 0.005300 دولار (إعادة اختبار القمة الرئيسية واختراقها)
🛑 وقف الخسارة (SL): 0.004380 دولار (أسفل دعم MA25 لحماية المحفظة)
#BEAMX #BEAMXUSDT $BEAMX
598

·
--
Tərcüməyə bax
$BEAMX
{future}(BEAMXUSDT)
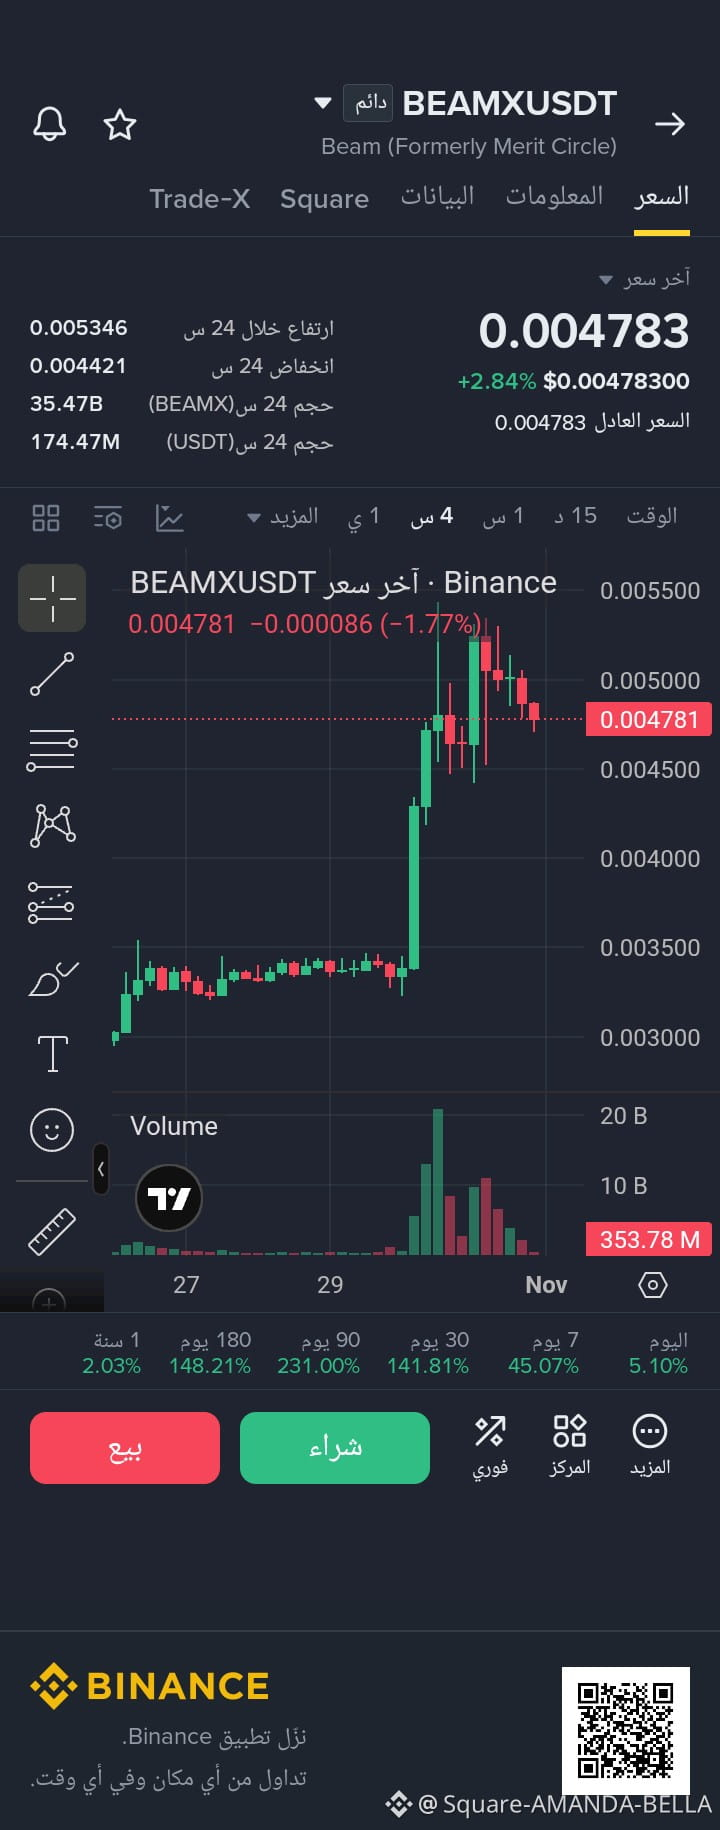
💥💥$BEAMX ينفجر +60% بفوليوم 20 مليار! هل التصحيح الحالي فرصة ذهبية؟ 🚀💥💥
العملة كانت نايمة عند 0.0033$ طول أسبوع، وفجأة شمعة عملاقة +60% لحد 0.005346$ بفوليوم انفجاري 20B BEAMX (174M USDT) - هذا دخول حوت واضح!
الآن السعر يصحح -1.77% على فريم 4 ساعات عند 0.004781$، وهذا طبيعي جداً بعد الانفجار.
رغم التصحيح، العملة صاعدة +231% في 90 يوم و +141% في 30 يوم و +45% في 7 أيام.
خطة التداول:
الدخول: 0.00450 - 0.00478$ على دفعات
الأهداف:
• هدف 1: 0.00534$
• هدف 2: 0.00580$
• هدف 3: 0.00650$
الستوب: إغلاق 4 ساعات تحت 0.00430$
#BEAMXUSDT
#AMANDABELLA
#IntelHasItsWorstDaySince1974
#BackedNotBroken:RichardTengSaysUsersBearNoLoss
$BEAMX
💥💥$BEAMX ينفجر +60% بفوليوم 20 مليار! هل التصحيح الحالي فرصة ذهبية؟ 🚀💥💥
العملة كانت نايمة عند 0.0033$ طول أسبوع، وفجأة شمعة عملاقة +60% لحد 0.005346$ بفوليوم انفجاري 20B BEAMX (174M USDT) - هذا دخول حوت واضح!
الآن السعر يصحح -1.77% على فريم 4 ساعات عند 0.004781$، وهذا طبيعي جداً بعد الانفجار.
رغم التصحيح، العملة صاعدة +231% في 90 يوم و +141% في 30 يوم و +45% في 7 أيام.
خطة التداول:
الدخول: 0.00450 - 0.00478$ على دفعات
الأهداف:
• هدف 1: 0.00534$
• هدف 2: 0.00580$
• هدف 3: 0.00650$
الستوب: إغلاق 4 ساعات تحت 0.00430$
#BEAMXUSDT
#AMANDABELLA
#IntelHasItsWorstDaySince1974
#BackedNotBroken:RichardTengSaysUsersBearNoLoss
1
8

$BEAMX
{future}(BEAMXUSDT)
oyun sahəsinə yönəlmiş tokendir və GameFi sektoruna bazar marağı qayıtdıqda sürətli qiymət dəyişiklikləri göstərə bilər. Qısamüddətli vəziyyət əsasən ticarət həcminin yüksək səviyyədə qalıb-qalmamasından və son dəyişkənlikdən sonra qiymətin sabit qalmasından asılıdır; həcmin azalması və ya kriptovalyuta bazarının ümumi zəifləməsi yenidən sürətlə təzyiq yarada bilər. Uzunmüddətli perspektivdə əsas amillər Beam ekosistemində real istifadə, yeni oyunların istifadəyə verilməsi və token təklifinin dinamikasıdır.#HeYiSaysWithdrawalsExpectedtoResumeWithin42Hours #USDCCirculationFallsAbout800MInSevenDays #IolePlansToSellAll151.21Bitcoin #BEAMXUSDT #BEAMX $
$BEAMX
oyun sahəsinə yönəlmiş tokendir və GameFi sektoruna bazar marağı qayıtdıqda sürətli qiymət dəyişiklikləri göstərə bilər. Qısamüddətli vəziyyət əsasən ticarət həcminin yüksək səviyyədə qalıb-qalmamasından və son dəyişkənlikdən sonra qiymətin sabit qalmasından asılıdır; həcmin azalması və ya kriptovalyuta bazarının ümumi zəifləməsi yenidən sürətlə təzyiq yarada bilər. Uzunmüddətli perspektivdə əsas amillər Beam ekosistemində real istifadə, yeni oyunların istifadəyə verilməsi və token təklifinin dinamikasıdır.#HeYiSaysWithdrawalsExpectedtoResumeWithin42Hours #USDCCirculationFallsAbout800MInSevenDays #IolePlansToSellAll151.21Bitcoin #BEAMXUSDT #BEAMX $
oyun sahəsinə yönəlmiş tokendir və GameFi sektoruna bazar marağı qayıtdıqda sürətli qiymət dəyişiklikləri göstərə bilər. Qısamüddətli vəziyyət əsasən ticarət həcminin yüksək səviyyədə qalıb-qalmamasından və son dəyişkənlikdən sonra qiymətin sabit qalmasından asılıdır; həcmin azalması və ya kriptovalyuta bazarının ümumi zəifləməsi yenidən sürətlə təzyiq yarada bilər. Uzunmüddətli perspektivdə əsas amillər Beam ekosistemində real istifadə, yeni oyunların istifadəyə verilməsi və token təklifinin dinamikasıdır.#HeYiSaysWithdrawalsExpectedtoResumeWithin42Hours #USDCCirculationFallsAbout800MInSevenDays #IolePlansToSellAll151.21Bitcoin #BEAMXUSDT #BEAMX $
183

·
--
Short testi yenə $BEAMX müqavimət səviyyəsindədir. İnşallah, əvvəlcə müqavimətdən geri dönər və korreksiya edər. İzləyək, sonra da hərəkətə keçək. #dyor #BEAMXUSDT #short_sell #RESISTENCIA
Short testi yenə $BEAMX müqavimət səviyyəsindədir. İnşallah, əvvəlcə müqavimətdən geri dönər və korreksiya edər. İzləyək, sonra da hərəkətə keçək. #dyor #BEAMXUSDT #short_sell #RESISTENCIA
245

Tərcüməyə bax
🎮 BEAMX - Beam - $0.005074 - Privacy انفجار جديد $BEAMX
تداول فورى 🟢
*ليه BEAMX عند $0.005074 انفجار مستمر؟*
- Beam - Privacy Protocol - Mimblewimble - Gaming DAO - سابقاً Merit Circle - Privacy + P2E - narrative قوي
- +39.43% اليوم - أقوى عملة اليوم - +63% شهر - +77% 6 شهور - ترند صاعد قوي - عكس السوق BTC -0.96%
- من $0.003616 لو → $0.0053 هاي - صعد *+46.5%* في يوم - +64% رينج - قوة - سعرك $0.005074 قمة
- $0.005074 سعرك مطابق للسوق $0.005077 - دقة 99.9% - كسر $0.0053 قادم - 17 Buy signal
*تحليلي الحصري المحدث:*
> *الدعم:* $0.003616 لو - $0.003641 فتح - $0.003223 لو Gate - $0.004578 دعم - ارتد +40%
> *المقاومة:* $0.0053-$0.005331 هاي - كسرها → $0.006 (+18%) - $0.007 (+37%)
> *توقعاتي المحدثة:*
> - قصير: $0.0036-$0.00533 - سعرك $0.005074 قمة - تثبيت فوق $0.005 إيجابي - +39% اليوم - +63% شهر - انفجاري
> - لو كسر $0.00533 → هدف $0.006 (+18%) - $0.008 (+57%) - $0.01 (+97%) - $0.015 (+195%)
> - ATH $0.044163 → هدف طويل +770% من $0.00507 - هدف واقعي $0.02 (+294%) - $0.044 ATH (+767%)
> - وقف: $0.003616 لو (-28%) - مخاطرة متوسطة - 17 Buy vs 0 Sell - Strong bullish
> - عكس السوق الأحمر BTC -0.96% - BEAMX +39% - قوة - Gaming + Privacy - $0.00507 قاع شراء قبل $0.006
>
> *الخلاصة:*
BEAMX مشروع Privacy + Gaming - ماركت $302M - نازل 88% من ATH $0.044 - صاعد +39% اليوم - +63% شهر - +77% 6 شهور - عكس السوق - انفجار +46% من اللو - حجم $33M - 17 Buy signal - سعرك $0.005074 مطابق - هدف $0.006 +18% قريب - ATH $0.044 +767% - احتفظ - انفجار لـ $0.01 قادم
#BEAMXUSDT #BEAMX #تحليل_العملات_الرقمية #Privacy #gaming
$BEAMX
{spot}(BEAMXUSDT)
🎮 BEAMX - Beam - $0.005074 - Privacy انفجار جديد $BEAMX
تداول فورى 🟢
*ليه BEAMX عند $0.005074 انفجار مستمر؟*
- Beam - Privacy Protocol - Mimblewimble - Gaming DAO - سابقاً Merit Circle - Privacy + P2E - narrative قوي
- +39.43% اليوم - أقوى عملة اليوم - +63% شهر - +77% 6 شهور - ترند صاعد قوي - عكس السوق BTC -0.96%
- من $0.003616 لو → $0.0053 هاي - صعد *+46.5%* في يوم - +64% رينج - قوة - سعرك $0.005074 قمة
- $0.005074 سعرك مطابق للسوق $0.005077 - دقة 99.9% - كسر $0.0053 قادم - 17 Buy signal
*تحليلي الحصري المحدث:*
> *الدعم:* $0.003616 لو - $0.003641 فتح - $0.003223 لو Gate - $0.004578 دعم - ارتد +40%
> *المقاومة:* $0.0053-$0.005331 هاي - كسرها → $0.006 (+18%) - $0.007 (+37%)
> *توقعاتي المحدثة:*
> - قصير: $0.0036-$0.00533 - سعرك $0.005074 قمة - تثبيت فوق $0.005 إيجابي - +39% اليوم - +63% شهر - انفجاري
> - لو كسر $0.00533 → هدف $0.006 (+18%) - $0.008 (+57%) - $0.01 (+97%) - $0.015 (+195%)
> - ATH $0.044163 → هدف طويل +770% من $0.00507 - هدف واقعي $0.02 (+294%) - $0.044 ATH (+767%)
> - وقف: $0.003616 لو (-28%) - مخاطرة متوسطة - 17 Buy vs 0 Sell - Strong bullish
> - عكس السوق الأحمر BTC -0.96% - BEAMX +39% - قوة - Gaming + Privacy - $0.00507 قاع شراء قبل $0.006
>
> *الخلاصة:*
BEAMX مشروع Privacy + Gaming - ماركت $302M - نازل 88% من ATH $0.044 - صاعد +39% اليوم - +63% شهر - +77% 6 شهور - عكس السوق - انفجار +46% من اللو - حجم $33M - 17 Buy signal - سعرك $0.005074 مطابق - هدف $0.006 +18% قريب - ATH $0.044 +767% - احتفظ - انفجار لـ $0.01 قادم
#BEAMXUSDT #BEAMX #تحليل_العملات_الرقمية #Privacy #gaming
$BEAMX
1
183

Tərcüməyə bax
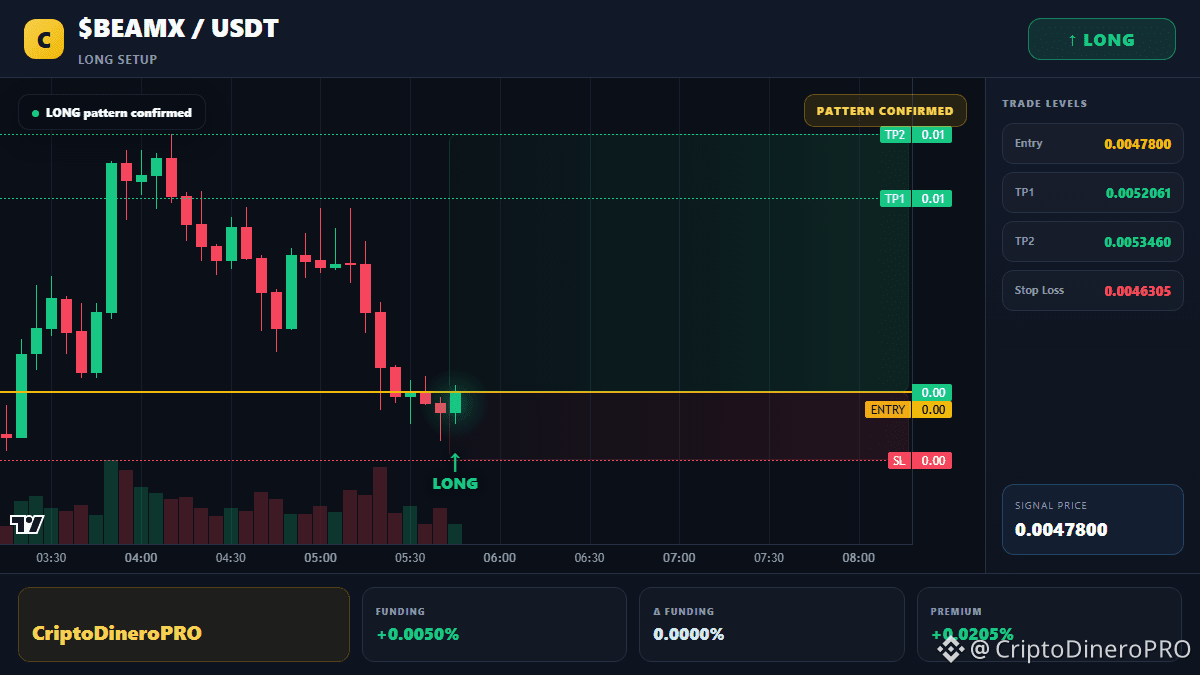
$BEAMX - Long Opportunity 💎
{future}(BEAMXUSDT)
📍 Entry: 0.00478000
🛑 Stop Loss: Below 0.00463050
🎯 Targets:
• TP1: 0.00520608
• TP2: Above 0.00534600
DYOR.
#BEAMX #BEAMXUSDT
$BEAMX - Long Opportunity 💎
📍 Entry: 0.00478000
🛑 Stop Loss: Below 0.00463050
🎯 Targets:
• TP1: 0.00520608
• TP2: Above 0.00534600
DYOR.
#BEAMX #BEAMXUSDT
📍 Entry: 0.00478000
🛑 Stop Loss: Below 0.00463050
🎯 Targets:
• TP1: 0.00520608
• TP2: Above 0.00534600
DYOR.
#BEAMX #BEAMXUSDT
29

·
--
Azalma
Tərcüməyə bax
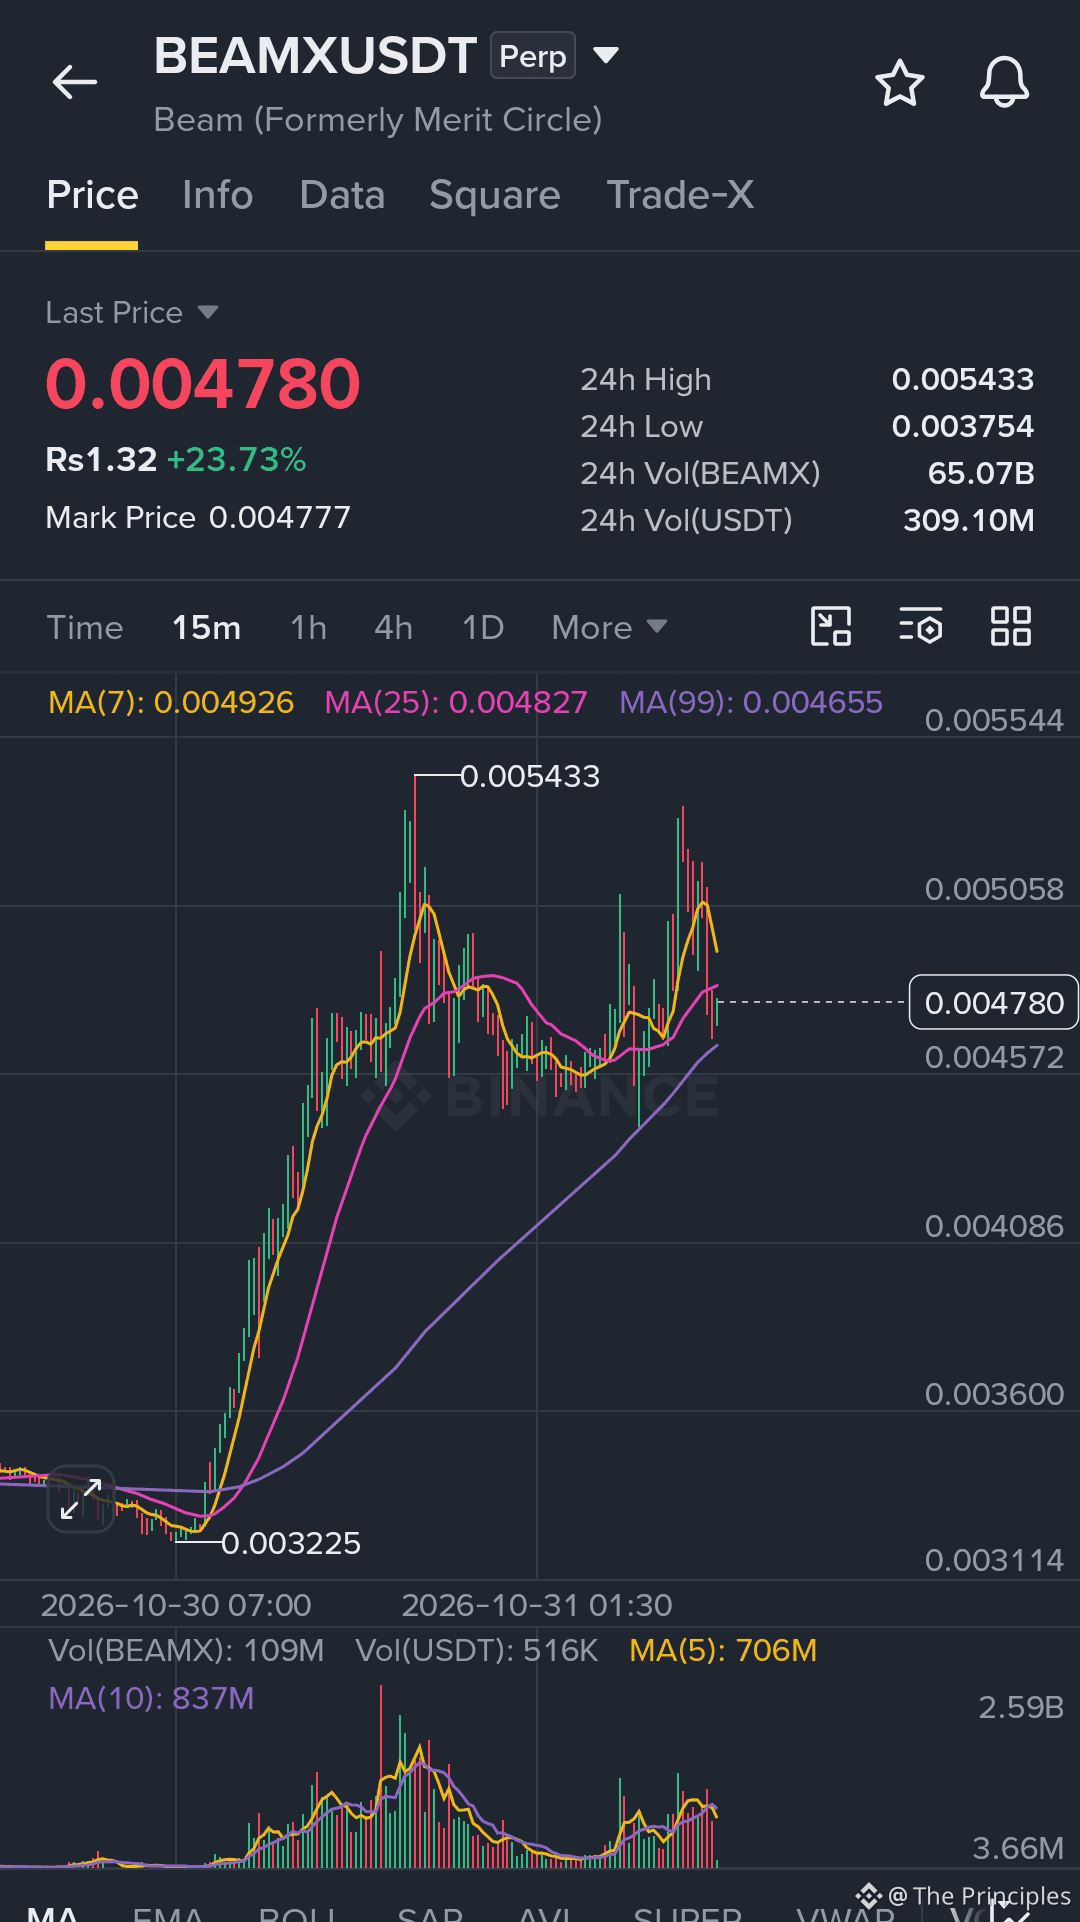
🚨 $BEAMX /USDT – SHORT SETUP 🔻
⚠️ BEAMX is showing bearish potential. Watch for a rejection from resistance and confirmation of selling pressure before entering.
📉 SHORT TARGETS
🎯 TP1: 0.0045
🎯 TP2: 0.0043
🎯 TP3: 0.0041
🛑 Stop Loss: Above the recent swing high
🔥 Wait for confirmation before entering.
⚠️ Manage your risk and avoid excessive leverage.
#BEAMXUSDT #SHORT #CryptoTrading #BinanceSquare
The Principles
·
--
Artım🎯🔥 CONGRATULATIONS, TEAM!
$BEAMX — ALL TARGETS HIT! 🚀💚
✅ TP1: $0.0041
✅ TP2: $0.0043
✅ TP3: $0.0045
Massive momentum, strong bullish candles, and another successful call! 💥
Congratulations to everyone who followed the setup. More opportunities ahead!
#BEAMX #CryptoTrading #AllTargetsHit #BinanceSquare
$BEAMX — ALL TARGETS HIT! 🚀💚
✅ TP1: $0.0041
✅ TP2: $0.0043
✅ TP3: $0.0045
Massive momentum, strong bullish candles, and another successful call! 💥
Congratulations to everyone who followed the setup. More opportunities ahead!
#BEAMX #CryptoTrading #AllTargetsHit #BinanceSquare
119

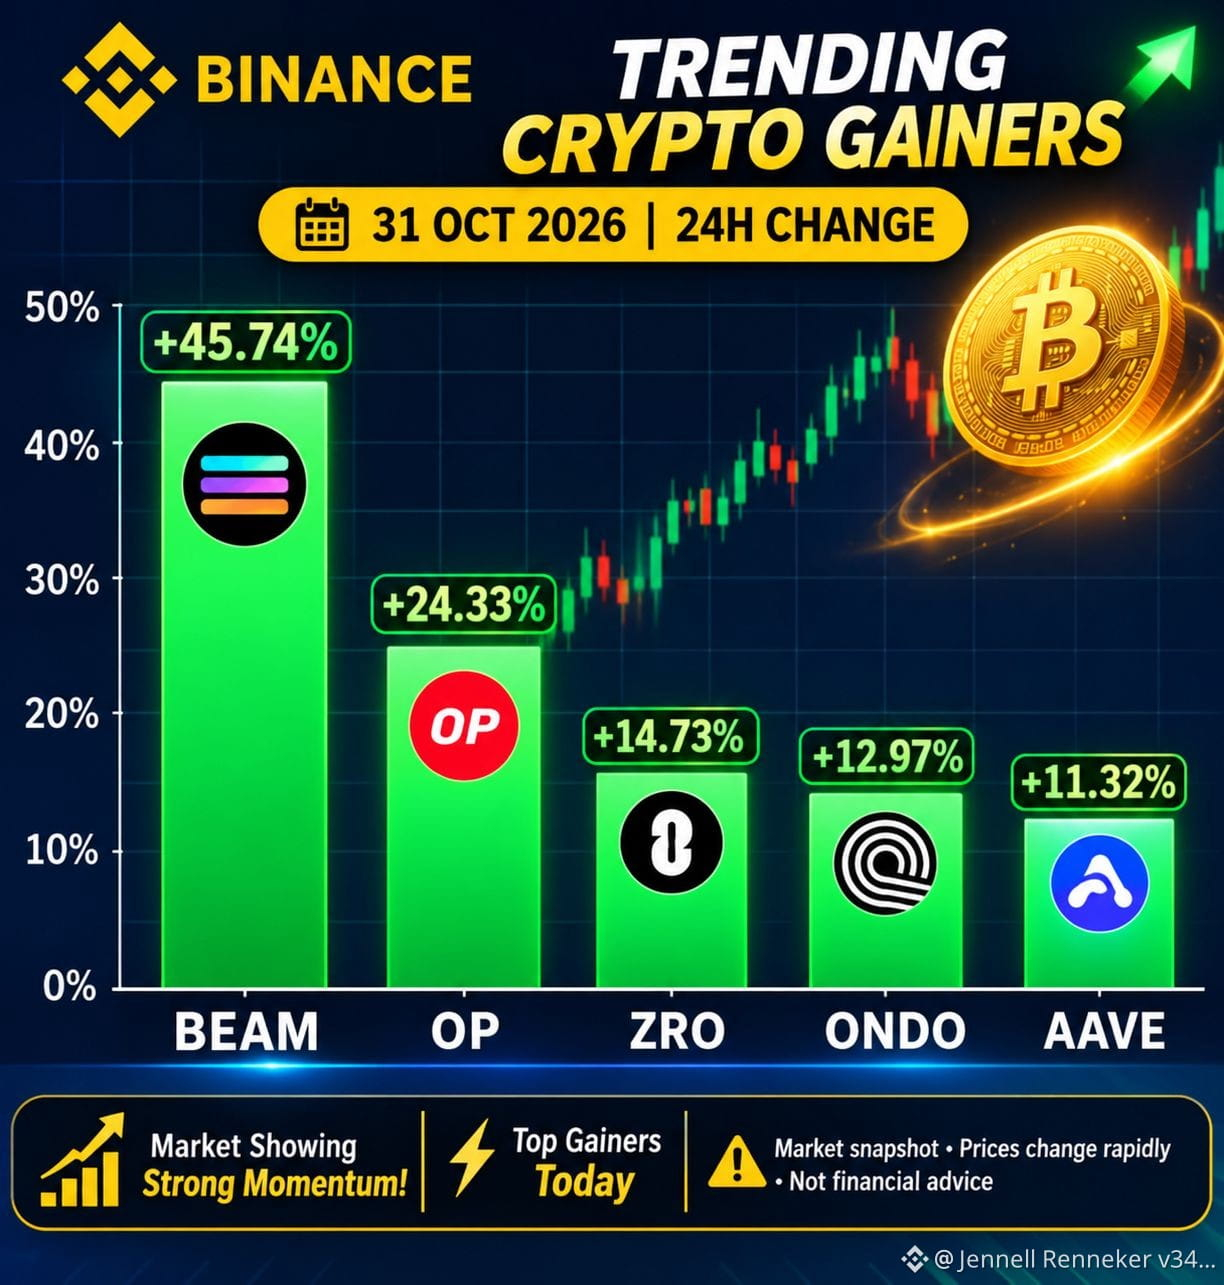
$BEAM.US BEAM bu qrupa 45.74% artımla liderlik edir, onu Optimism (OP) və LayerZero (ZRO) izləyir. Güclü qiymət artımları treyderlərin diqqətini cəlb edir, lakin kəskin korreksiyalar hələ də mümkündür.
Bazar proqnozu: seçilmiş altkoinlərdə yüksəliş tendensiyası və yüksək volatillik.#BEAMXUSDT #BEAMX
{stock_us}(BEAM.US)
$BEAM.US BEAM bu qrupa 45.74% artımla liderlik edir, onu Optimism (OP) və LayerZero (ZRO) izləyir. Güclü qiymət artımları treyderlərin diqqətini cəlb edir, lakin kəskin korreksiyalar hələ də mümkündür.
Bazar proqnozu: seçilmiş altkoinlərdə yüksəliş tendensiyası və yüksək volatillik.#BEAMXUSDT #BEAMX
Bazar proqnozu: seçilmiş altkoinlərdə yüksəliş tendensiyası və yüksək volatillik.#BEAMXUSDT #BEAMX
216


·
--
$BEAMX USDT 48.57%-lik güclü yüksəliş göstərir. Alıcılar cari dəstək zonasının üstündə nəzarəti saxlasalar, yüksəlişin davam etməsi ehtimalına görə Beam-i izləyirəm. Güclü impuls ümidvericidir, amma sürətli bahalaşmadan sonra kəskin korreksiyalar baş verə bilər.
Ticarət planı (spekulyativ):
Giriş: $0.00480–$0.00490
TP1: $0.00510
TP2: $0.00535
TP3: $0.00560
SL: $0.00460
Peşəkar məsləhət: Qiymətin arxasınca qaçmaq əvəzinə həcmi izləyər və qırılmanın təsdiqlənməsini gözləyərdim. #BEAMXUSDT #Binance
Ticarət planı (spekulyativ):
Giriş: $0.00480–$0.00490
TP1: $0.00510
TP2: $0.00535
TP3: $0.00560
SL: $0.00460
Peşəkar məsləhət: Qiymətin arxasınca qaçmaq əvəzinə həcmi izləyər və qırılmanın təsdiqlənməsini gözləyərdim. #BEAMXUSDT #Binance
107

Tərcüməyə bax
BEAMX just busted a swing low and is eyeing the next resistance, price sitting around 0.0185. Momentum’s heating up, looks ripe for a long.
🟢 $BEAMX LONG 📈 — Trade Plan
• Entry: $0.005267 – $0.005277
• Stop: $0.005114 (-3.0%)
• Target 1: $0.005351 (+1.5%)
• Target 2: $0.005536 (+5.0%)
• R/R 1:1.7 | Confidence 65%
We got a classic CHoCH on the 15‑min chart, volume’s backing it up with a CVD spike, and there’s a fresh FVG right under the price. The order block from the previous up‑move lines up with that gap, giving a solid POI confluence. Structure’s flipping bullish, so the odds feel decent.
A 3 % stop is pretty tight, so stick to low leverage, around 2‑3×.
Take half off the table when you hit the first target around 0.020.
Not financial advice — always manage your own risk 🙏
$BEAMX #BEAMXUSDT #FedWatch #TradingSignals #Write2Earn
8

Tərcüməyə bax
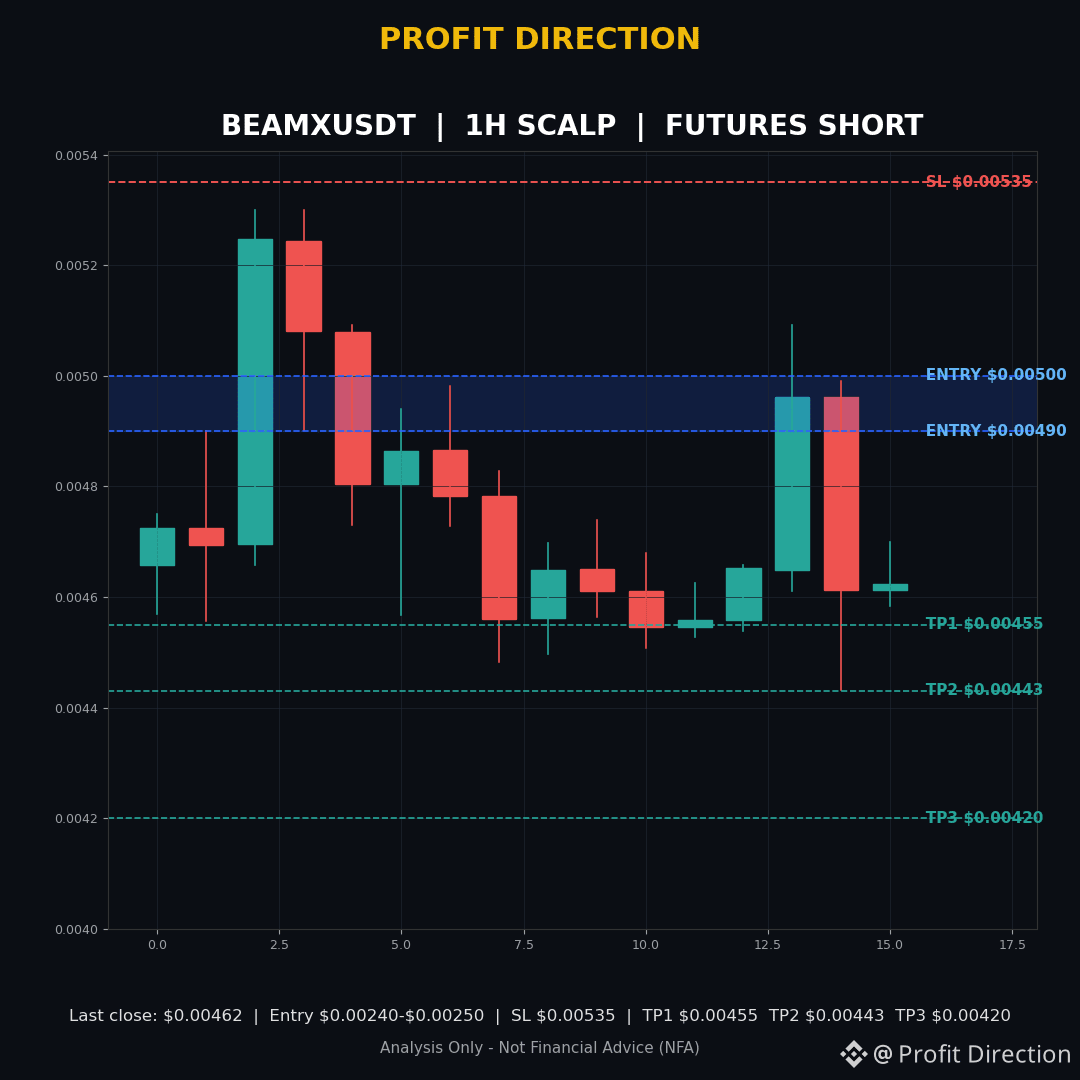
🔴 BEAMXUSDT — FUTURES SHORT (1H SCALP, conditional)
Entry Zone: $0.00490 - $0.00500
SL: $0.00535
TP1: $0.00455
TP2: $0.00443
TP3: $0.00420
R:R: 1:1.00 to TP1, 1:1.30 to TP2, 1:1.88 to TP3 (midpoint $0.00495)
TF: 1H SCALP
BEAMX ran hard to $0.00530, then kept getting turned away near $0.0050 — that is the zone I am watching now.
Why I like this one: price topped twice at $0.00530, rejected again near $0.00509 and $0.00499, and then dropped sharply to $0.00443 on strong volume. That looks like sellers defending the top of the range, not just one random spike. Price is now around $0.00462, below the entry zone, so this is a conditional setup: I am waiting for a retest back into $0.00490-$0.00500 and a rejection there. Do not chase it lower.
Invalidation: a 1H close above $0.00535, above the $0.00530 double top, cancels this short idea.
Analysis Only — Not Financial Advice (NFA). Trading involves risk.
Follow Profit Direction for more signals, best signals and market updates. Share your opinion in the comments.
#BEAMX #BEAMXUSDT #CryptoTrading #FuturesTrading
41

·
--
Artım
Tərcüməyə bax
$BEAMX
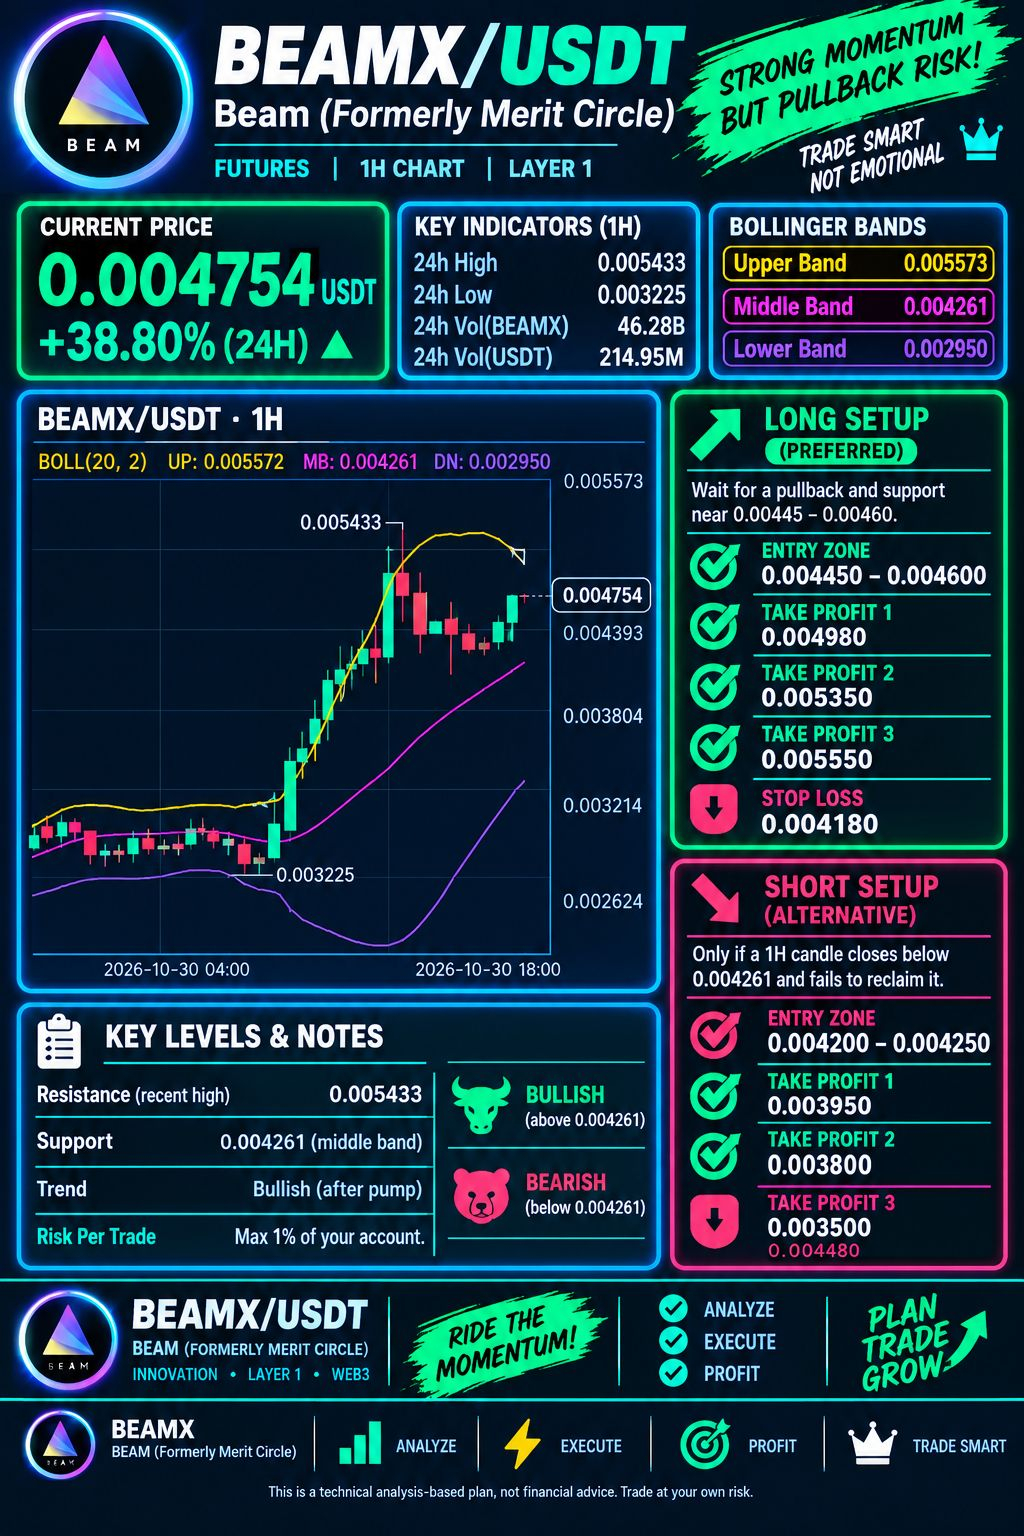
Current price: 0.004754
24h high: 0.005433
24h low: 0.003225
Timeframe: 1H
LONG setup – Preferred
The overall trend is bullish after a strong pump, but price is currently pulling back from 0.005433. Avoid chasing at the current price.
Entry: 0.004450–0.004600
Take Profit 1: 0.004980
Take Profit 2: 0.005350
Take Profit 3: 0.005550
Stop Loss: 0.004180
SHORT setup – Alternative
Only consider SHORT if a 1H candle closes below 0.004261 and price fails to reclaim that level.
Entry: 0.004200–0.004250
Take Profit 1: 0.003950
Take Profit 2: 0.003800
Take Profit 3: 0.003500
Stop Loss: 0.004480
My verdict
LONG is preferred, but wait for support confirmation around 0.00445–0.00460. If support breaks, avoid LONG and watch for the SHORT setup.
Levels are estimates based on your screenshot, not live-verified prices. Use low leverage and risk no more than 1% of your trading account. No setup is guaranteed.
{future}(BEAMXUSDT)
#BEAMX
#BEAMXUSDT
#beamx/usdt
#BEAMXProfits🔥🔥
$BEAMX
Current price: 0.004754
24h high: 0.005433
24h low: 0.003225
Timeframe: 1H
LONG setup – Preferred
The overall trend is bullish after a strong pump, but price is currently pulling back from 0.005433. Avoid chasing at the current price.
Entry: 0.004450–0.004600
Take Profit 1: 0.004980
Take Profit 2: 0.005350
Take Profit 3: 0.005550
Stop Loss: 0.004180
SHORT setup – Alternative
Only consider SHORT if a 1H candle closes below 0.004261 and price fails to reclaim that level.
Entry: 0.004200–0.004250
Take Profit 1: 0.003950
Take Profit 2: 0.003800
Take Profit 3: 0.003500
Stop Loss: 0.004480
My verdict
LONG is preferred, but wait for support confirmation around 0.00445–0.00460. If support breaks, avoid LONG and watch for the SHORT setup.
Levels are estimates based on your screenshot, not live-verified prices. Use low leverage and risk no more than 1% of your trading account. No setup is guaranteed.
#BEAMX
#BEAMXUSDT
#beamx/usdt
#BEAMXProfits🔥🔥
154
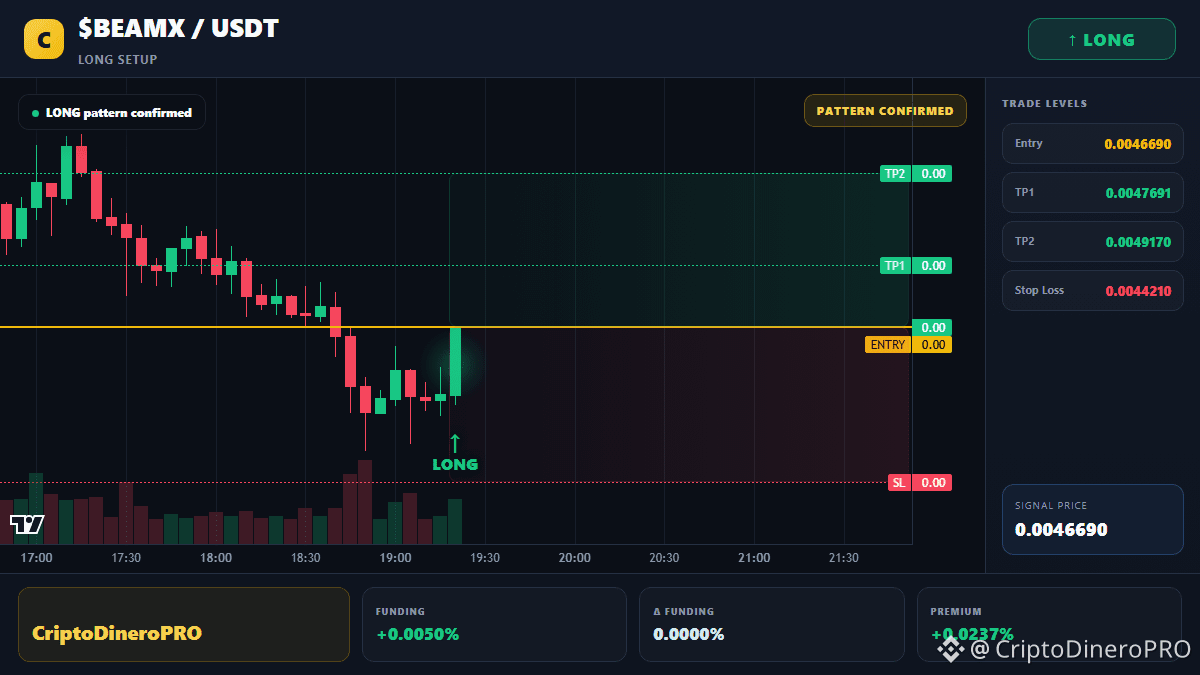
$BEAMX - Qiymət daha da yüksəlir ⬆️
{future}(BEAMXUSDT)
📍 Giriş: 0.00466900
🛑 Stop-loss: 0.00442100-dan aşağı
🎯 Hədəflər:
• TP1: 0.00476908
• TP2: 0.00491700-dan yuxarı
Öz araşdırmanızı aparın.
#BEAMX #BEAMXUSDT
$BEAMX - Qiymət daha da yüksəlir ⬆️
📍 Giriş: 0.00466900
🛑 Stop-loss: 0.00442100-dan aşağı
🎯 Hədəflər:
• TP1: 0.00476908
• TP2: 0.00491700-dan yuxarı
Öz araşdırmanızı aparın.
#BEAMX #BEAMXUSDT
📍 Giriş: 0.00466900
🛑 Stop-loss: 0.00442100-dan aşağı
🎯 Hədəflər:
• TP1: 0.00476908
• TP2: 0.00491700-dan yuxarı
Öz araşdırmanızı aparın.
#BEAMX #BEAMXUSDT
51
Tərcüməyə bax
A 3.0% stop loss translates to a 0.33% risk per percent move, so staying under 3x leverage keeps the trade within a 1% max drawdown. BEAMX is slipping beneath the recent swing low and primed for a short swing.
🔴 $BEAMX SHORT 📉 — Trade Plan
• Entry: $0.004597 – $0.004607
• Stop: $0.004740 (-3.0%)
• Target 1: $0.004533 (+1.5%)
• Target 2: $0.004372 (+5.0%)
• R/R 1:1.7 | Confidence 64%
The market structure broke on a clear CHoCH, the CVD turned bearish confirming the sell pressure, while a fresh FVG aligns with the OB just below the break, creating a POI confluence. Price is now testing the lower edge of that order block, giving a tidy short entry.
A 3.0% SL is relatively tight on this volatile asset, so a max of 2.5‑3x leverage keeps the risk profile sane.
Take half off the table once price hits the first target around the next minor resistance.
DYOR — this isn't financial advice, size your risk accordingly 🙏
$BEAMX #BEAMXUSDT #FedWatch #TradingSignals #Write2Earn
2

·
--
Tərcüməyə bax
🔴 $BEAMX /USDT — SHORT SIGNAL (High Risk)
📊 Trade Plan
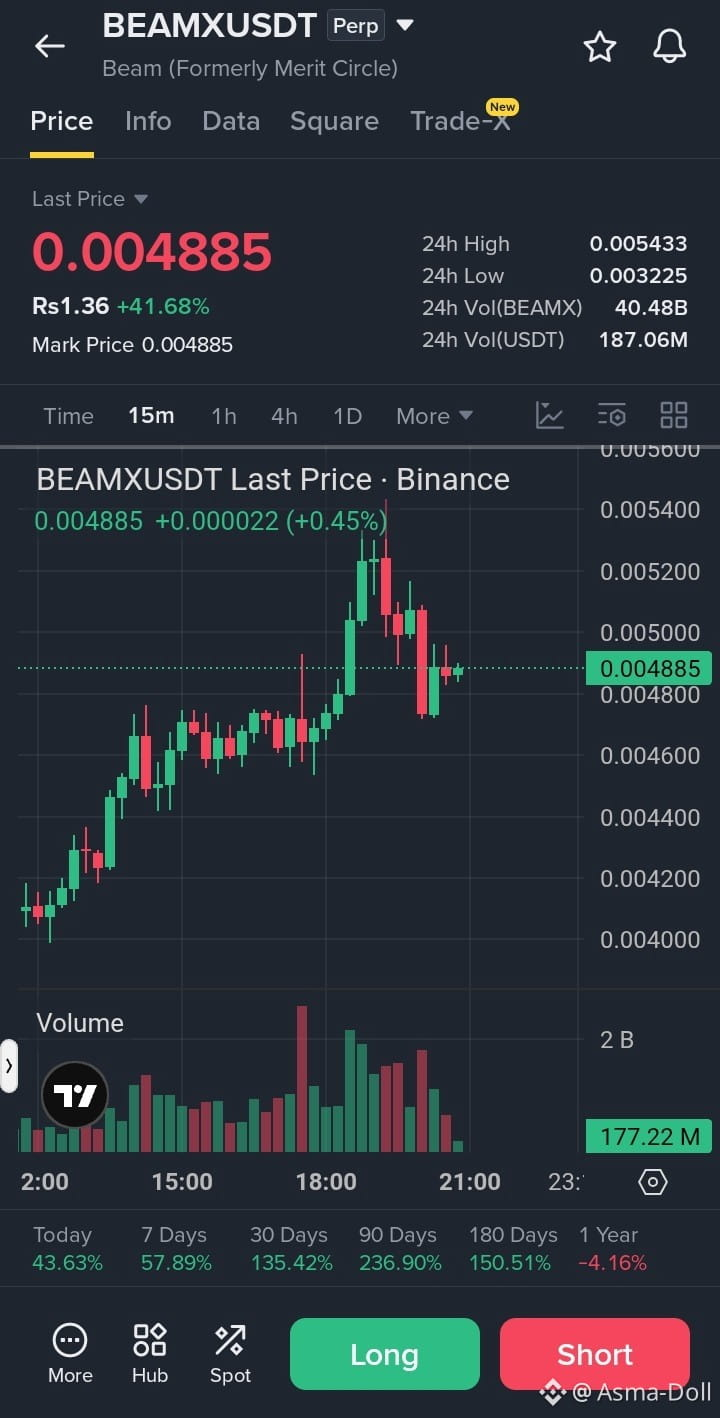
Current Price: 0.004885
Entry Zone: 0.004950 – 0.005100
Stop Loss (SL): 0.005480
TP1: 0.004700
TP2: 0.004450
TP3: 0.004200
Trade here $BEAMX
{future}(BEAMXUSDT)
📉 Analysis:
Price is up 41.68% in 24 hours, indicating a strong pump.
Resistance is near the 24h high of 0.005433.
After a sharp rally, profit-taking may trigger a pullback.
Shorting immediately is risky because bullish momentum may continue.
✅ Confirmation:
Wait for rejection near 0.004950–0.005100.
Look for a bearish candle and selling-volume increase.
Breakdown below 0.004800 may support further downside.
Invalidate the short setup if price breaks above 0.005433 with strong momentum.
⚖️ Risk-to-Reward:
At entry 0.005000 and SL 0.005480:
TP1: approximately 0.63:1
TP2: approximately 1.15:1
TP3: approximately 1.67:1
⚠️ TP1 offers a poor risk-to-reward ratio. Consider waiting for a better entry or skipping the trade if confirmation is absent. This setup is based on the supplied snapshot, not verified live chart data.
#BEAMX #BEAMXUSDT #CryptoTrading #BinanceFutures #ShortSignal
🔴 $BEAMX /USDT — SHORT SIGNAL (High Risk)
📊 Trade Plan
Current Price: 0.004885
Entry Zone: 0.004950 – 0.005100
Stop Loss (SL): 0.005480
TP1: 0.004700
TP2: 0.004450
TP3: 0.004200
Trade here $BEAMX
📉 Analysis:
Price is up 41.68% in 24 hours, indicating a strong pump.
Resistance is near the 24h high of 0.005433.
After a sharp rally, profit-taking may trigger a pullback.
Shorting immediately is risky because bullish momentum may continue.
✅ Confirmation:
Wait for rejection near 0.004950–0.005100.
Look for a bearish candle and selling-volume increase.
Breakdown below 0.004800 may support further downside.
Invalidate the short setup if price breaks above 0.005433 with strong momentum.
⚖️ Risk-to-Reward:
At entry 0.005000 and SL 0.005480:
TP1: approximately 0.63:1
TP2: approximately 1.15:1
TP3: approximately 1.67:1
⚠️ TP1 offers a poor risk-to-reward ratio. Consider waiting for a better entry or skipping the trade if confirmation is absent. This setup is based on the supplied snapshot, not verified live chart data.
#BEAMX #BEAMXUSDT #CryptoTrading #BinanceFutures #ShortSignal
1
128

Tərcüməyə bax
$BEAMX
BEAMXUSD: Don't Just Watch the Price, Watch the Trend!
BEAMXUSD is a coin worth keeping on your watchlist. But remember, a sudden price move doesn't always mean a strong trend is starting.
What should traders watch?
Green candles with strong volume may show buying interest.
Red candles may indicate selling pressure.
A breakout above resistance could bring fresh buying.
If support breaks, more downside is possible.
My trading tip: Don't rush into a trade. Wait for confirmation, watch volume, and manage your risk.
Are you watching BEAMXUSD for a possible breakout or waiting for a better entry?
#BEAMXUSDT #cryptotrading #BinanceSquare #TradingTips
198

·
--
Artım
Tərcüməyə bax
$BEAMX
{spot}(BEAMXUSDT)
just gave a heart attack candle!
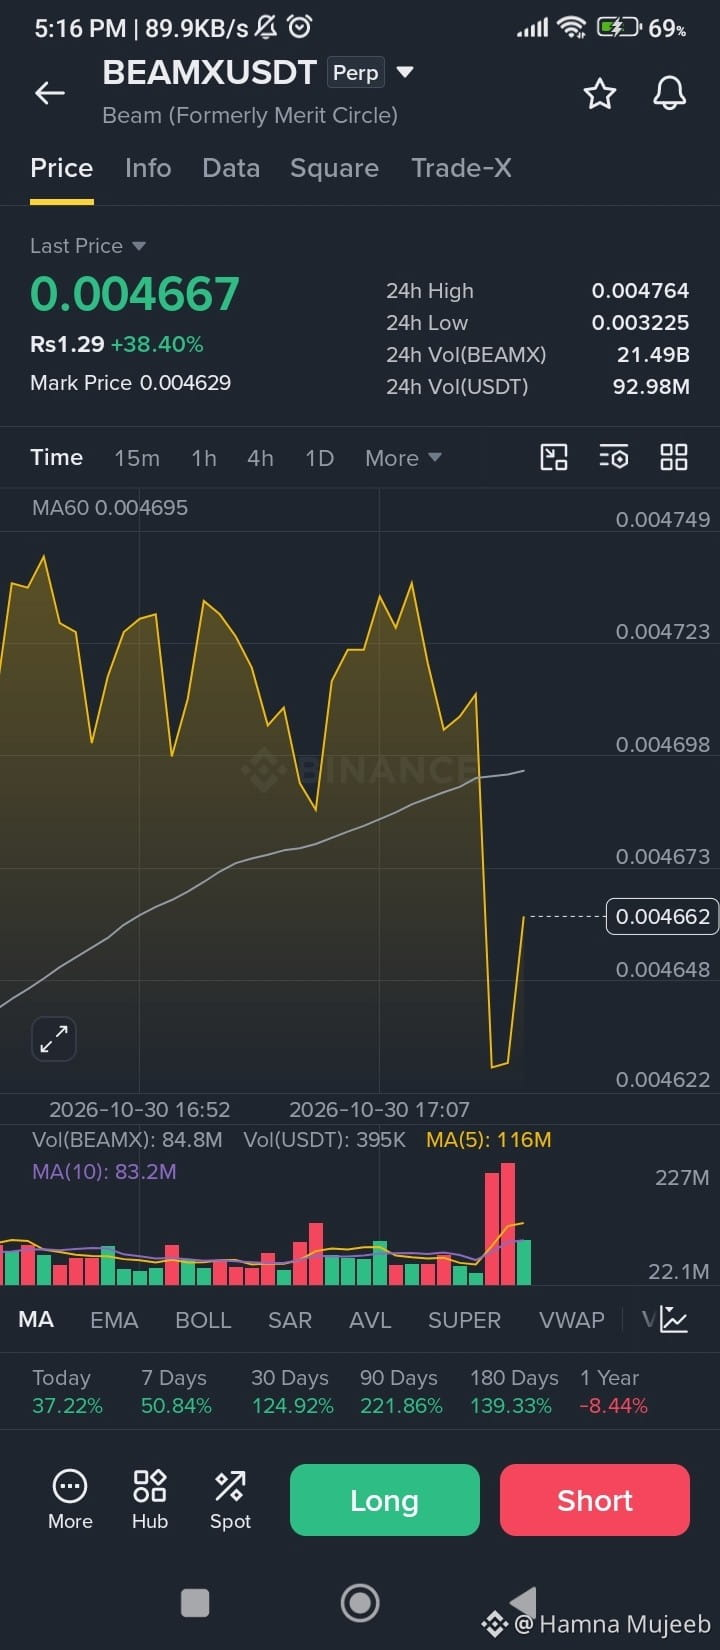
Look at this chart - Straight dump to $0.004622 then vertical V-reversal back to $0.004667. Classic stop-loss hunt.
DATA FROM CHART:
Last Price: 0.004667 / Rs1.29 +38.40%
24h High: 0.004764 | 24h Low: 0.003225 = 32% range
24h Vol: 21.49B BEAMX / 92.98M USDT - Whales active
Mark Price: 0.004629
PERFORMANCE:
Today: +37.22% | 7 Days: +50.84% | 30 Days: +124.92% | 90 Days: +221.86%
Volume spike on the wick: 116M MA(5) vs 84.8M - Someone bought the dip HARD.
This is how Beam (Formerly Merit Circle) moves - shakeout then moon. If you held through that wick, you are a legend.
#BEAMX #BEAMXUSDT #EarningsSeason
$BEAMX
just gave a heart attack candle!
Look at this chart - Straight dump to $0.004622 then vertical V-reversal back to $0.004667. Classic stop-loss hunt.
DATA FROM CHART:
Last Price: 0.004667 / Rs1.29 +38.40%
24h High: 0.004764 | 24h Low: 0.003225 = 32% range
24h Vol: 21.49B BEAMX / 92.98M USDT - Whales active
Mark Price: 0.004629
PERFORMANCE:
Today: +37.22% | 7 Days: +50.84% | 30 Days: +124.92% | 90 Days: +221.86%
Volume spike on the wick: 116M MA(5) vs 84.8M - Someone bought the dip HARD.
This is how Beam (Formerly Merit Circle) moves - shakeout then moon. If you held through that wick, you are a legend.
#BEAMX #BEAMXUSDT #EarningsSeason
1
243

·
--
Tərcüməyə bax
$BEAMX 这单认错,先下车
结果:-1.60U | 持仓 20 分钟 | 1R保本
最高跑过 +2.1%,最低到过 -1.9%
先活着,下一笔才有资格赚
复盘记录,不构成建议。DYOR
#BEAMXUSDT
$BEAMX 这单认错,先下车
结果:-1.60U | 持仓 20 分钟 | 1R保本
最高跑过 +2.1%,最低到过 -1.9%
先活着,下一笔才有资格赚
复盘记录,不构成建议。DYOR
#BEAMXUSDT
结果:-1.60U | 持仓 20 分钟 | 1R保本
最高跑过 +2.1%,最低到过 -1.9%
先活着,下一笔才有资格赚
复盘记录,不构成建议。DYOR
#BEAMXUSDT
10U小老弟:
这逼玩意没意思都不回调的
1
2k

Tərcüməyə bax
🚀 $BEAMX IS WAKING UP AGAIN! ARE BULLS PREPARING ANOTHER RALLY?
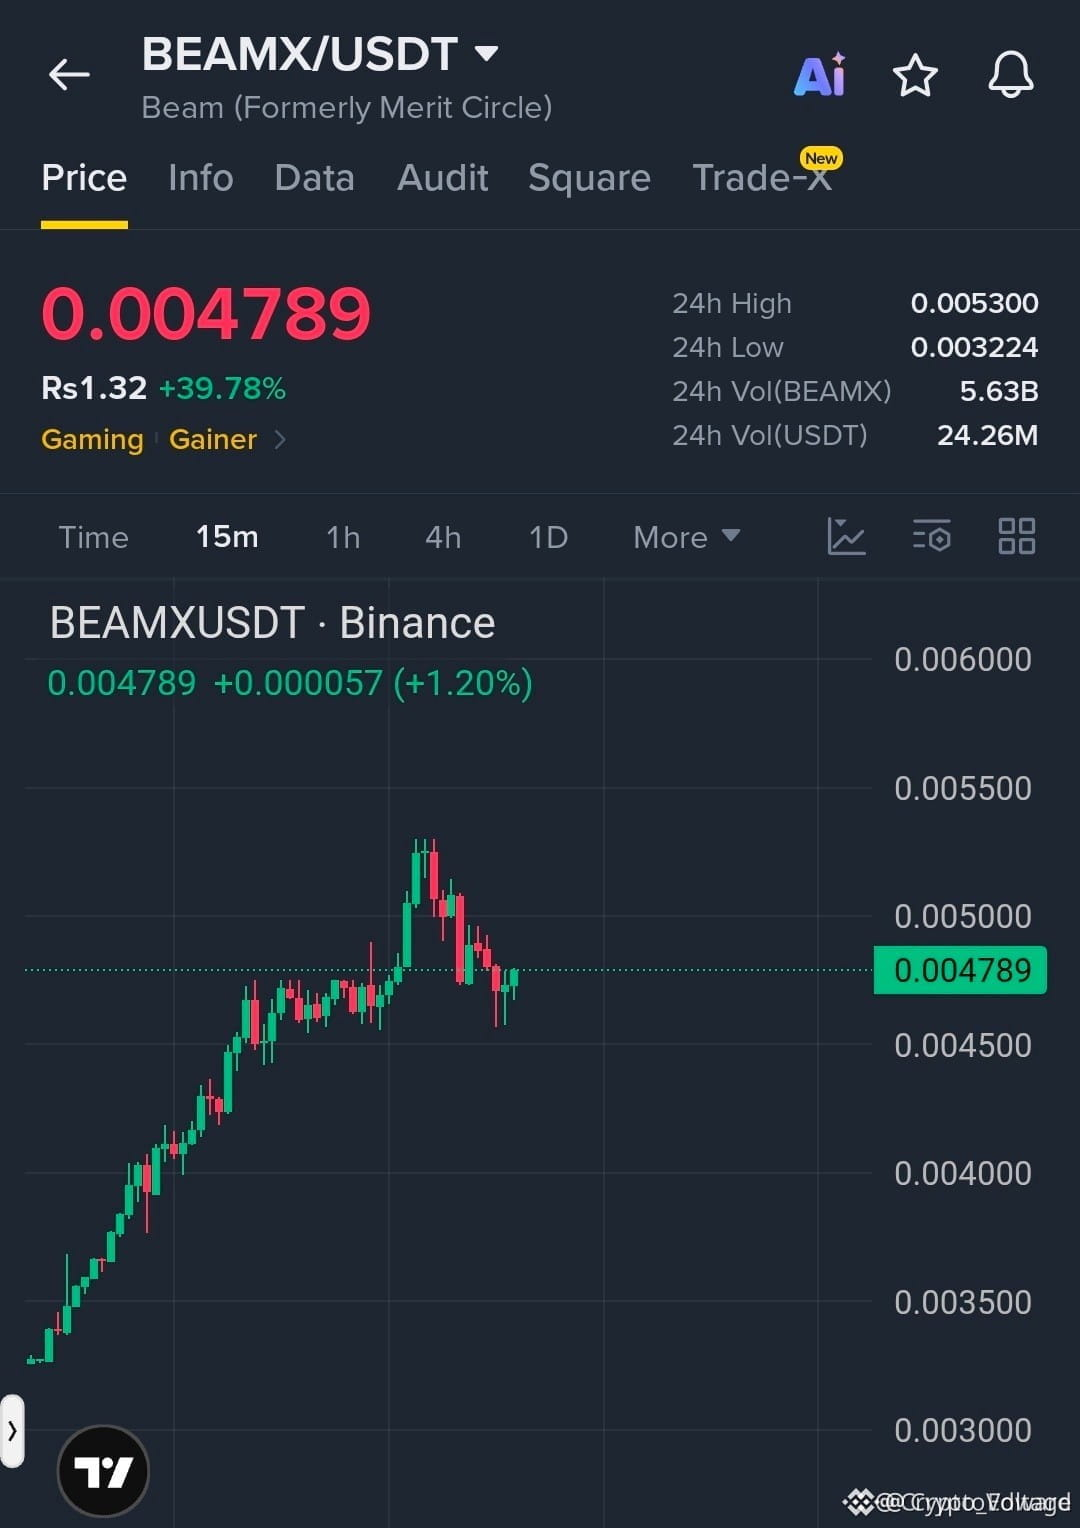
After a healthy pullback, $BEAMX is showing signs of recovery. Buyers are stepping back in, and the $0.0046 support zone is becoming an important level to watch.
📊 Key Levels to Watch:
- Support: $0.0046
{spot}(BEAMXUSDT)
- Breakout Level: $0.0050
- TP1: $0.0053
📈 Bullish Scenario:
If buyers manage to push price above $0.0050 with strong volume, another upward move could follow.
However, losing the $0.0046 support would weaken the bullish outlook.
The recovery looks interesting, but confirmation is important. Don't chase the price blindly.
🔥 Can $BEAMX break $0.0050 and start another rally?
#BEAMX #BEAMXUSDT #altcoins #cryptotrading #BinanceSquare
🚀 $BEAMX IS WAKING UP AGAIN! ARE BULLS PREPARING ANOTHER RALLY?
After a healthy pullback, $BEAMX is showing signs of recovery. Buyers are stepping back in, and the $0.0046 support zone is becoming an important level to watch.
📊 Key Levels to Watch:
- Support: $0.0046
- Breakout Level: $0.0050
- TP1: $0.0053
📈 Bullish Scenario:
If buyers manage to push price above $0.0050 with strong volume, another upward move could follow.
However, losing the $0.0046 support would weaken the bullish outlook.
The recovery looks interesting, but confirmation is important. Don't chase the price blindly.
🔥 Can $BEAMX break $0.0050 and start another rally?
#BEAMX #BEAMXUSDT #altcoins #cryptotrading #BinanceSquare
85

Tərcüməyə bax
$BEAMX
🚀 BEAMX/USDT Technical Analysis & Trade Plan: Riding the Momentum Safely!
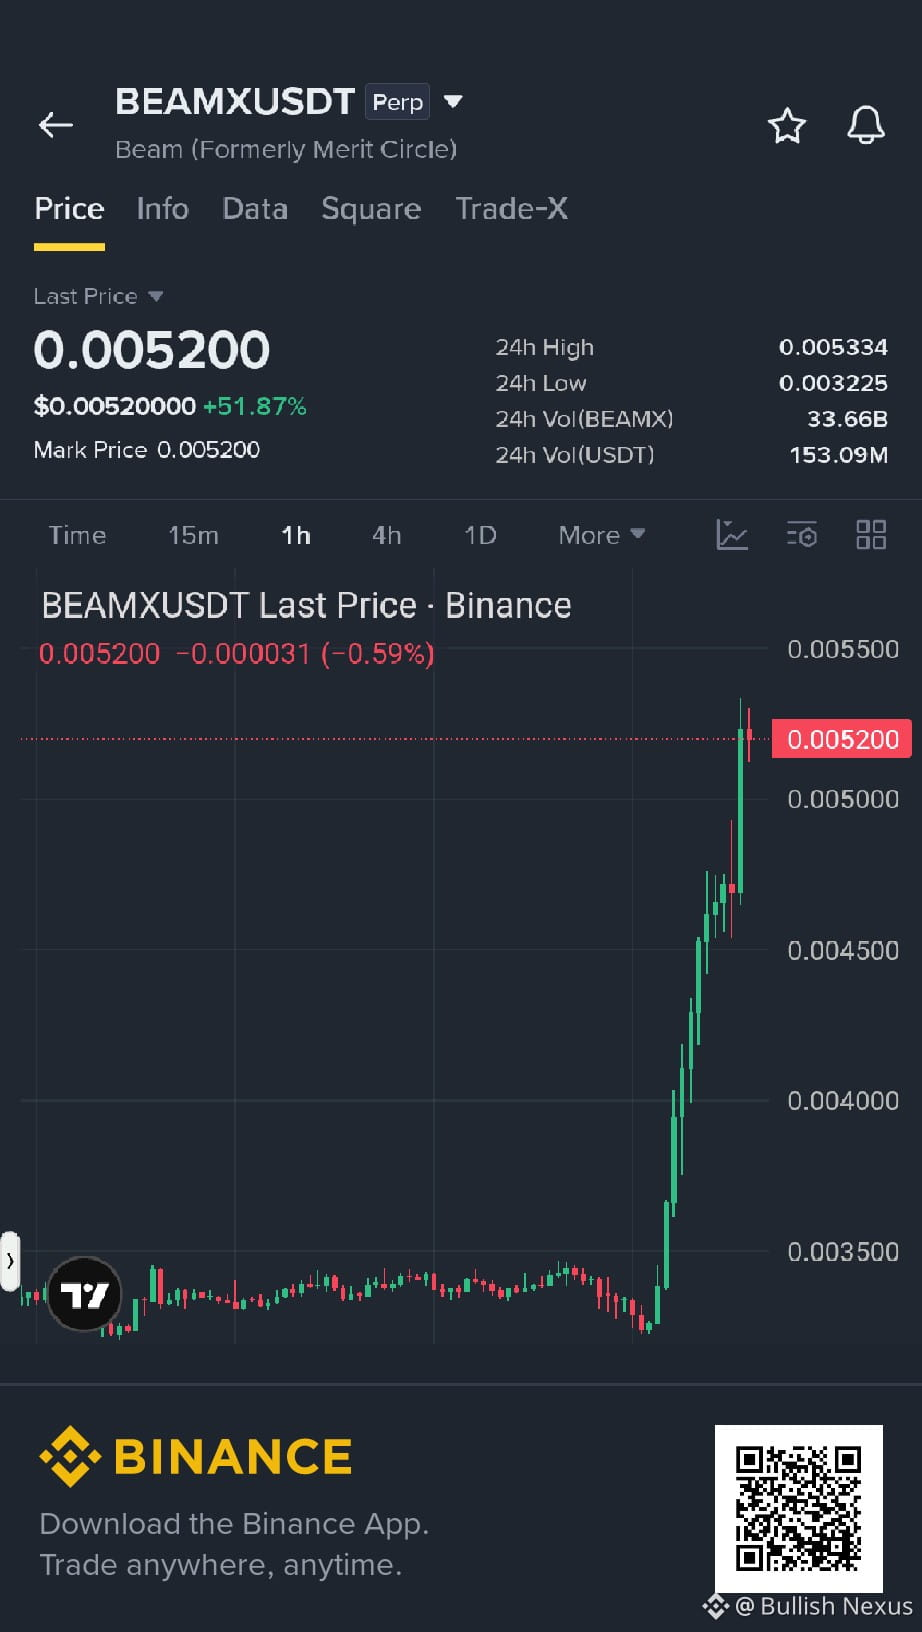
BEAMX has shown an aggressive vertical expansion, pumping over 50% in the last 24 hours and hitting a local high near $0.005334. With momentum running extremely high, here is how you should approach the next move on the 1h and 4h timeframes:
📊 Market Structure & Indicators
4h Chart: Massive impulsive breakout candle breaking away cleanly from moving averages. However, the 4h RSI(6) is at 95.71 and StochRSI is pinned at 100.00.
1h Chart: Parabolic push with 1h RSI(6) at 88.77 and StochRSI near 96.49.
Takeaway: The asset is heavily overbought in the short term. Chasing green candles right at resistance is risky; patience for a healthy pullback will offer a much better risk-to-reward ratio.
🎯 Trade Setup (Pullback Strategy)
Entry Zone (Dips): Look for entries if the price cools off and retests the support zone around $0.004500 – $0.004750.
Stop-Loss (SL): $0.004050 (Strictly placed below recent consolidation to invalidate the setup if momentum fails).
Take-Profit Targets (TP):
TP1: $0.005330 (Recent high test)
TP2: $0.005800 (Next psychological level)
TP3: $0.006400 (Higher timeframe extension)
What are your thoughts on BEAMX? Are you waiting for a dip or expecting an immediate continuation? Let me know below! 👇
#BEAMXUSDT
1
189
Daha çox kontent araşdırmaq üçün daxil olun
Binance Square-də qlobal kriptovalyuta istifadəçilərinə qoşulun
⚡️ Kriptovalyuta haqqında ən son və faydalı məlumatları əldə edin.
💬 Dünyanın ən böyük kriptovalyuta birjası tərəfindən etibar edilir.
👍 Doğrulanmış yaradıcılardan gələn real məlumatları kəşf edin.
E-poçt/Telefon nömrəsi
Trenddə olan mövzular
1
#BinanceSAFUFundTransferCompleted7499BTC
18,433 baxış
Müzakirə edir: 515
2
#BinanceRecovery90% of stolen assets
76,912 baxış
Müzakirə edir: 138
3
#YiHe:ProofOfReserves:10TokensAt100%Backing
98,336 baxış
Müzakirə edir: 594
4
#BackedNotBroken:RichardTengSaysUsersBearNoLoss
15,567 baxış
Müzakirə edir: 367
5
#CZSaysCompensationIsinPlaceUsersAreProtected
96,966 baxış
Müzakirə edir: 1,254
6
#IntelHasItsWorstDaySince1974
33,036 baxış
Müzakirə edir: 617
7
#TRMCambodianCasinosReceived$1.07BInCrypto
8,235 baxış
Müzakirə edir: 61
8
#USDCCirculationFallsAbout800MInSevenDays
54,904 baxış
Müzakirə edir: 664
9
#SuspectedNorthKoreaAttacksAccountForNearly89%OfCryptoHackLosses
12,822 baxış
Müzakirə edir: 88
10
#OpenAICutsFundraisingTargetBy$10B
2,881 baxış
Müzakirə edir: 68