

#200weekma
200weekma
125 baxış
Müzakirə edir: 7
Populyar
Sonuncu

·
--
Məqalə
Tərcüməyə bax
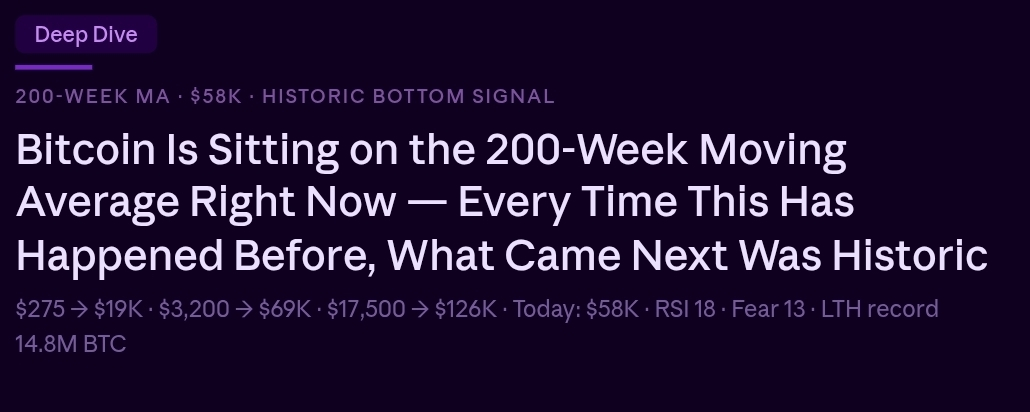
Bitcoin Is Sitting on the 200-Week Moving Average Right Now — Every Single Time This Has Happened BeI want to show you the single most important chart in crypto right now — not because it guarantees anything, but because it has the most consistent track record of any technical indicator in Bitcoin's 15-year history.
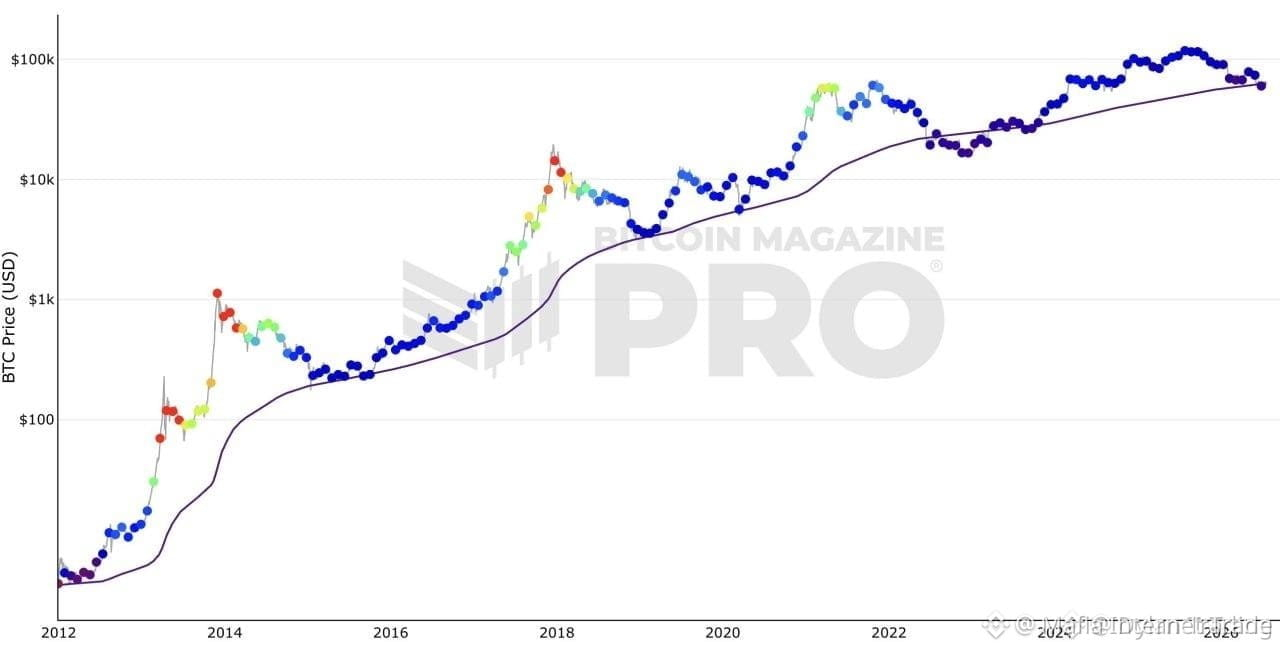
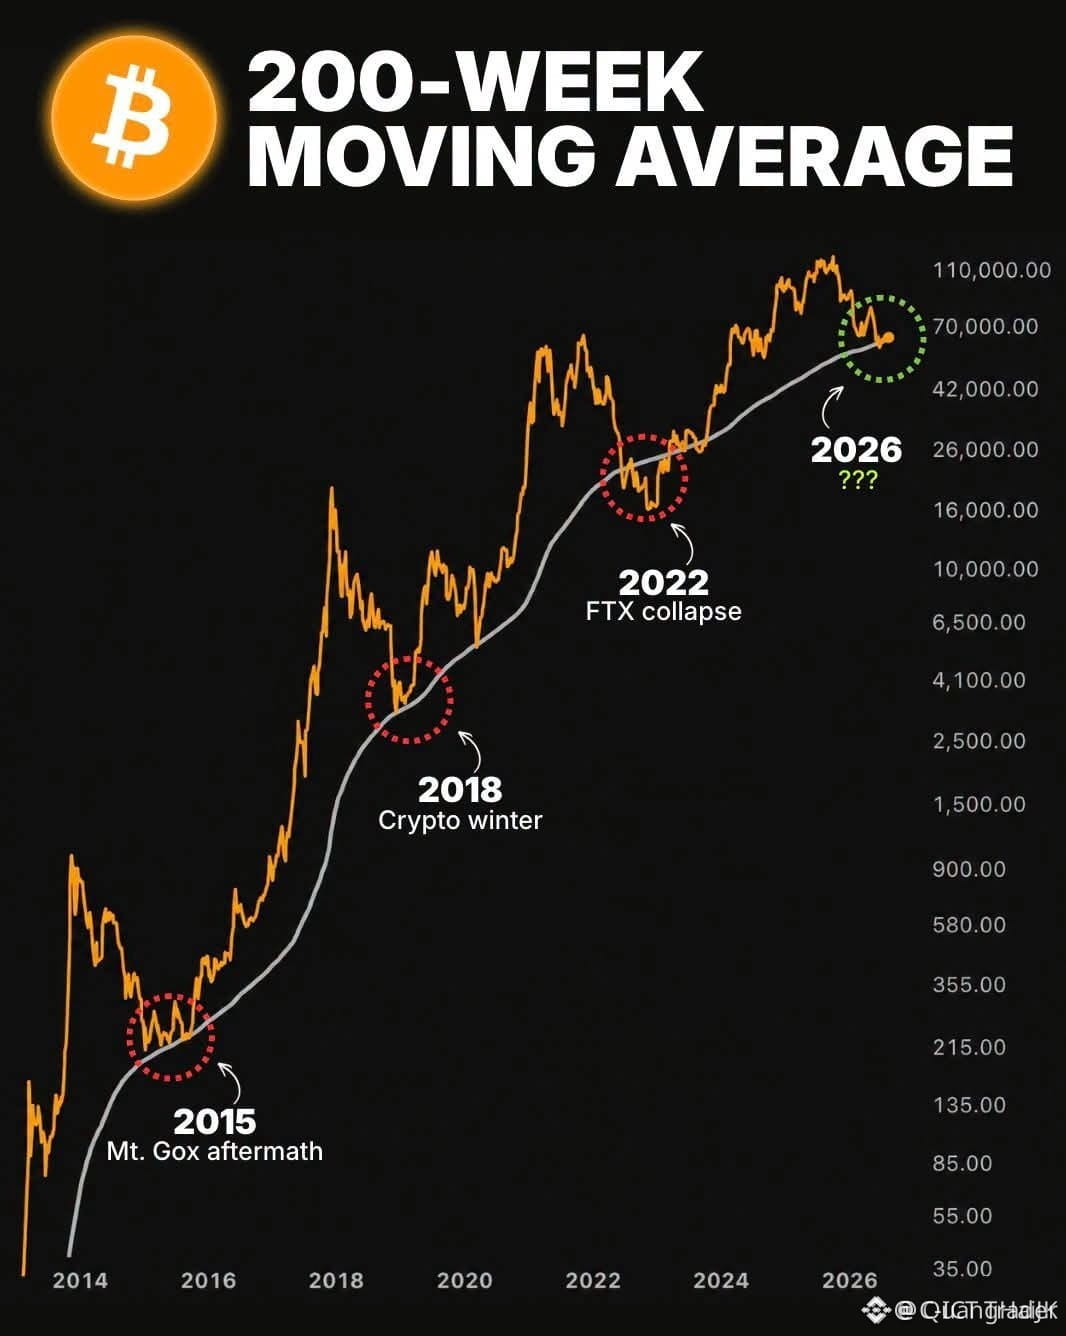
The 200-week moving average — a simple average of Bitcoin's closing price over the most recent 200 weeks, roughly four full years. It has marked the macro bottom of every major Bitcoin bear market since 2015.
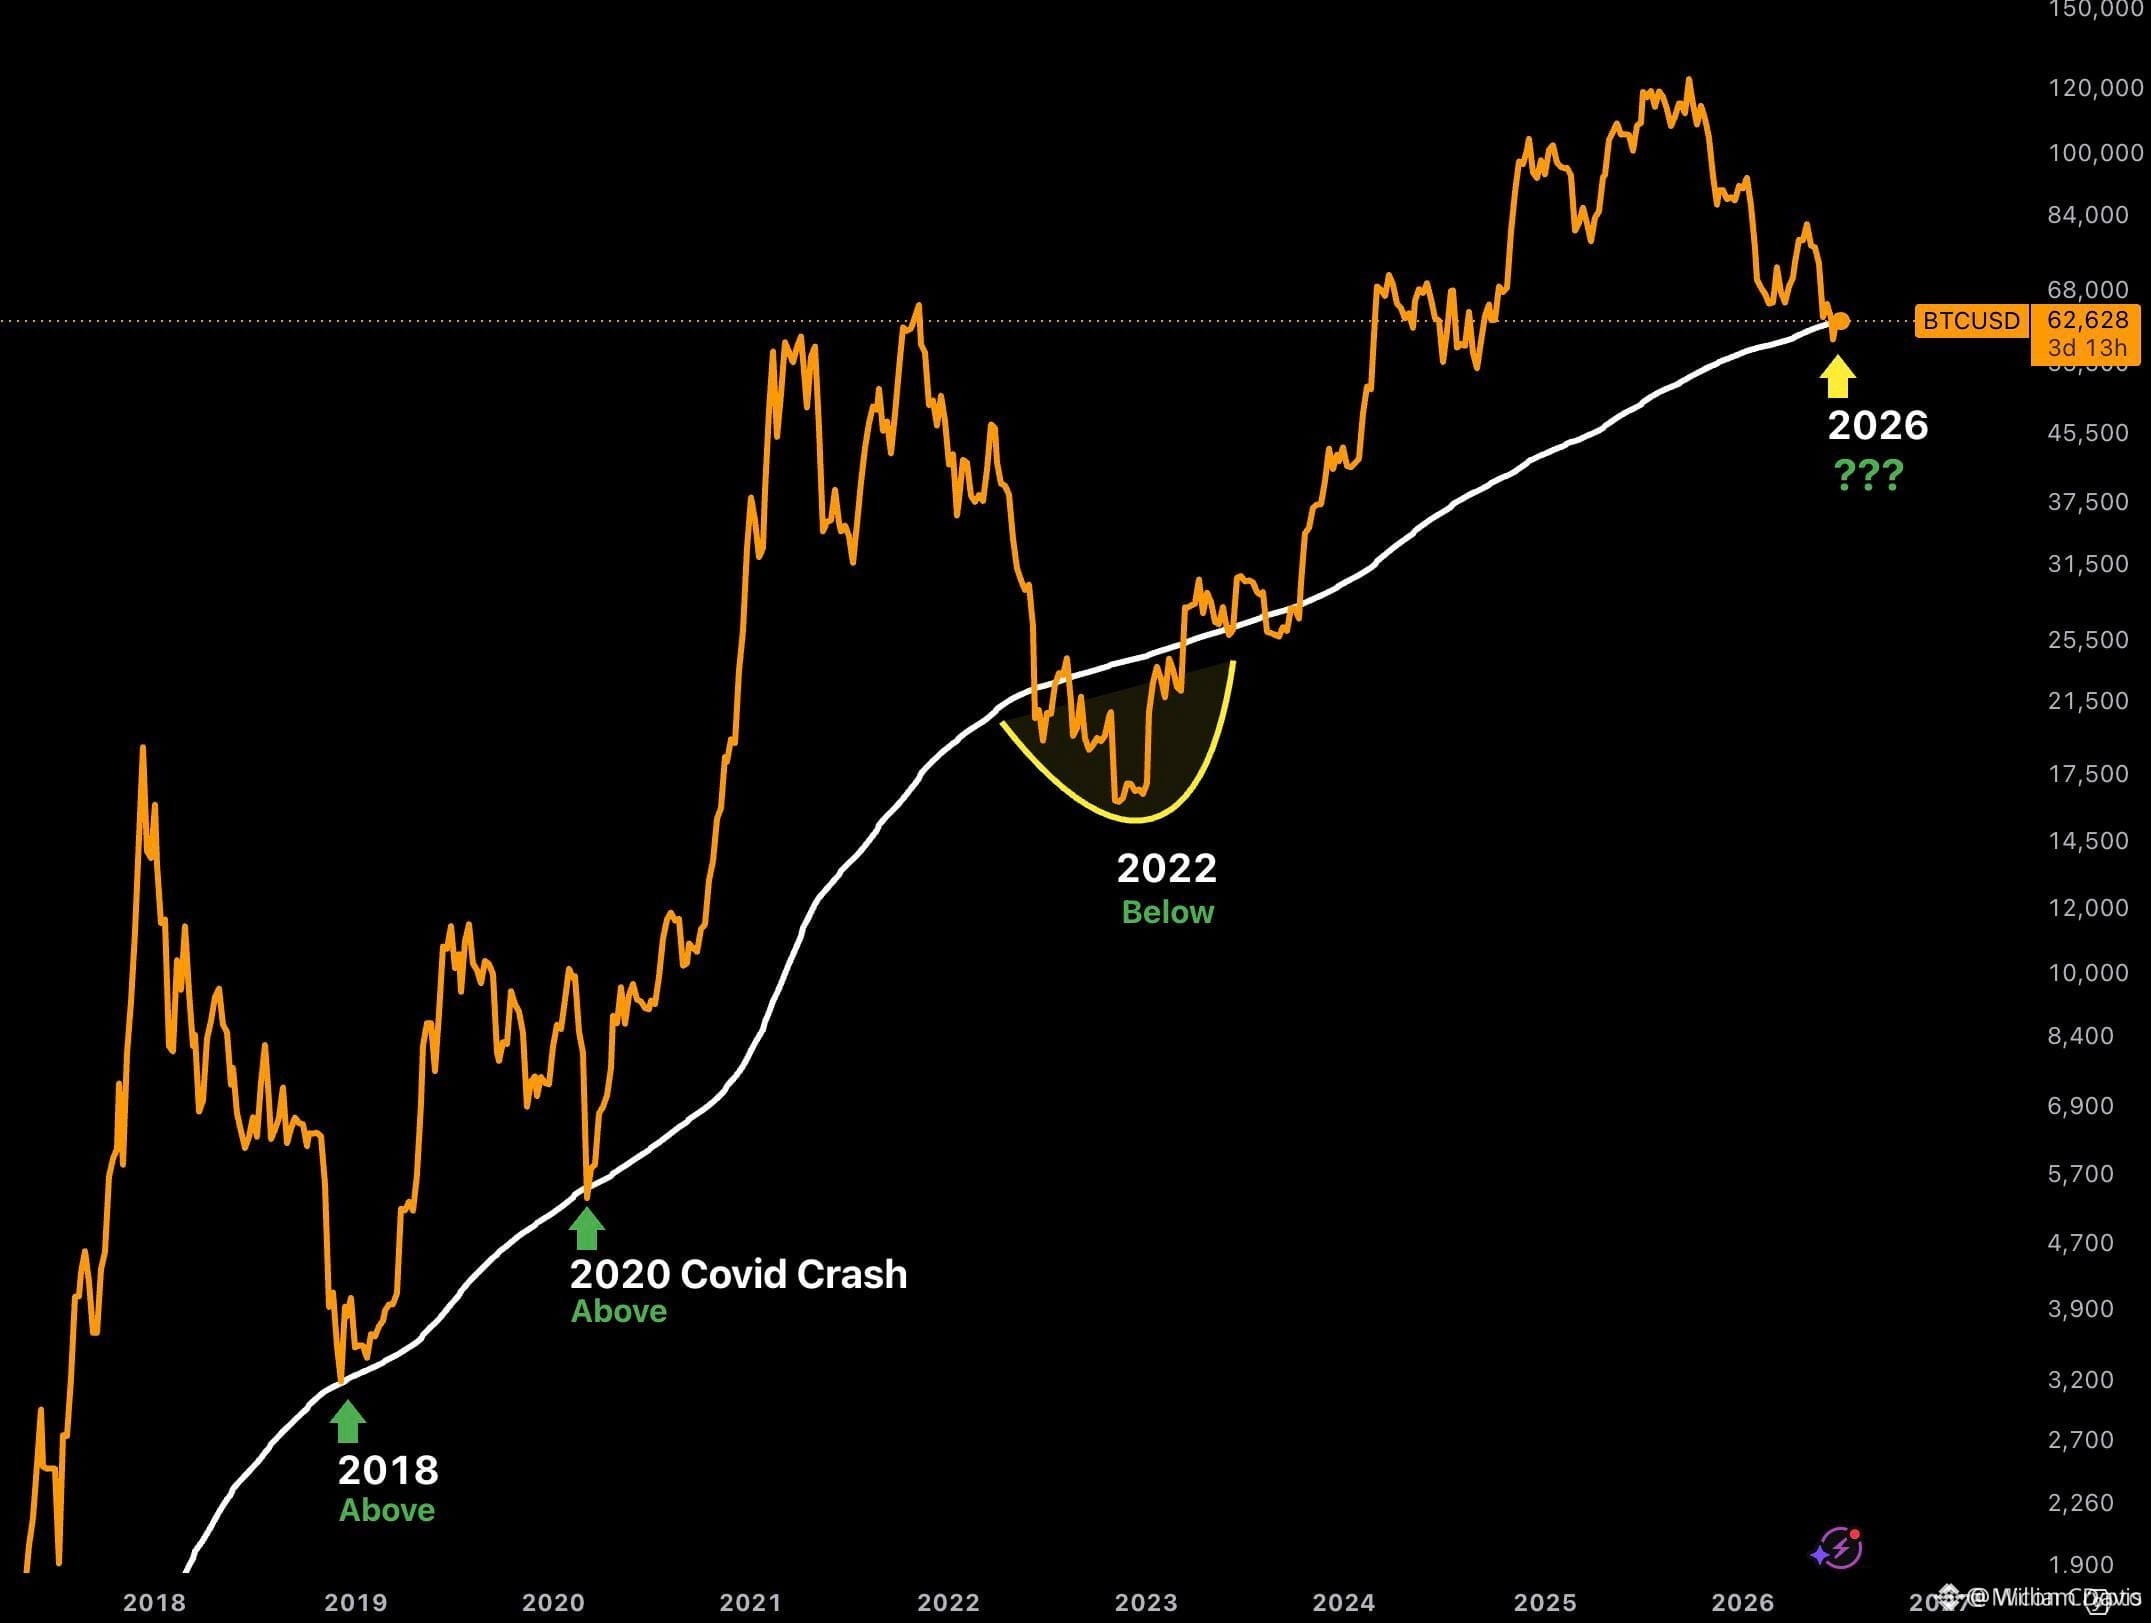
In 2015, Bitcoin touched the 200-week MA at $275 and then rallied to $19,000 in 2017.
In 2018, Bitcoin touched $3,200 and then rallied to $69,000 in 2021.
In 2022, Bitcoin briefly broke below it at $17,500 before recovering and then rallying to $126,200 in 2025.
Today, the 200-week MA sits at approximately $58,000–$62,000, depending on the data source. Bitcoin's intraday low on June 26 was $58,189. We are sitting on the line.
Galaxy Digital identified $58,000 as the specific floor that anchors the indicator's historical significance. Multiple analysts across TradingKey, CoinDesk, and CoinStats all flagged this level simultaneously this week. The RSI at 18 — one of the most oversold readings Bitcoin has ever printed. The Fear & Greed Index at 13–16 — deep Extreme Fear. Miner daily profits are approaching negative — meaning small miners are shutting down, which historically precedes a difficulty adjustment and price recovery.
Does this mean Bitcoin bottoms here? History says more likely than not. Does it guarantee it? Nothing in markets is guaranteed.
What the data says: 21Shares in their semi-annual report this week called the current trajectory "broadly similar" to past post-halving performances and reiterated a $100,000 year-end target. Long-term holders control a record 14.8 million BTC and none are selling. Bitcoin supply in loss hit 10.83 million — a record — and price held above the 200-week MA.
The next 200-week MA test after this one, if it fails, sits at approximately $42,000–$44,000. That is the downside scenario if Monday's ETF flows stay deeply negative after yesterday's options expiry.
But right now, today, June 27 — Bitcoin is sitting exactly where it has historically bottomed. That is not nothing.
Please subscribe, like, and share this article. It genuinely helps.
#Bitcoin #BTC走势分析 C #200WeekMA #TechnicalAnalysis #BinanceSquare
Bitcoin Is Sitting on the 200-Week Moving Average Right Now — Every Single Time This Has Happened Be
I want to show you the single most important chart in crypto right now — not because it guarantees anything, but because it has the most consistent track record of any technical indicator in Bitcoin's 15-year history.
The 200-week moving average — a simple average of Bitcoin's closing price over the most recent 200 weeks, roughly four full years. It has marked the macro bottom of every major Bitcoin bear market since 2015.
In 2015, Bitcoin touched the 200-week MA at $275 and then rallied to $19,000 in 2017.
In 2018, Bitcoin touched $3,200 and then rallied to $69,000 in 2021.
In 2022, Bitcoin briefly broke below it at $17,500 before recovering and then rallying to $126,200 in 2025.
Today, the 200-week MA sits at approximately $58,000–$62,000, depending on the data source. Bitcoin's intraday low on June 26 was $58,189. We are sitting on the line.
Galaxy Digital identified $58,000 as the specific floor that anchors the indicator's historical significance. Multiple analysts across TradingKey, CoinDesk, and CoinStats all flagged this level simultaneously this week. The RSI at 18 — one of the most oversold readings Bitcoin has ever printed. The Fear & Greed Index at 13–16 — deep Extreme Fear. Miner daily profits are approaching negative — meaning small miners are shutting down, which historically precedes a difficulty adjustment and price recovery.
Does this mean Bitcoin bottoms here? History says more likely than not. Does it guarantee it? Nothing in markets is guaranteed.
What the data says: 21Shares in their semi-annual report this week called the current trajectory "broadly similar" to past post-halving performances and reiterated a $100,000 year-end target. Long-term holders control a record 14.8 million BTC and none are selling. Bitcoin supply in loss hit 10.83 million — a record — and price held above the 200-week MA.
The next 200-week MA test after this one, if it fails, sits at approximately $42,000–$44,000. That is the downside scenario if Monday's ETF flows stay deeply negative after yesterday's options expiry.
But right now, today, June 27 — Bitcoin is sitting exactly where it has historically bottomed. That is not nothing.
Please subscribe, like, and share this article. It genuinely helps.
#Bitcoin #BTC走势分析 C #200WeekMA #TechnicalAnalysis #BinanceSquare
The 200-week moving average — a simple average of Bitcoin's closing price over the most recent 200 weeks, roughly four full years. It has marked the macro bottom of every major Bitcoin bear market since 2015.
In 2015, Bitcoin touched the 200-week MA at $275 and then rallied to $19,000 in 2017.
In 2018, Bitcoin touched $3,200 and then rallied to $69,000 in 2021.
In 2022, Bitcoin briefly broke below it at $17,500 before recovering and then rallying to $126,200 in 2025.
Today, the 200-week MA sits at approximately $58,000–$62,000, depending on the data source. Bitcoin's intraday low on June 26 was $58,189. We are sitting on the line.
Galaxy Digital identified $58,000 as the specific floor that anchors the indicator's historical significance. Multiple analysts across TradingKey, CoinDesk, and CoinStats all flagged this level simultaneously this week. The RSI at 18 — one of the most oversold readings Bitcoin has ever printed. The Fear & Greed Index at 13–16 — deep Extreme Fear. Miner daily profits are approaching negative — meaning small miners are shutting down, which historically precedes a difficulty adjustment and price recovery.
Does this mean Bitcoin bottoms here? History says more likely than not. Does it guarantee it? Nothing in markets is guaranteed.
What the data says: 21Shares in their semi-annual report this week called the current trajectory "broadly similar" to past post-halving performances and reiterated a $100,000 year-end target. Long-term holders control a record 14.8 million BTC and none are selling. Bitcoin supply in loss hit 10.83 million — a record — and price held above the 200-week MA.
The next 200-week MA test after this one, if it fails, sits at approximately $42,000–$44,000. That is the downside scenario if Monday's ETF flows stay deeply negative after yesterday's options expiry.
But right now, today, June 27 — Bitcoin is sitting exactly where it has historically bottomed. That is not nothing.
Please subscribe, like, and share this article. It genuinely helps.
#Bitcoin #BTC走势分析 C #200WeekMA #TechnicalAnalysis #BinanceSquare
45

$BTC SURGES PAST THE 200-WEEK MA — A CLASSIC BULL SIGNAL 🔥
Girişdə konkret qiymət səviyyələri verilməyib — ticarət siqnalı bölməsi buraxılıb.
Bitcoin $63k-da 200 həftəlik hərəkətli ortalamanı yenidən bərpa edib və bu səs-küy deyil. Bu səviyyə illərdir uzunmüddətli trend filtri kimi işləyir — BTC bu səviyyənin üstündə dayandıqda, növbəti mərhələ izləyib. Biz bu dəyişikliyi saxta sıçrayış yox, real impulsla görürük.
Sual budur: bu, davamlı yüksəlişin başlanğıcıdır, yoxsa əsas səviyyənin üstündə sadəcə bir iynə (wick)? Burada sənin hərəkətin nə olacaq?
Maliyyə məsləhəti deyil. Həmişə riskini idarə et.
#BTC #Bullish #200WeekMA #Crypto
🔥
$BTC SURGES PAST THE 200-WEEK MA — A CLASSIC BULL SIGNAL 🔥
Girişdə konkret qiymət səviyyələri verilməyib — ticarət siqnalı bölməsi buraxılıb.
Bitcoin $63k-da 200 həftəlik hərəkətli ortalamanı yenidən bərpa edib və bu səs-küy deyil. Bu səviyyə illərdir uzunmüddətli trend filtri kimi işləyir — BTC bu səviyyənin üstündə dayandıqda, növbəti mərhələ izləyib. Biz bu dəyişikliyi saxta sıçrayış yox, real impulsla görürük.
Sual budur: bu, davamlı yüksəlişin başlanğıcıdır, yoxsa əsas səviyyənin üstündə sadəcə bir iynə (wick)? Burada sənin hərəkətin nə olacaq?
Maliyyə məsləhəti deyil. Həmişə riskini idarə et.
#BTC #Bullish #200WeekMA #Crypto
🔥
Girişdə konkret qiymət səviyyələri verilməyib — ticarət siqnalı bölməsi buraxılıb.
Bitcoin $63k-da 200 həftəlik hərəkətli ortalamanı yenidən bərpa edib və bu səs-küy deyil. Bu səviyyə illərdir uzunmüddətli trend filtri kimi işləyir — BTC bu səviyyənin üstündə dayandıqda, növbəti mərhələ izləyib. Biz bu dəyişikliyi saxta sıçrayış yox, real impulsla görürük.
Sual budur: bu, davamlı yüksəlişin başlanğıcıdır, yoxsa əsas səviyyənin üstündə sadəcə bir iynə (wick)? Burada sənin hərəkətin nə olacaq?
Maliyyə məsləhəti deyil. Həmişə riskini idarə et.
#BTC #Bullish #200WeekMA #Crypto
🔥
31
$BTC $57K LİKİDİTLIK TƏMİZLƏNMƏSİNDƏN SONRA 200 HƏFTƏLİK MA-DAN YUXARIDA QALIR 🔥
Mətn: Bu səviyyə son on ildə cəmi bir dəfə itirilib — 2022-ci il böhranı zamanı — və o vaxtdan bəri hər qorunma struktur yüksəlişdən əvvəl baş verib. BTC indi $57k dövrü minimumunu təmizlədikdən sonra yenidən $60k-dan yuxarıdır, gündəlikdə isə həcm artır.
Makro qeyri-müəyyənlik hələ də davam edir, amma bu dəstək alışları cəlb etməyə davam edərsə, tarixi yay yüksəlişi modeli hələ də qüvvədədir. Siz yüksəliş üçün mövqe tutursunuz, yoxsa diapazonun daha bir sınağını gözləyirsiniz?
Bu, maliyyə məsləhəti deyil. Həmişə riskinizi idarə edin.
#BTC #SupportTest #200WeekMA #Crypto #SummerPump
🔥
$BTC $57K LİKİDİTLIK TƏMİZLƏNMƏSİNDƏN SONRA 200 HƏFTƏLİK MA-DAN YUXARIDA QALIR 🔥
Mətn: Bu səviyyə son on ildə cəmi bir dəfə itirilib — 2022-ci il böhranı zamanı — və o vaxtdan bəri hər qorunma struktur yüksəlişdən əvvəl baş verib. BTC indi $57k dövrü minimumunu təmizlədikdən sonra yenidən $60k-dan yuxarıdır, gündəlikdə isə həcm artır.
Makro qeyri-müəyyənlik hələ də davam edir, amma bu dəstək alışları cəlb etməyə davam edərsə, tarixi yay yüksəlişi modeli hələ də qüvvədədir. Siz yüksəliş üçün mövqe tutursunuz, yoxsa diapazonun daha bir sınağını gözləyirsiniz?
Bu, maliyyə məsləhəti deyil. Həmişə riskinizi idarə edin.
#BTC #SupportTest #200WeekMA #Crypto #SummerPump
🔥
Mətn: Bu səviyyə son on ildə cəmi bir dəfə itirilib — 2022-ci il böhranı zamanı — və o vaxtdan bəri hər qorunma struktur yüksəlişdən əvvəl baş verib. BTC indi $57k dövrü minimumunu təmizlədikdən sonra yenidən $60k-dan yuxarıdır, gündəlikdə isə həcm artır.
Makro qeyri-müəyyənlik hələ də davam edir, amma bu dəstək alışları cəlb etməyə davam edərsə, tarixi yay yüksəlişi modeli hələ də qüvvədədir. Siz yüksəliş üçün mövqe tutursunuz, yoxsa diapazonun daha bir sınağını gözləyirsiniz?
Bu, maliyyə məsləhəti deyil. Həmişə riskinizi idarə edin.
#BTC #SupportTest #200WeekMA #Crypto #SummerPump
🔥
31

·
--
Tərcüməyə bax
🛑 $BTC REJECTS 200-WEEK MA — HISTORICAL BEAR SIGNAL? 📉
📊 The 200-week moving average has been the ultimate line in the sand for Bitcoin across every cycle. Each rejection here has marked the final distribution phase before a deep corrective wave. 🦈 Smart money doesn't wait for confirmation — they're already pressing shorts against this resistance, while $ETH and $SOL trail the same institutional footprint.
⚠️ If this level holds, the macro bias flips bearish, and the path of least resistance points to liquidity sweeps below. The historical fractal is clear, but price action will decide. 💬 Are you respecting the 200-week MA or buying the breakout? 👇
⚠️ Not financial advice. Always manage your risk. 🛡️
🏷️ #BTC #Bearish #200WeekMA #Crypto #RiskOff
🐻 📉
🛑 $BTC REJECTS 200-WEEK MA — HISTORICAL BEAR SIGNAL? 📉
📊 The 200-week moving average has been the ultimate line in the sand for Bitcoin across every cycle. Each rejection here has marked the final distribution phase before a deep corrective wave. 🦈 Smart money doesn't wait for confirmation — they're already pressing shorts against this resistance, while $ETH and $SOL trail the same institutional footprint.
⚠️ If this level holds, the macro bias flips bearish, and the path of least resistance points to liquidity sweeps below. The historical fractal is clear, but price action will decide. 💬 Are you respecting the 200-week MA or buying the breakout? 👇
⚠️ Not financial advice. Always manage your risk. 🛡️
🏷️ #BTC #Bearish #200WeekMA #Crypto #RiskOff
🐻 📉
📊 The 200-week moving average has been the ultimate line in the sand for Bitcoin across every cycle. Each rejection here has marked the final distribution phase before a deep corrective wave. 🦈 Smart money doesn't wait for confirmation — they're already pressing shorts against this resistance, while $ETH and $SOL trail the same institutional footprint.
⚠️ If this level holds, the macro bias flips bearish, and the path of least resistance points to liquidity sweeps below. The historical fractal is clear, but price action will decide. 💬 Are you respecting the 200-week MA or buying the breakout? 👇
⚠️ Not financial advice. Always manage your risk. 🛡️
🏷️ #BTC #Bearish #200WeekMA #Crypto #RiskOff
🐻 📉
36

·
--
Tərcüməyə bax
$BTC 200W MA RETEST – BUYERS OR BEARS TAKE CONTROL? 🚨🐂
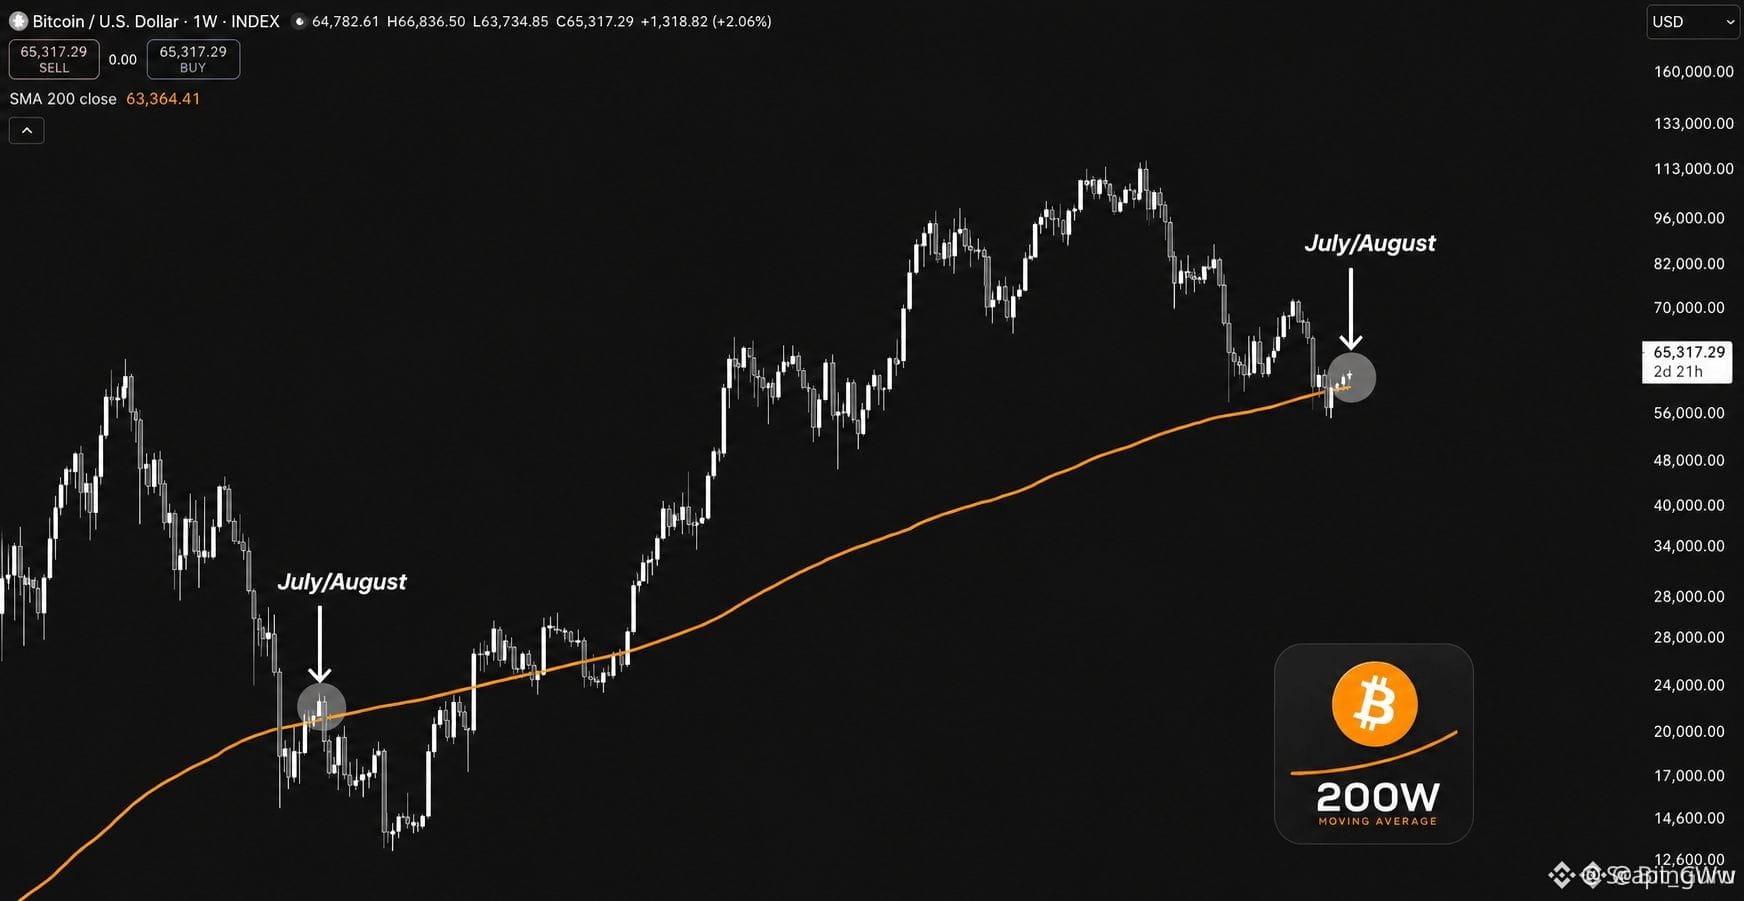
📌 This isn’t just another support zone – this is the 200-week moving average, the line in the sand that has turned Bitcoin around from every major correction since 2015. Buyers are defending it like a fortress, but volume is thinning on approach – a classic setup for an explosive move.
📊 The last two July/August retests of this level triggered multi-month rallies. If history echoes, the foundation for Q4 momentum is being laid right now. A weekly close below, however, opens the door for deeper liquidity grabs before recovery. 💡 Which side of this battle are you positioning for? 💬
⚠️ Not financial advice. Always manage your risk. 🛡️
🏷️ #BTC #200WeekMA #Bitcoin #SupportTest #Crypto
🐂 🛡️
$BTC 200W MA RETEST – BUYERS OR BEARS TAKE CONTROL? 🚨🐂
📌 This isn’t just another support zone – this is the 200-week moving average, the line in the sand that has turned Bitcoin around from every major correction since 2015. Buyers are defending it like a fortress, but volume is thinning on approach – a classic setup for an explosive move.
📊 The last two July/August retests of this level triggered multi-month rallies. If history echoes, the foundation for Q4 momentum is being laid right now. A weekly close below, however, opens the door for deeper liquidity grabs before recovery. 💡 Which side of this battle are you positioning for? 💬
⚠️ Not financial advice. Always manage your risk. 🛡️
🏷️ #BTC #200WeekMA #Bitcoin #SupportTest #Crypto
🐂 🛡️
📌 This isn’t just another support zone – this is the 200-week moving average, the line in the sand that has turned Bitcoin around from every major correction since 2015. Buyers are defending it like a fortress, but volume is thinning on approach – a classic setup for an explosive move.
📊 The last two July/August retests of this level triggered multi-month rallies. If history echoes, the foundation for Q4 momentum is being laid right now. A weekly close below, however, opens the door for deeper liquidity grabs before recovery. 💡 Which side of this battle are you positioning for? 💬
⚠️ Not financial advice. Always manage your risk. 🛡️
🏷️ #BTC #200WeekMA #Bitcoin #SupportTest #Crypto
🐂 🛡️
15
Daha çox kontent araşdırmaq üçün daxil olun
Binance Square-də qlobal kriptovalyuta istifadəçilərinə qoşulun
⚡️ Kriptovalyuta haqqında ən son və faydalı məlumatları əldə edin.
💬 Dünyanın ən böyük kriptovalyuta birjası tərəfindən etibar edilir.
👍 Doğrulanmış yaradıcılardan gələn real məlumatları kəşf edin.
E-poçt/Telefon nömrəsi
Trenddə olan mövzular
1
#Nikkei225Jumps2.5%ToThreeMonthHigh
2,963 baxış
Müzakirə edir: 139
2
#DriftHackVictimsBeginClaims
78,415 baxış
Müzakirə edir: 837
3
#SolanaTokenizedStockVolumeTops$4.4BInSeptember
7,911 baxış
Müzakirə edir: 83
4
#BitcoinSpotETFsDraw$6.34BInflowsInQ3
27,409 baxış
Müzakirə edir: 192
5
#EthereumValidatorExitQueueJumps392%
224,924 baxış
Müzakirə edir: 1,863
6
#IMFApprovesElSalvador$138MWithBitcoinWaiver
21,356 baxış
Müzakirə edir: 119
7
#SECHaltsCryptoETFReviewsAmidFundingLapse
347,106 baxış
Müzakirə edir: 2,559
8
#ZcashETFPostsFirstWeeklyOutflow$93.6M
106,944 baxış
Müzakirə edir: 284
9
#GreekPoliceBustCryptoScamRingArrest17
475,417 baxış
Müzakirə edir: 3,116
10
#BitcoinRejectedAt$87K
244,602 baxış
Müzakirə edir: 360