
Dora Bathrick m5gX
5 منشورات

Dora Bathrick m5gX
11 تتابع
0 المتابعون
1 إعجاب
منشورات
عرض الترجمة
$BTC
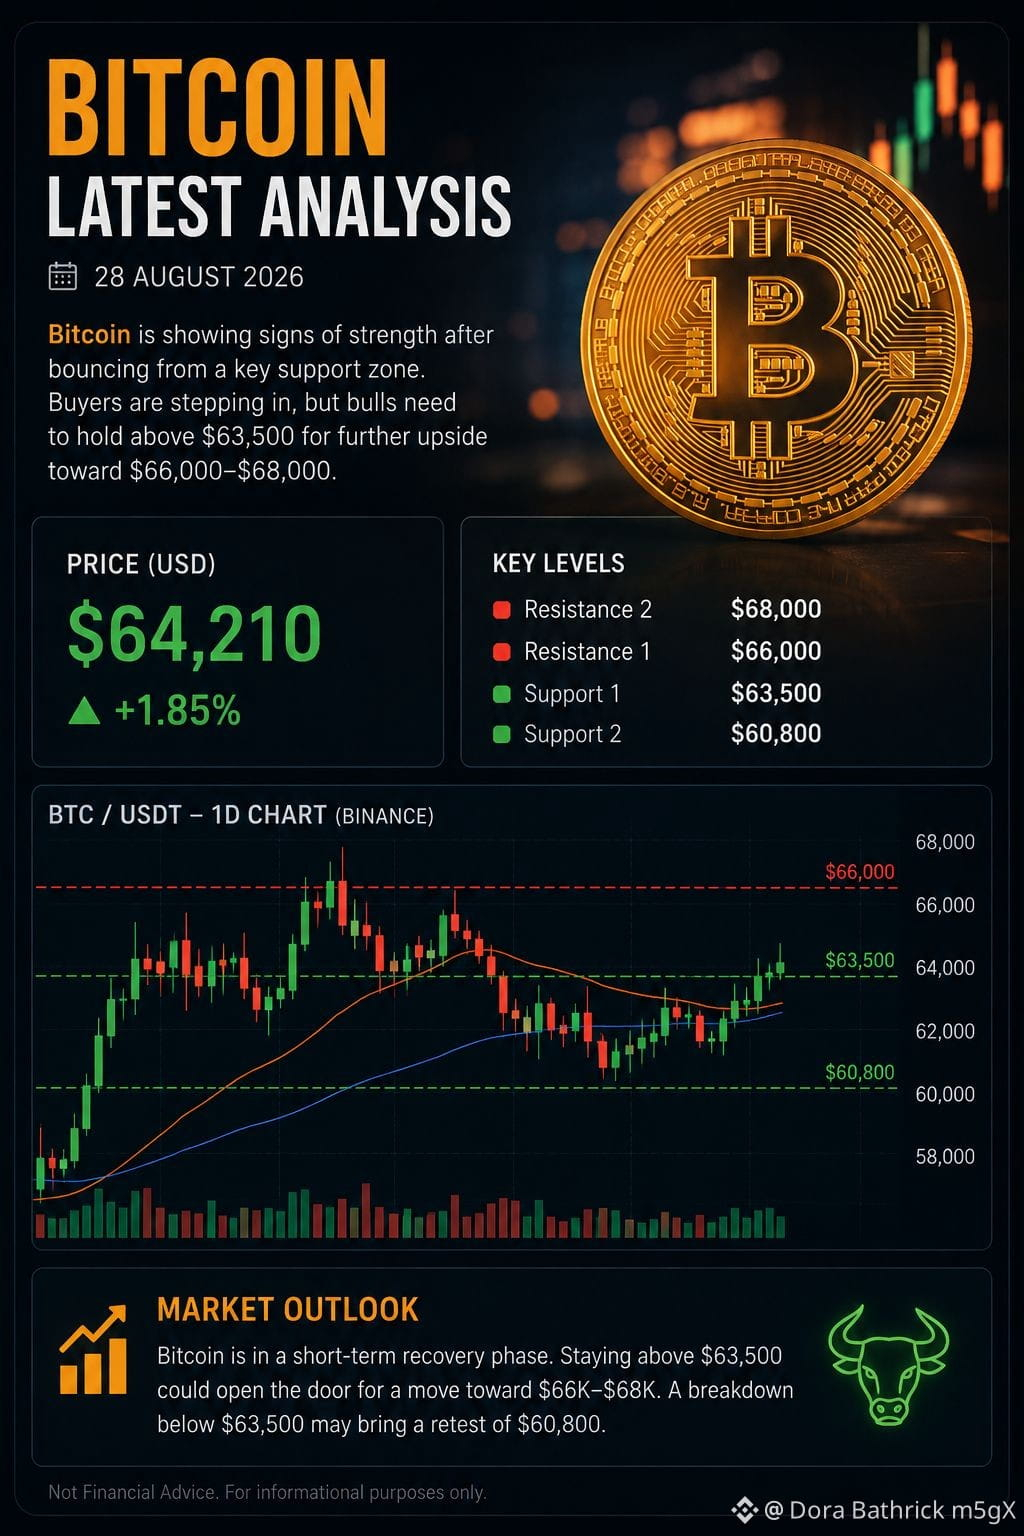
Bitcoin — Latest Analysis (28 Aug 2026)
Price: around $80,355, up about 1% in 24 hours.
BTC recently pushed above $81,000, showing strong short-term momentum.
$82,000 is the key near-term resistance to watch.
Strong spot Bitcoin ETF inflows are supporting demand; recent inflows have reached a nine-day streak.
If BTC breaks and holds above $82K, the bullish trend could strengthen.
Failure to hold $80K could trigger profit-taking and a deeper pullback.
Overall, the short-term bias is bullish but volatile.
Traders should closely watch ETF flows, U.S. yields, and upcoming Fed signals.
#bitcoin #trandingtopic #topanalyzers
Bitcoin — Latest Analysis (28 Aug 2026)
Price: around $80,355, up about 1% in 24 hours.
BTC recently pushed above $81,000, showing strong short-term momentum.
$82,000 is the key near-term resistance to watch.
Strong spot Bitcoin ETF inflows are supporting demand; recent inflows have reached a nine-day streak.
If BTC breaks and holds above $82K, the bullish trend could strengthen.
Failure to hold $80K could trigger profit-taking and a deeper pullback.
Overall, the short-term bias is bullish but volatile.
Traders should closely watch ETF flows, U.S. yields, and upcoming Fed signals.
#bitcoin #trandingtopic #topanalyzers
عرض الترجمة
$Ethereum (ETH) — Short Professional Analysis
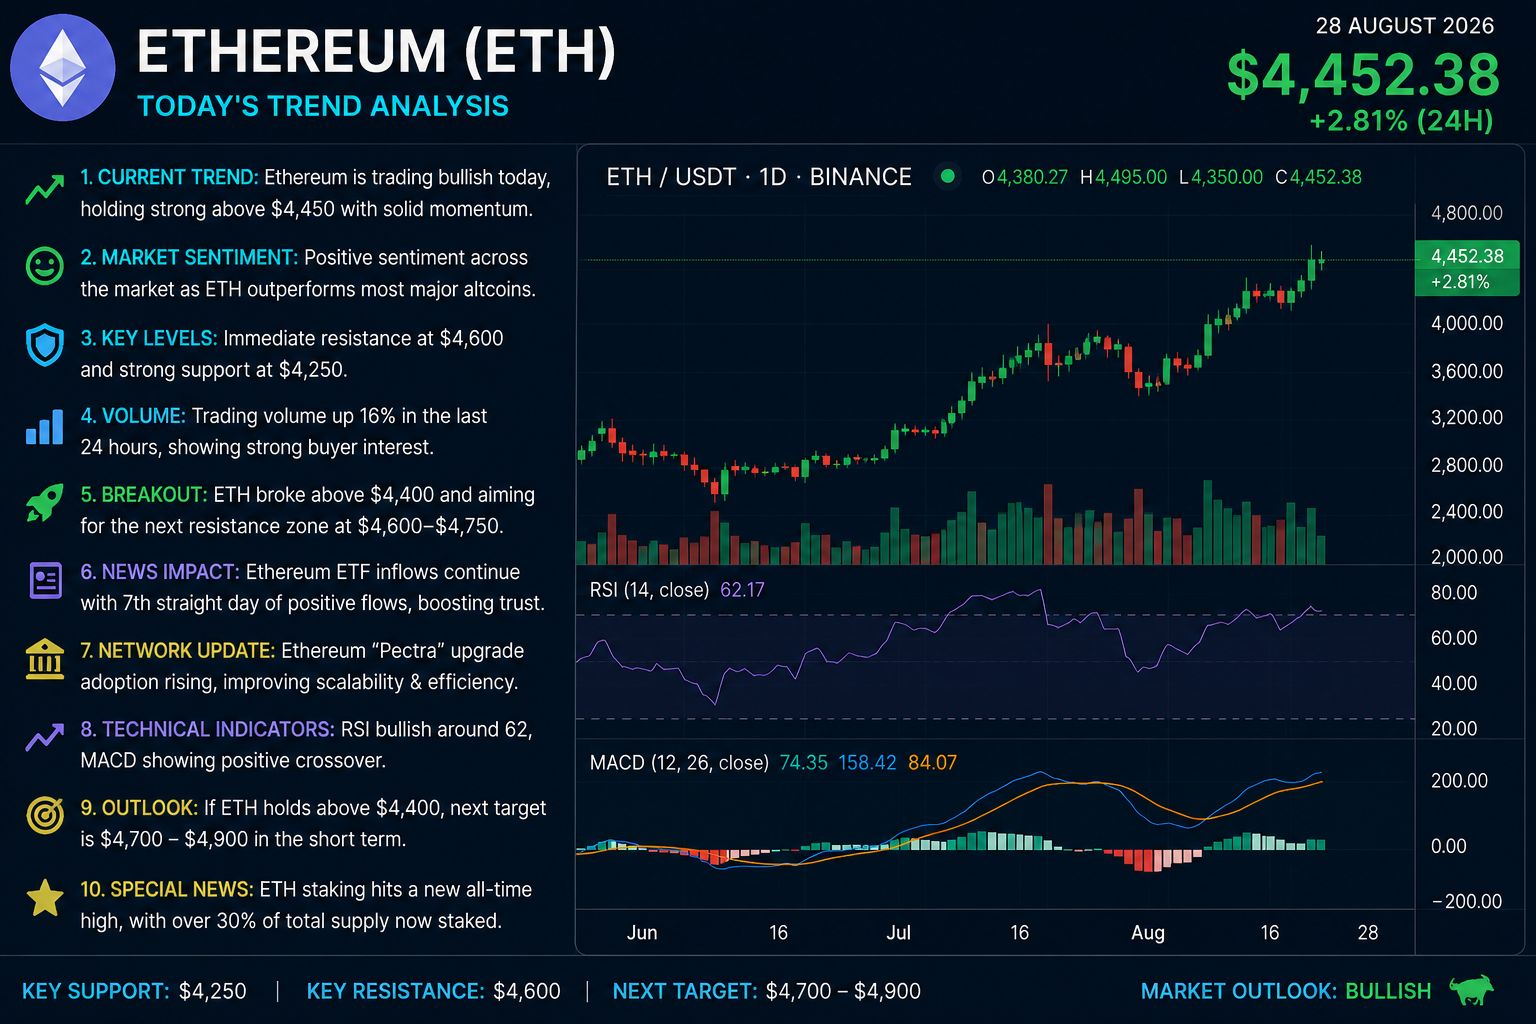
Trend: ETH is trading around $2,500, with a mildly bullish short-term structure.
Momentum: ETH remains about 8% higher over the past week.
Support: Watch the $2,450–$2,400 zone for buyers.
Resistance: $2,550–$2,600 is the key near-term breakout area.
ETF demand: Recent U.S. Ethereum ETF inflows have strengthened institutional interest.
Special news: Corporate accumulation is also notable, with BitMine reporting nearly 4.8% of ETH supply.
Volume: Strong trading activity supports the current recovery.
Bullish case: A sustained break above $2,600 could improve momentum toward higher levels.
Risk: Losing $2,400 could trigger short-term profit-taking.
Overall: Cautiously bullish—watch $2,550–$2,600 closely.
*Not financial advice; crypto prices can change rapidly.*
#ETHRISE #Ethrereum #Top_Gainers
Trend: ETH is trading around $2,500, with a mildly bullish short-term structure.
Momentum: ETH remains about 8% higher over the past week.
Support: Watch the $2,450–$2,400 zone for buyers.
Resistance: $2,550–$2,600 is the key near-term breakout area.
ETF demand: Recent U.S. Ethereum ETF inflows have strengthened institutional interest.
Special news: Corporate accumulation is also notable, with BitMine reporting nearly 4.8% of ETH supply.
Volume: Strong trading activity supports the current recovery.
Bullish case: A sustained break above $2,600 could improve momentum toward higher levels.
Risk: Losing $2,400 could trigger short-term profit-taking.
Overall: Cautiously bullish—watch $2,550–$2,600 closely.
*Not financial advice; crypto prices can change rapidly.*
#ETHRISE #Ethrereum #Top_Gainers
عرض الترجمة
Worked for 37s
$Bitcoin (BTC) — Today’s Professional Trend
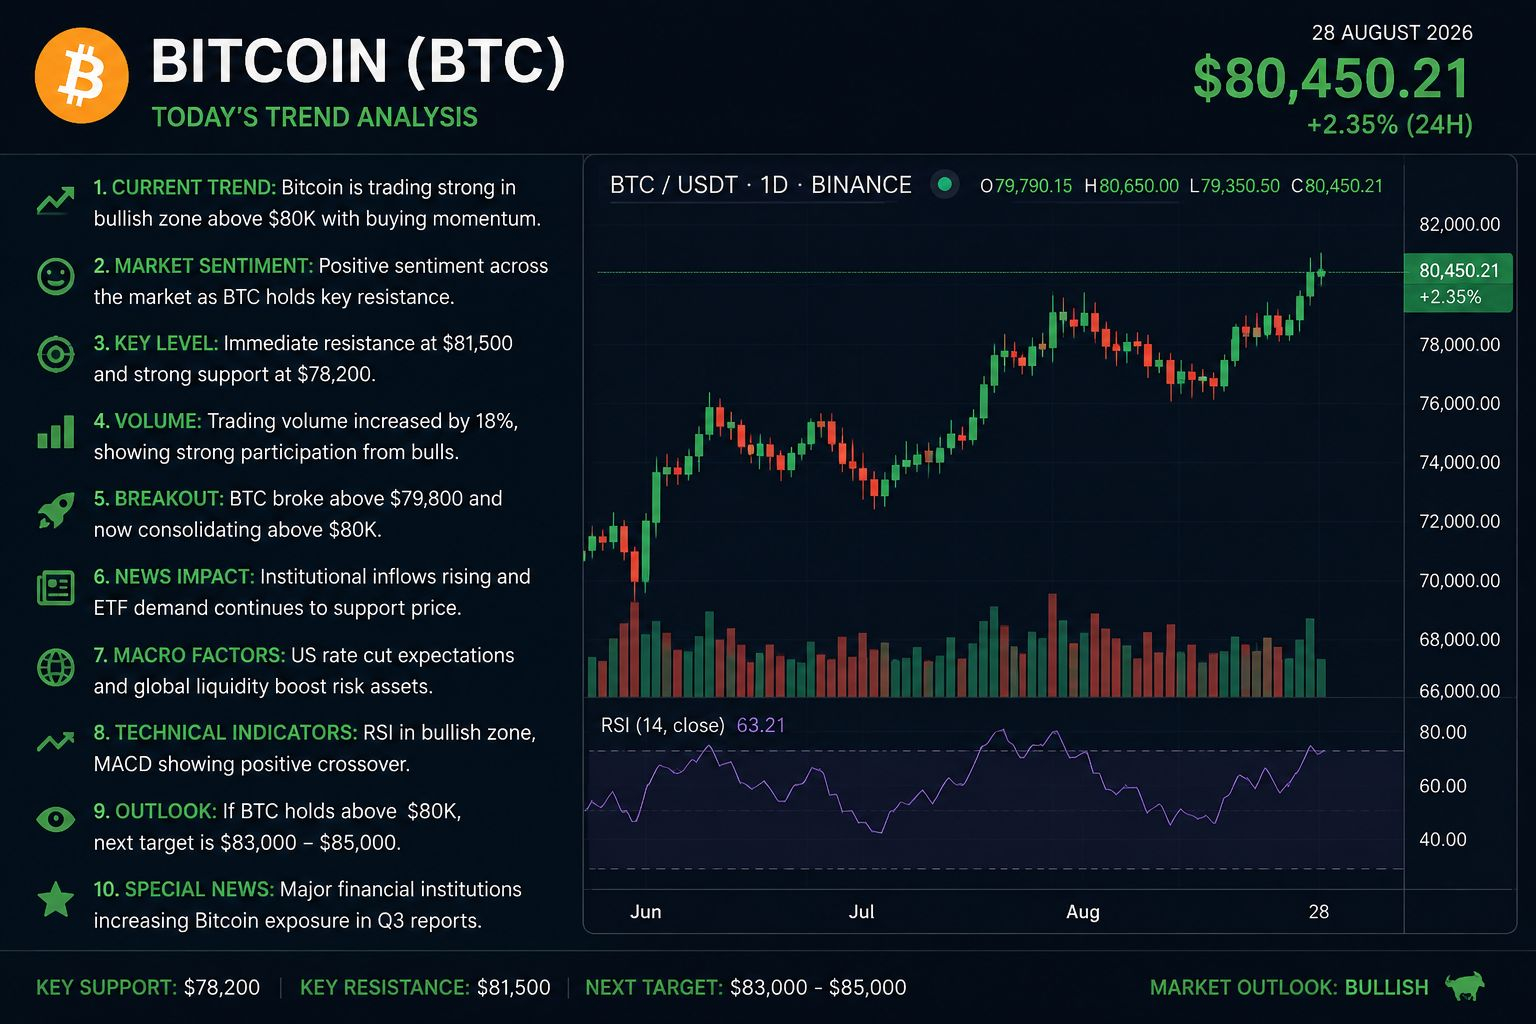
1. Trend: Bullish, with BTC holding around the $80K area.
2. Momentum: Bitcoin has gained strongly over the past week and month.
3. Key resistance: $80,000–$81,500 is the important breakout zone.
4. Key support: Around $78,000–$78,500.
5. ETF news: U.S. spot Bitcoin ETFs recorded eight consecutive sessions of inflows, totaling about $2.8B during the streak.
6. August inflows: Bitcoin ETF inflows have exceeded $3B, making August the strongest month of 2026 so far.
7. Market driver: A weaker dollar and macroeconomic expectations are supporting Bitcoin demand.
8. Risk: Failure to hold the $78K region could trigger a short-term correction.
9. Bullish scenario: A convincing break above $81.5K could open the way toward $83K–$85K.
10. Overall: Bullish but volatile—watch ETF flows and the $80K level closely.
Not financial advice; crypto can move sharply in either direction.
[Live Bitcoin price & chart](https://www.coinbase.com/price/bitcoin?utm_source=chatgpt.com)#bitcoin #BitEagleNews #BitcoinETFs
$Bitcoin (BTC) — Today’s Professional Trend
1. Trend: Bullish, with BTC holding around the $80K area.
2. Momentum: Bitcoin has gained strongly over the past week and month.
3. Key resistance: $80,000–$81,500 is the important breakout zone.
4. Key support: Around $78,000–$78,500.
5. ETF news: U.S. spot Bitcoin ETFs recorded eight consecutive sessions of inflows, totaling about $2.8B during the streak.
6. August inflows: Bitcoin ETF inflows have exceeded $3B, making August the strongest month of 2026 so far.
7. Market driver: A weaker dollar and macroeconomic expectations are supporting Bitcoin demand.
8. Risk: Failure to hold the $78K region could trigger a short-term correction.
9. Bullish scenario: A convincing break above $81.5K could open the way toward $83K–$85K.
10. Overall: Bullish but volatile—watch ETF flows and the $80K level closely.
Not financial advice; crypto can move sharply in either direction.
[Live Bitcoin price & chart](https://www.coinbase.com/price/bitcoin?utm_source=chatgpt.com)#bitcoin #BitEagleNews #BitcoinETFs
$DogecoinDogecoin (DOGE) — تحليل اتجاهات احترافي اليوم
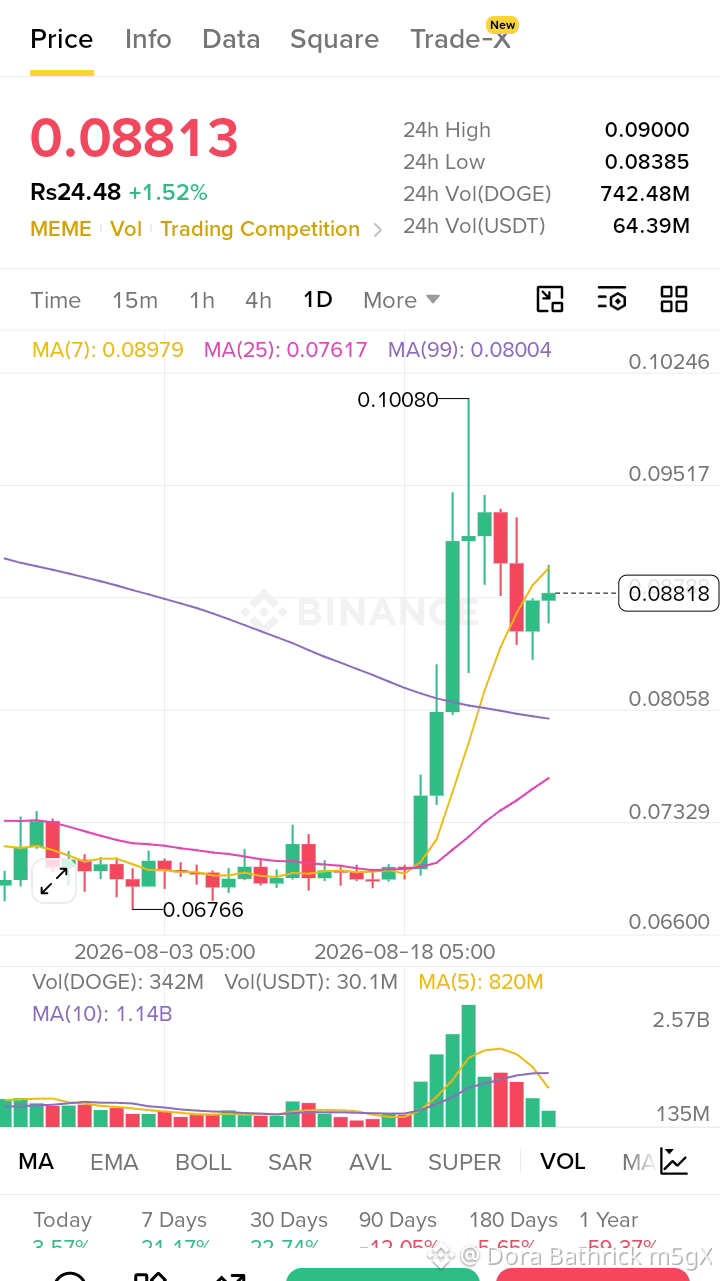
السعر الحالي: يبلغ سعر DOGE حوالي $0.0863، وتُظهر حركة السعر تماسكًا بعد صعوده الأخير.
الاتجاه قصير الأجل: صعودي إلى محايد — لا يزال المشترون نشطين، لكن الزخم لم يتحقق بعد كتأكيد لاختراق.
الصورة الفنية: يقيم أحد النماذج الفنية الحالية DOGE على أنه شراء قوي، حيث تشير أغلب المتوسطات المتحركة إلى الشراء.
الزخم: يبلغ مؤشر RSI حوالي 58.7، وهو صعودي لكن ليس بعد ضمن حالة تشبع شرائي عميق.
مقاومة رئيسية: $0.095–$0.10 هي المنطقة المحورية؛ إذ تعثر DOGE مؤخرًا حول $0.095 لخط EMA لمدّة 200 يوم.
تأكيد صعودي: يمكن أن يؤدي إغلاق يومي قوي فوق $0.10 إلى تحسين كبير للبنية الصعودية.
الدعم الرئيسي: $0.085 مهم؛ فقدان هذا المستوى قد يزيد ضغط البيع باتجاه $0.081.
المخاطر: قد يؤدي فشل الاختراق إلى تصحيح أعمق؛ ويحدد تحليل حديث $0.056–$0.060 كمنطقة دعم سفلية رئيسية.
المحفزات في السوق: يظل Dogecoin حساسًا لمعنويات العملات الرقمية الأوسع، كما تتم متابعة أي تغييرات تتعلق بمنتجات U.S. Dogecoin ETF.
الخلاصة الاحترافية: DOGE صعودي بحذر فوق $0.085، وصعودي بقوة فوق $0.10، وهبوطي إذا تم كسر $0.081 بشكل حاسم.
الإجمالي: 🟡 إعداد صعودي، لكن يلزم التأكيد فوق $0.095–$0.10. هذا تحليل للسوق وليس توقعًا مضمونًا أو نصيحة مالية.
#doge⚡ #Dogecoin #Doge🚀🚀🚀 #DOGEUSDT
السعر الحالي: يبلغ سعر DOGE حوالي $0.0863، وتُظهر حركة السعر تماسكًا بعد صعوده الأخير.
الاتجاه قصير الأجل: صعودي إلى محايد — لا يزال المشترون نشطين، لكن الزخم لم يتحقق بعد كتأكيد لاختراق.
الصورة الفنية: يقيم أحد النماذج الفنية الحالية DOGE على أنه شراء قوي، حيث تشير أغلب المتوسطات المتحركة إلى الشراء.
الزخم: يبلغ مؤشر RSI حوالي 58.7، وهو صعودي لكن ليس بعد ضمن حالة تشبع شرائي عميق.
مقاومة رئيسية: $0.095–$0.10 هي المنطقة المحورية؛ إذ تعثر DOGE مؤخرًا حول $0.095 لخط EMA لمدّة 200 يوم.
تأكيد صعودي: يمكن أن يؤدي إغلاق يومي قوي فوق $0.10 إلى تحسين كبير للبنية الصعودية.
الدعم الرئيسي: $0.085 مهم؛ فقدان هذا المستوى قد يزيد ضغط البيع باتجاه $0.081.
المخاطر: قد يؤدي فشل الاختراق إلى تصحيح أعمق؛ ويحدد تحليل حديث $0.056–$0.060 كمنطقة دعم سفلية رئيسية.
المحفزات في السوق: يظل Dogecoin حساسًا لمعنويات العملات الرقمية الأوسع، كما تتم متابعة أي تغييرات تتعلق بمنتجات U.S. Dogecoin ETF.
الخلاصة الاحترافية: DOGE صعودي بحذر فوق $0.085، وصعودي بقوة فوق $0.10، وهبوطي إذا تم كسر $0.081 بشكل حاسم.
الإجمالي: 🟡 إعداد صعودي، لكن يلزم التأكيد فوق $0.095–$0.10. هذا تحليل للسوق وليس توقعًا مضمونًا أو نصيحة مالية.
#doge⚡ #Dogecoin #Doge🚀🚀🚀 #DOGEUSDT
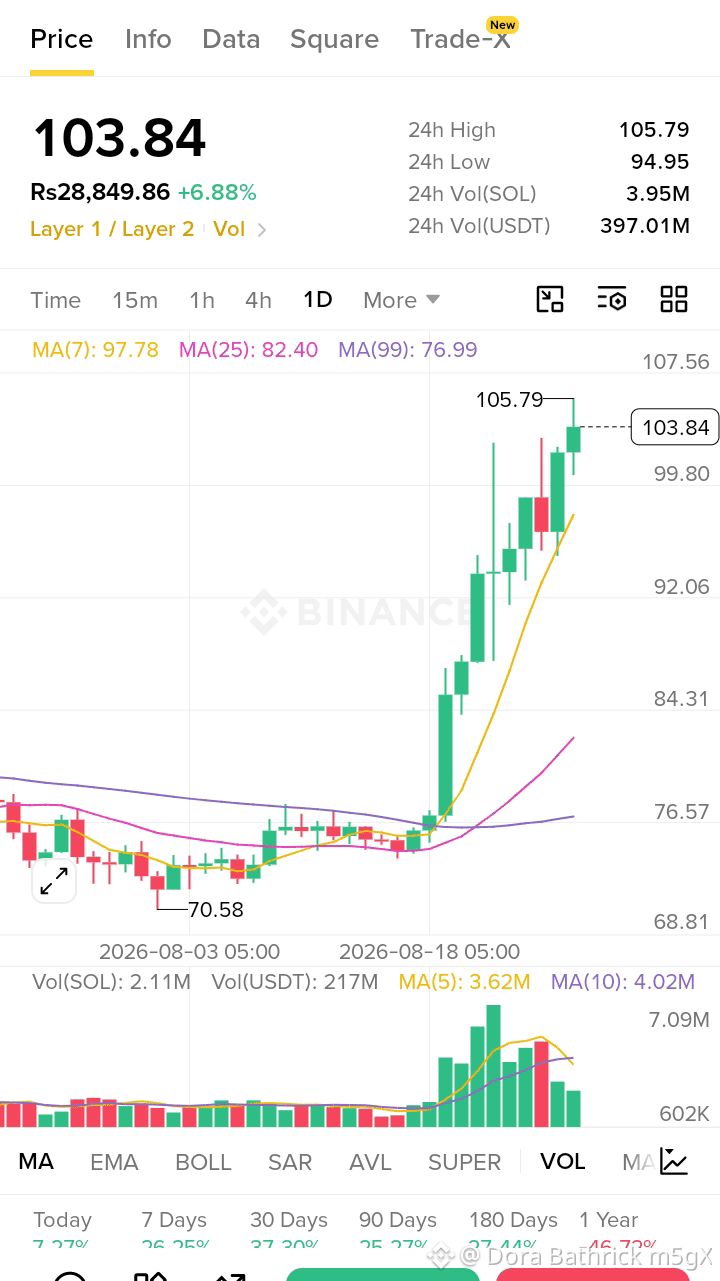
$سولانا (SOL) — الاتجاه المهني اليوم، 27 أغسطس 2026
الاتجاه العام: صعودي على المدى القصير. يتم تداول SOL حاليًا حول $101–$104 اليوم.
الزخم: حققت SOL مكاسب تقارب 18% خلال الأيام السبعة الماضية، ما يُظهر زخم شراء قوي.
الدعم الرئيسي: $100 هو مستوى الدعم النفسي المهم حاليًا.
المقاومة: منطقة المقاومة المهمة التالية تقع تقريبًا عند $104–$108.
إشارة الاختراق: قد يؤدي استمرار الحركة فوق $108 إلى تعزيز السيناريو الصعودي.
طلب صناديق الاستثمار المتداولة (ETF): تدفقات صناديق سولانا الفورية في الولايات المتحدة (spot Solana ETF) المدونة تُسهم في دعم الارتفاع الأخير.
اتجاه العرض: يُفكر مُشغلو (validators) سولانا في مقترحات قد تُقلل انبعاثات SOL المستقبلية وتزيد من حرق SOL.
إشارة فنية: تُظهر Investing.com حاليًا إشارة فنية يومية «شراء قوي» (Strong Buy) بناءً على مؤشراته.
المخاطر: بعد صعود سريع، فإن أي تراجع تحت $100 سيُضعف البنية الصعودية الفورية.
وجهة النظر المهنية: صعودي فوق $100؛ تأكيد صعودي أقوى فوق $108؛ الحذر إذا تم كسر $100. هذا تحليل للسوق وليس توقعًا مضمونًا للسعر.
اتجاه اليوم: 🟢 **صعودي — لكن راقب $100 و$108 عن كثب جدًا.**
#solanAnalysis #SolanaStrong
الاتجاه العام: صعودي على المدى القصير. يتم تداول SOL حاليًا حول $101–$104 اليوم.
الزخم: حققت SOL مكاسب تقارب 18% خلال الأيام السبعة الماضية، ما يُظهر زخم شراء قوي.
الدعم الرئيسي: $100 هو مستوى الدعم النفسي المهم حاليًا.
المقاومة: منطقة المقاومة المهمة التالية تقع تقريبًا عند $104–$108.
إشارة الاختراق: قد يؤدي استمرار الحركة فوق $108 إلى تعزيز السيناريو الصعودي.
طلب صناديق الاستثمار المتداولة (ETF): تدفقات صناديق سولانا الفورية في الولايات المتحدة (spot Solana ETF) المدونة تُسهم في دعم الارتفاع الأخير.
اتجاه العرض: يُفكر مُشغلو (validators) سولانا في مقترحات قد تُقلل انبعاثات SOL المستقبلية وتزيد من حرق SOL.
إشارة فنية: تُظهر Investing.com حاليًا إشارة فنية يومية «شراء قوي» (Strong Buy) بناءً على مؤشراته.
المخاطر: بعد صعود سريع، فإن أي تراجع تحت $100 سيُضعف البنية الصعودية الفورية.
وجهة النظر المهنية: صعودي فوق $100؛ تأكيد صعودي أقوى فوق $108؛ الحذر إذا تم كسر $100. هذا تحليل للسوق وليس توقعًا مضمونًا للسعر.
اتجاه اليوم: 🟢 **صعودي — لكن راقب $100 و$108 عن كثب جدًا.**
#solanAnalysis #SolanaStrong
سجّل الدخول لاستكشاف المزيد من المُحتوى