
LeeTFx
9 منشورات

LeeTFx
7 تتابع
19 المتابعون
21 إعجاب
منشورات
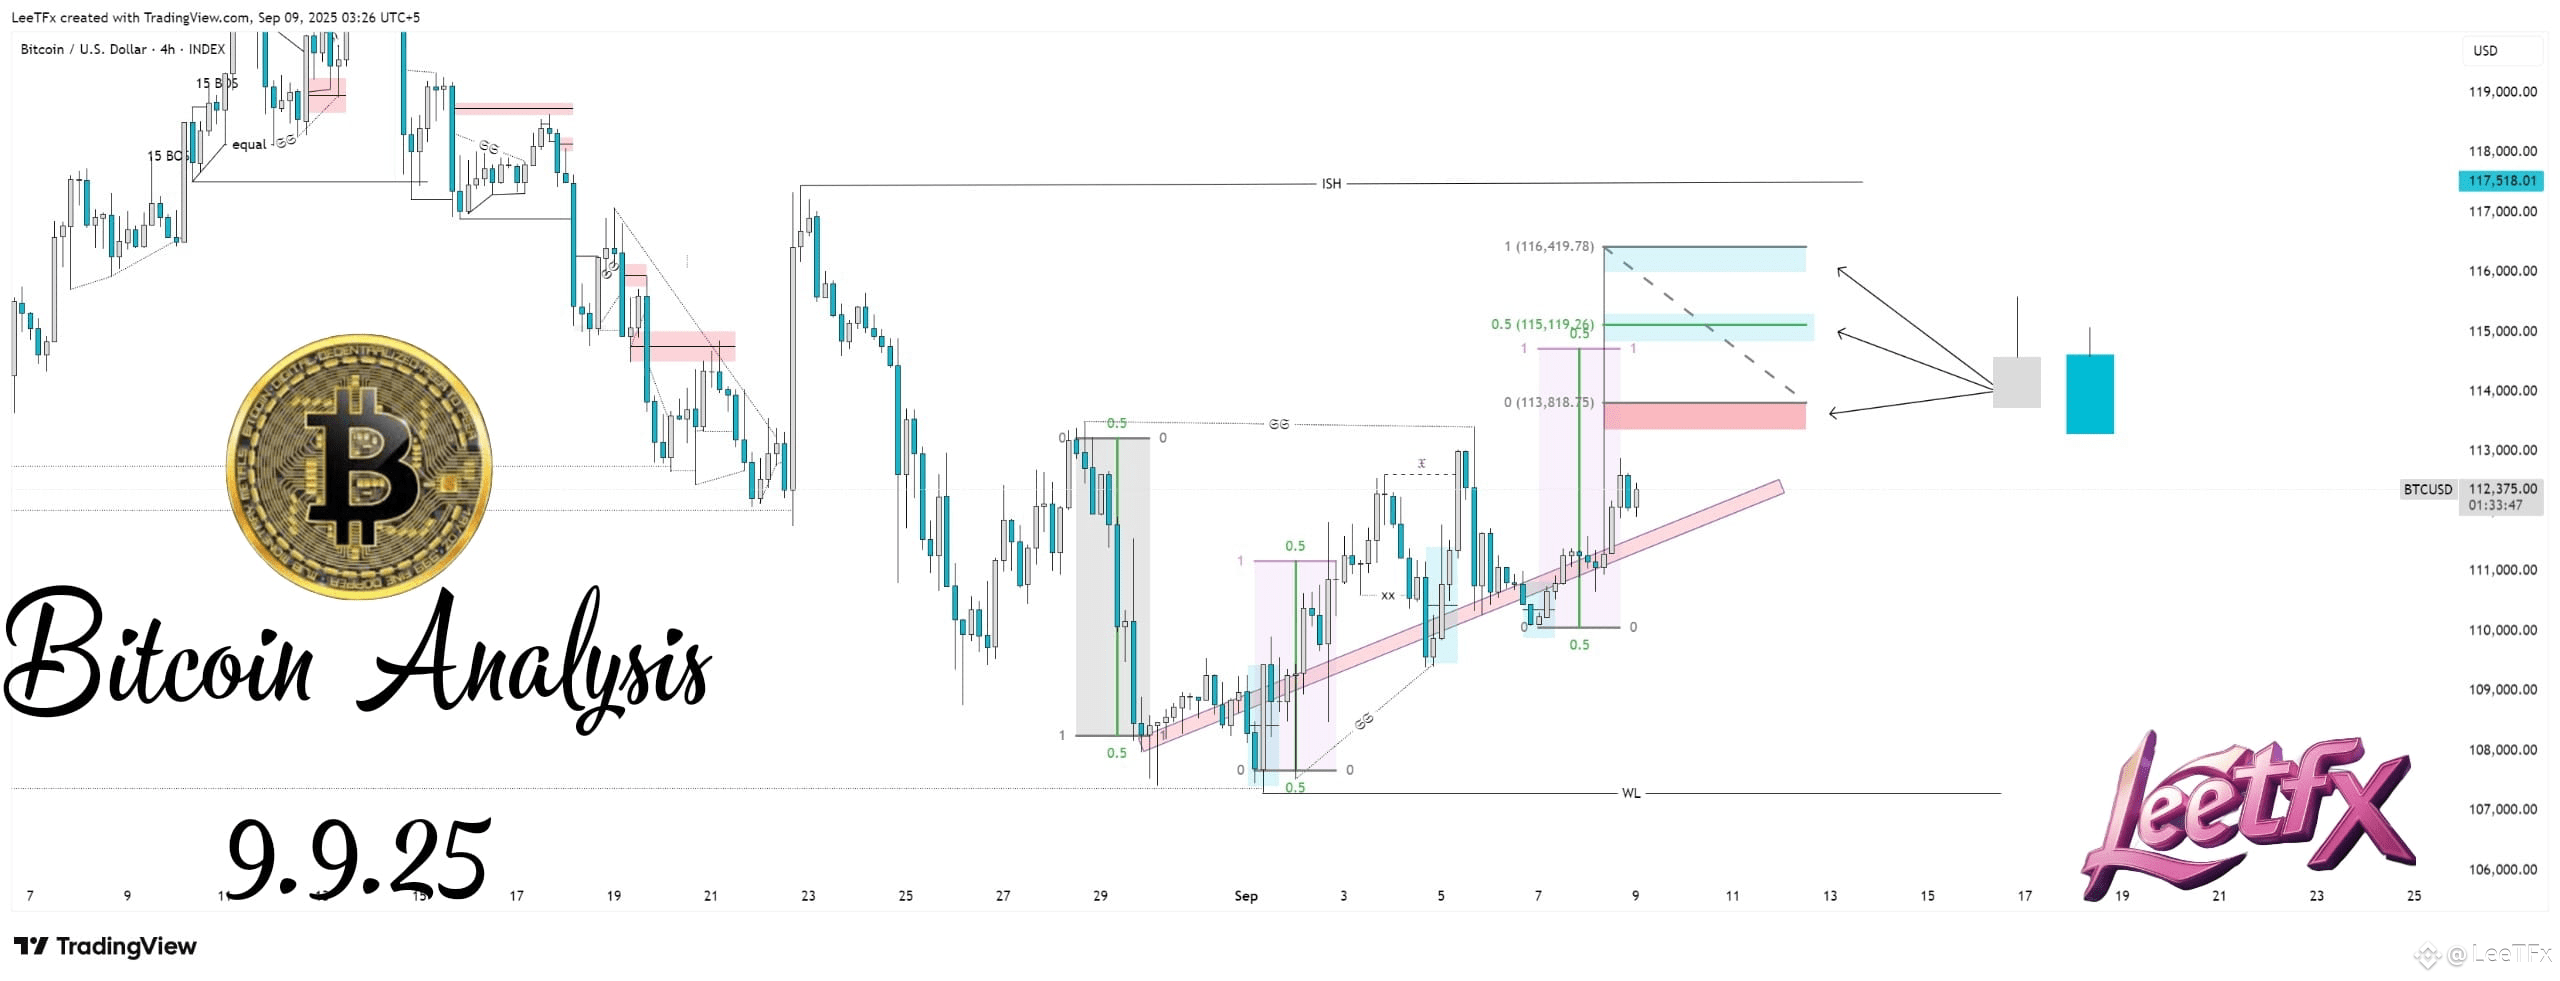
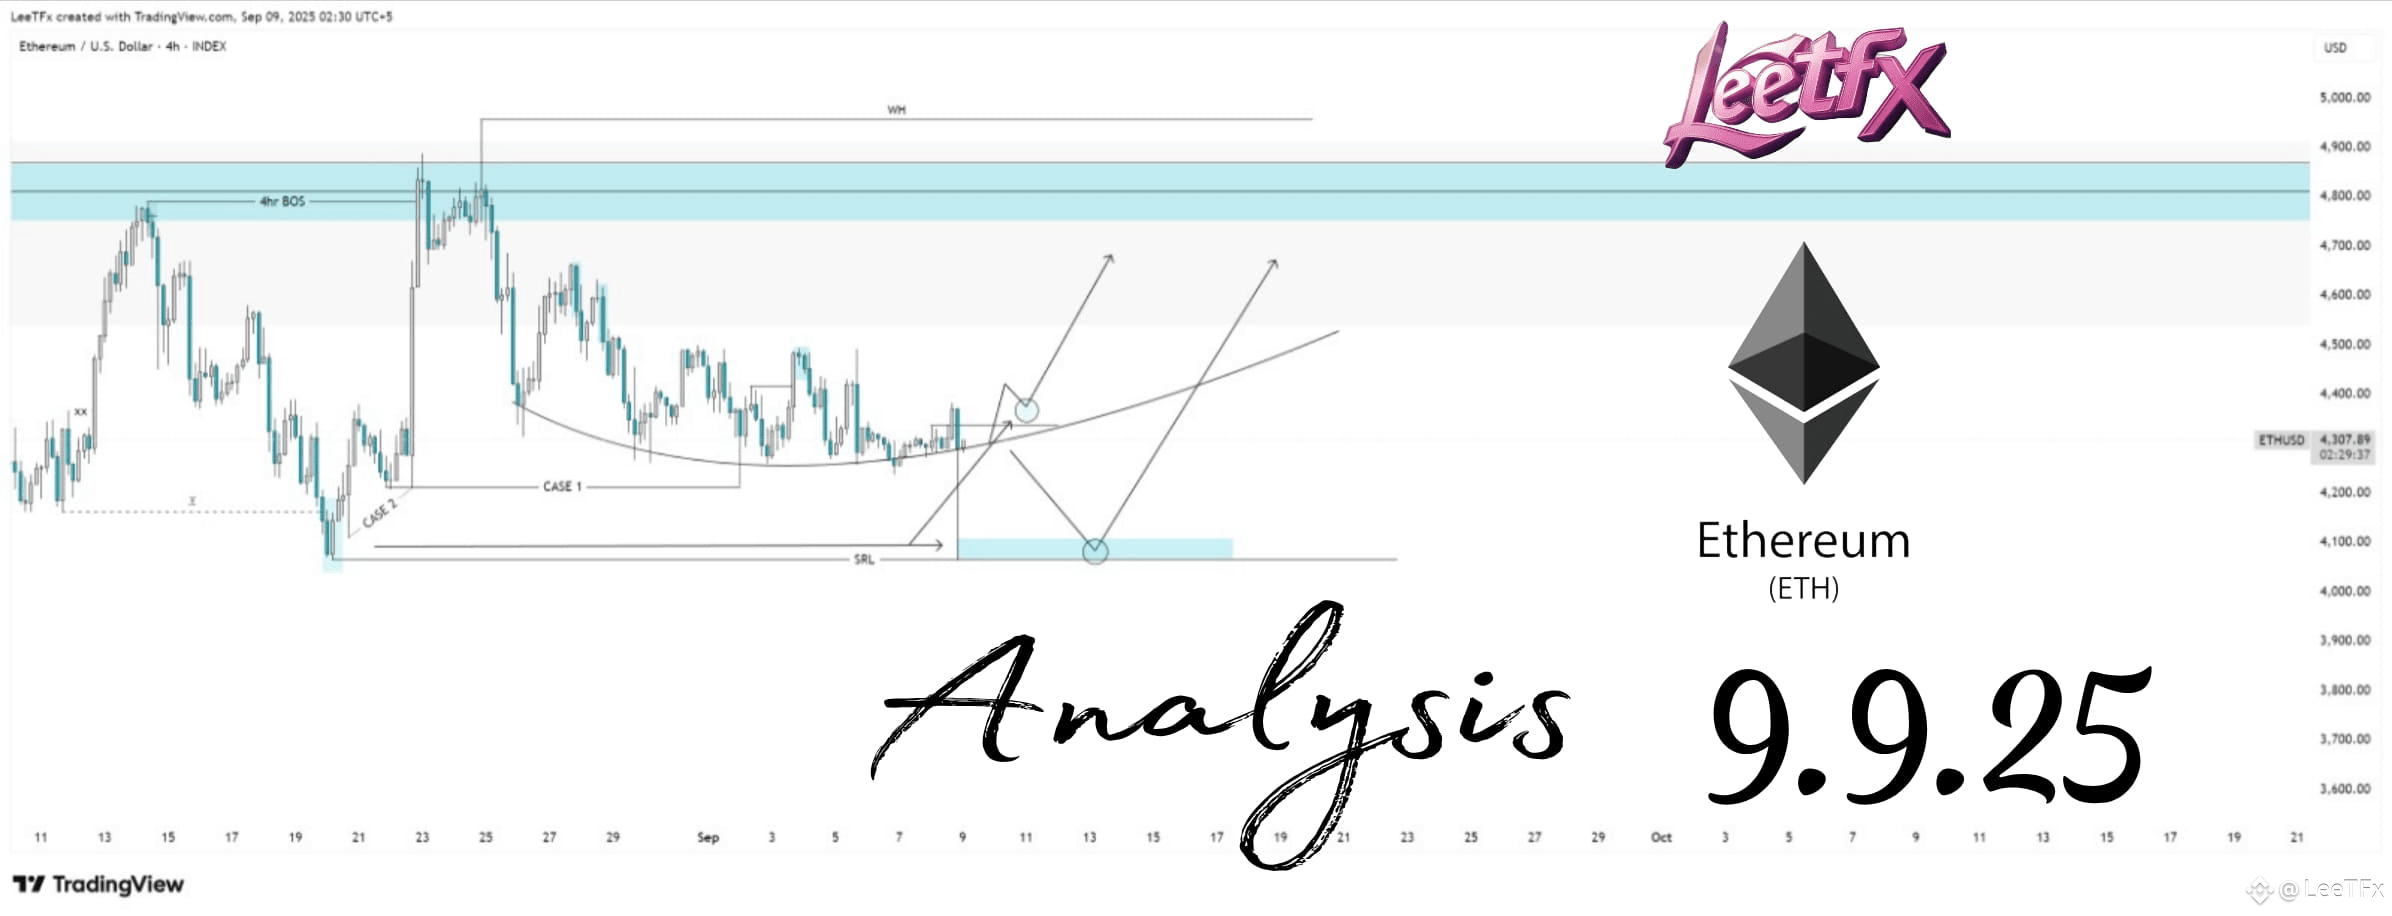
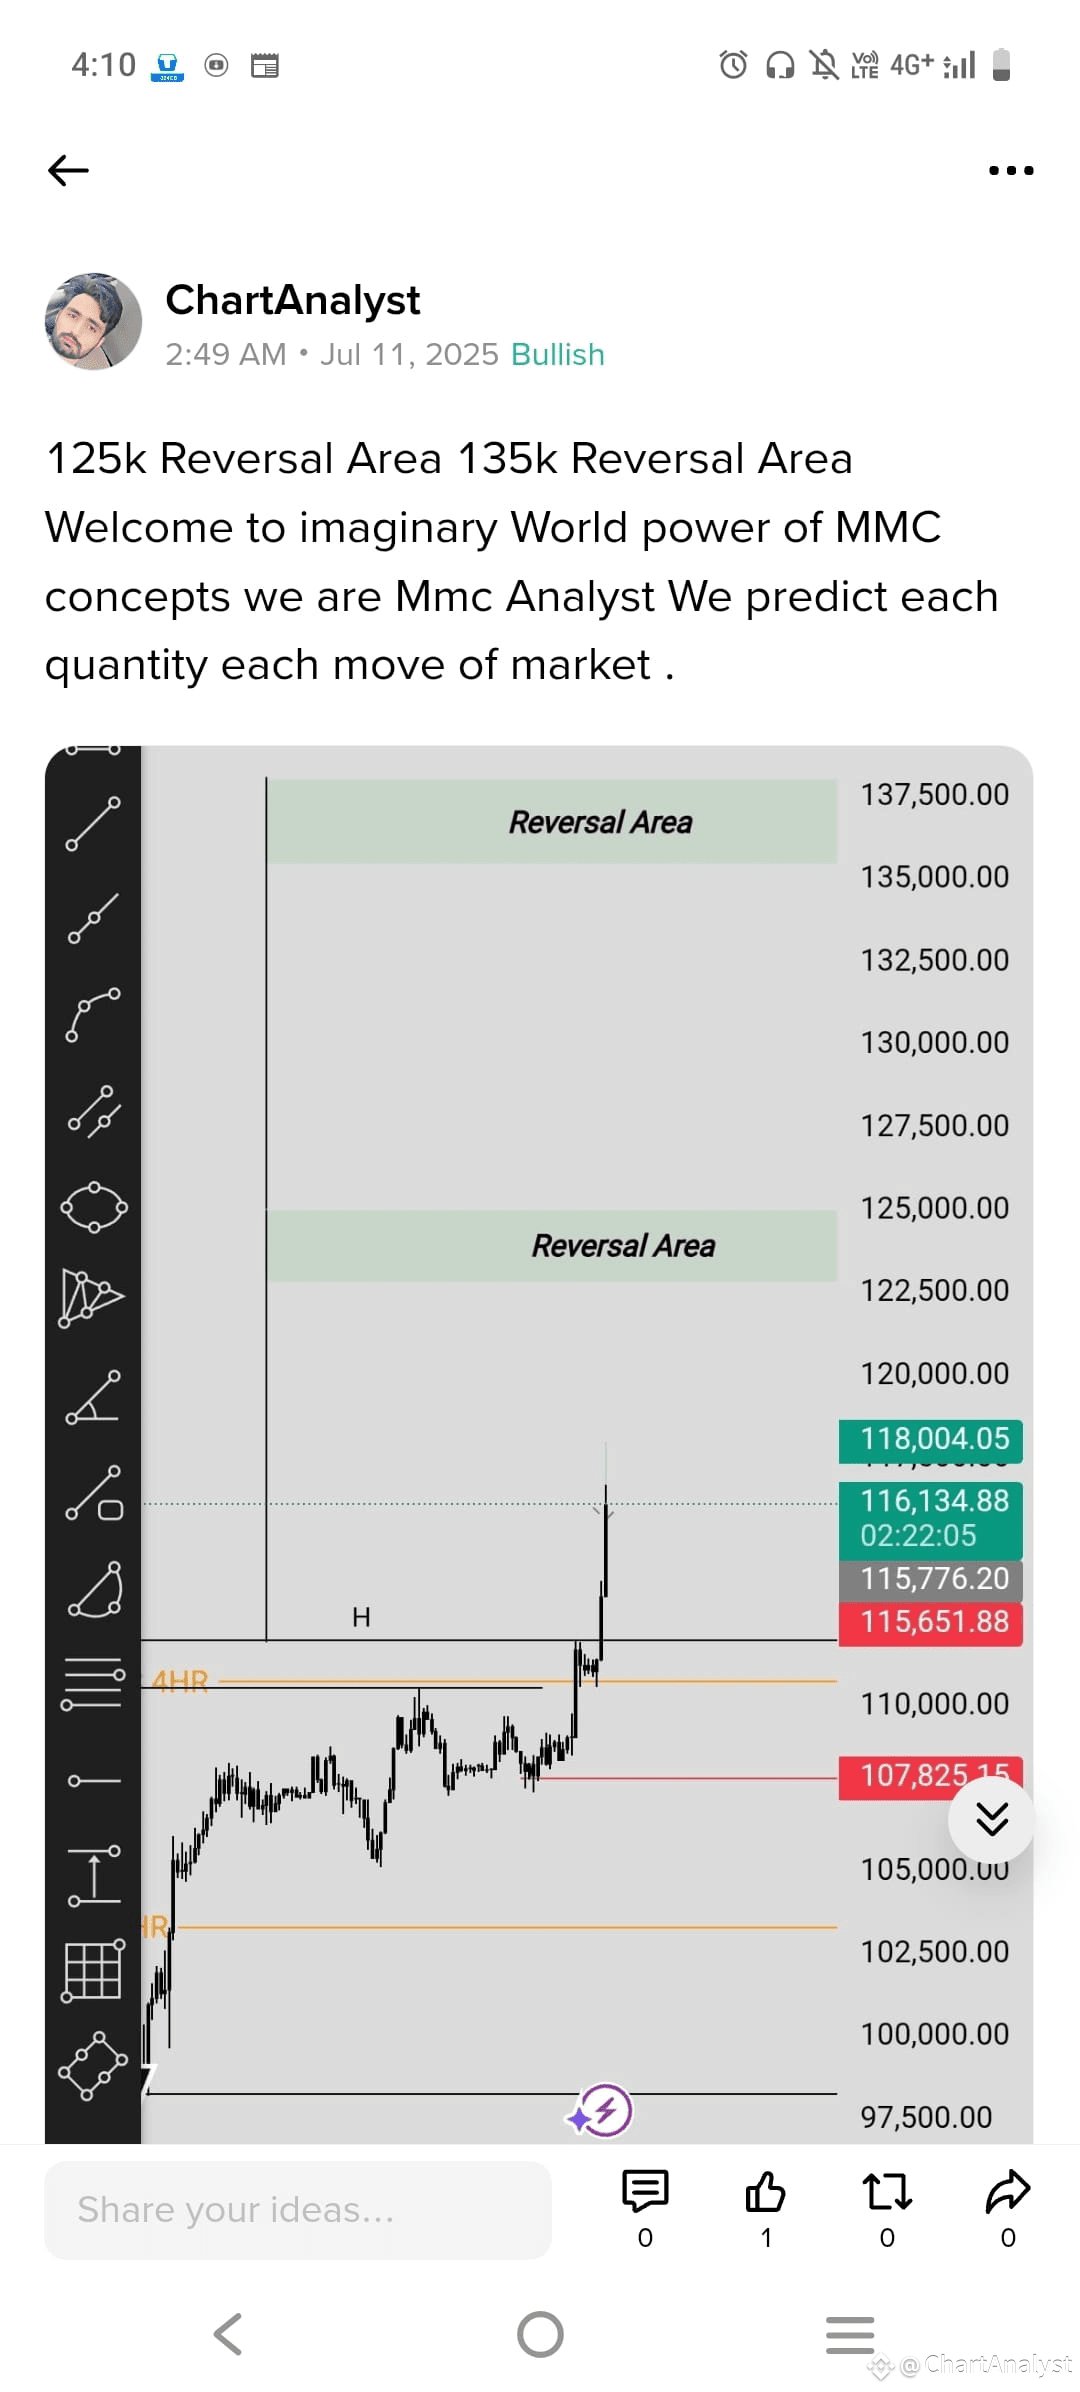
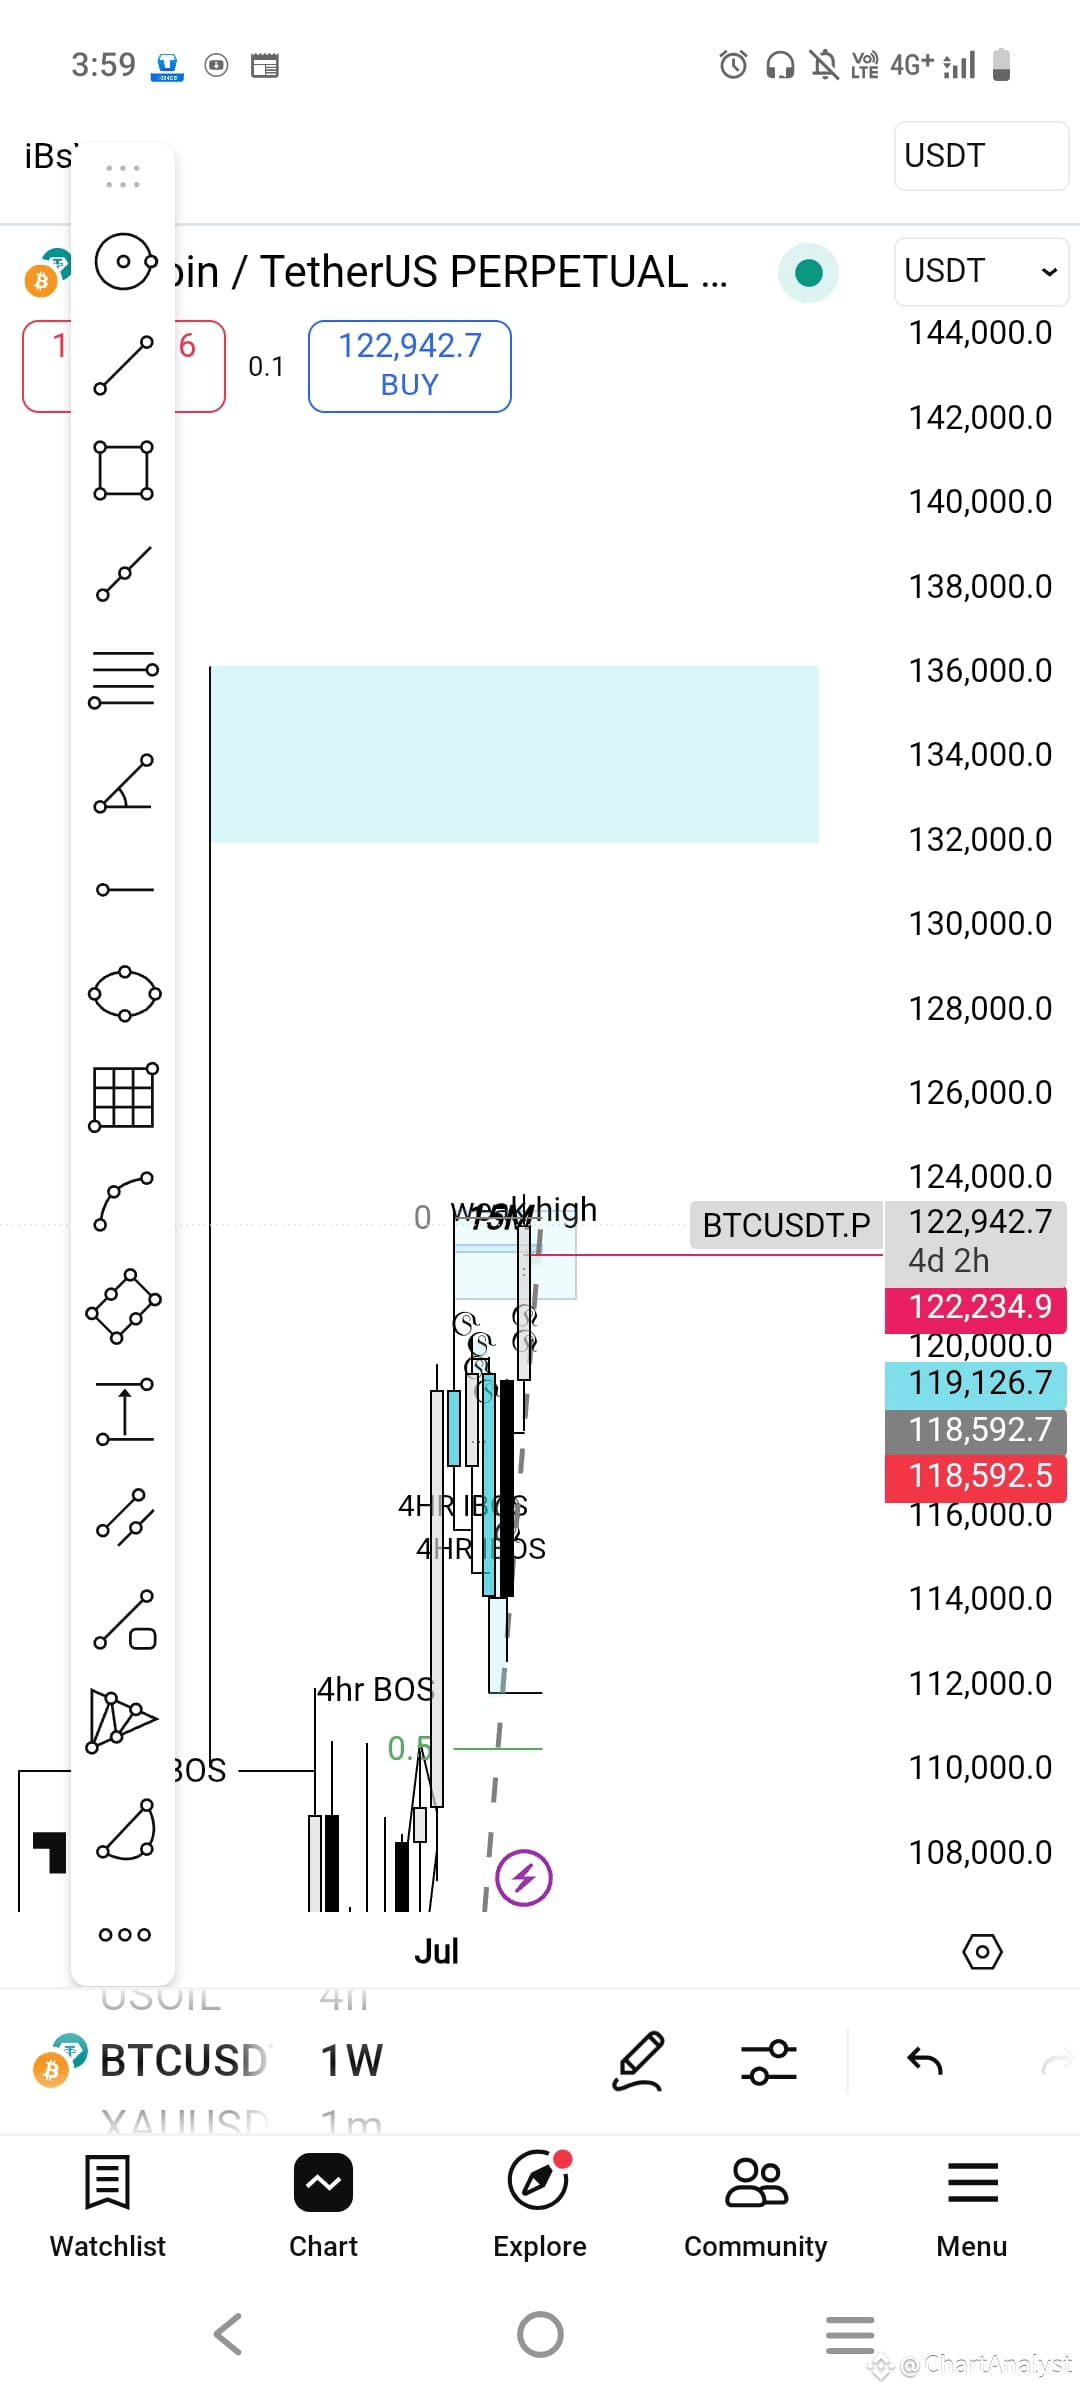
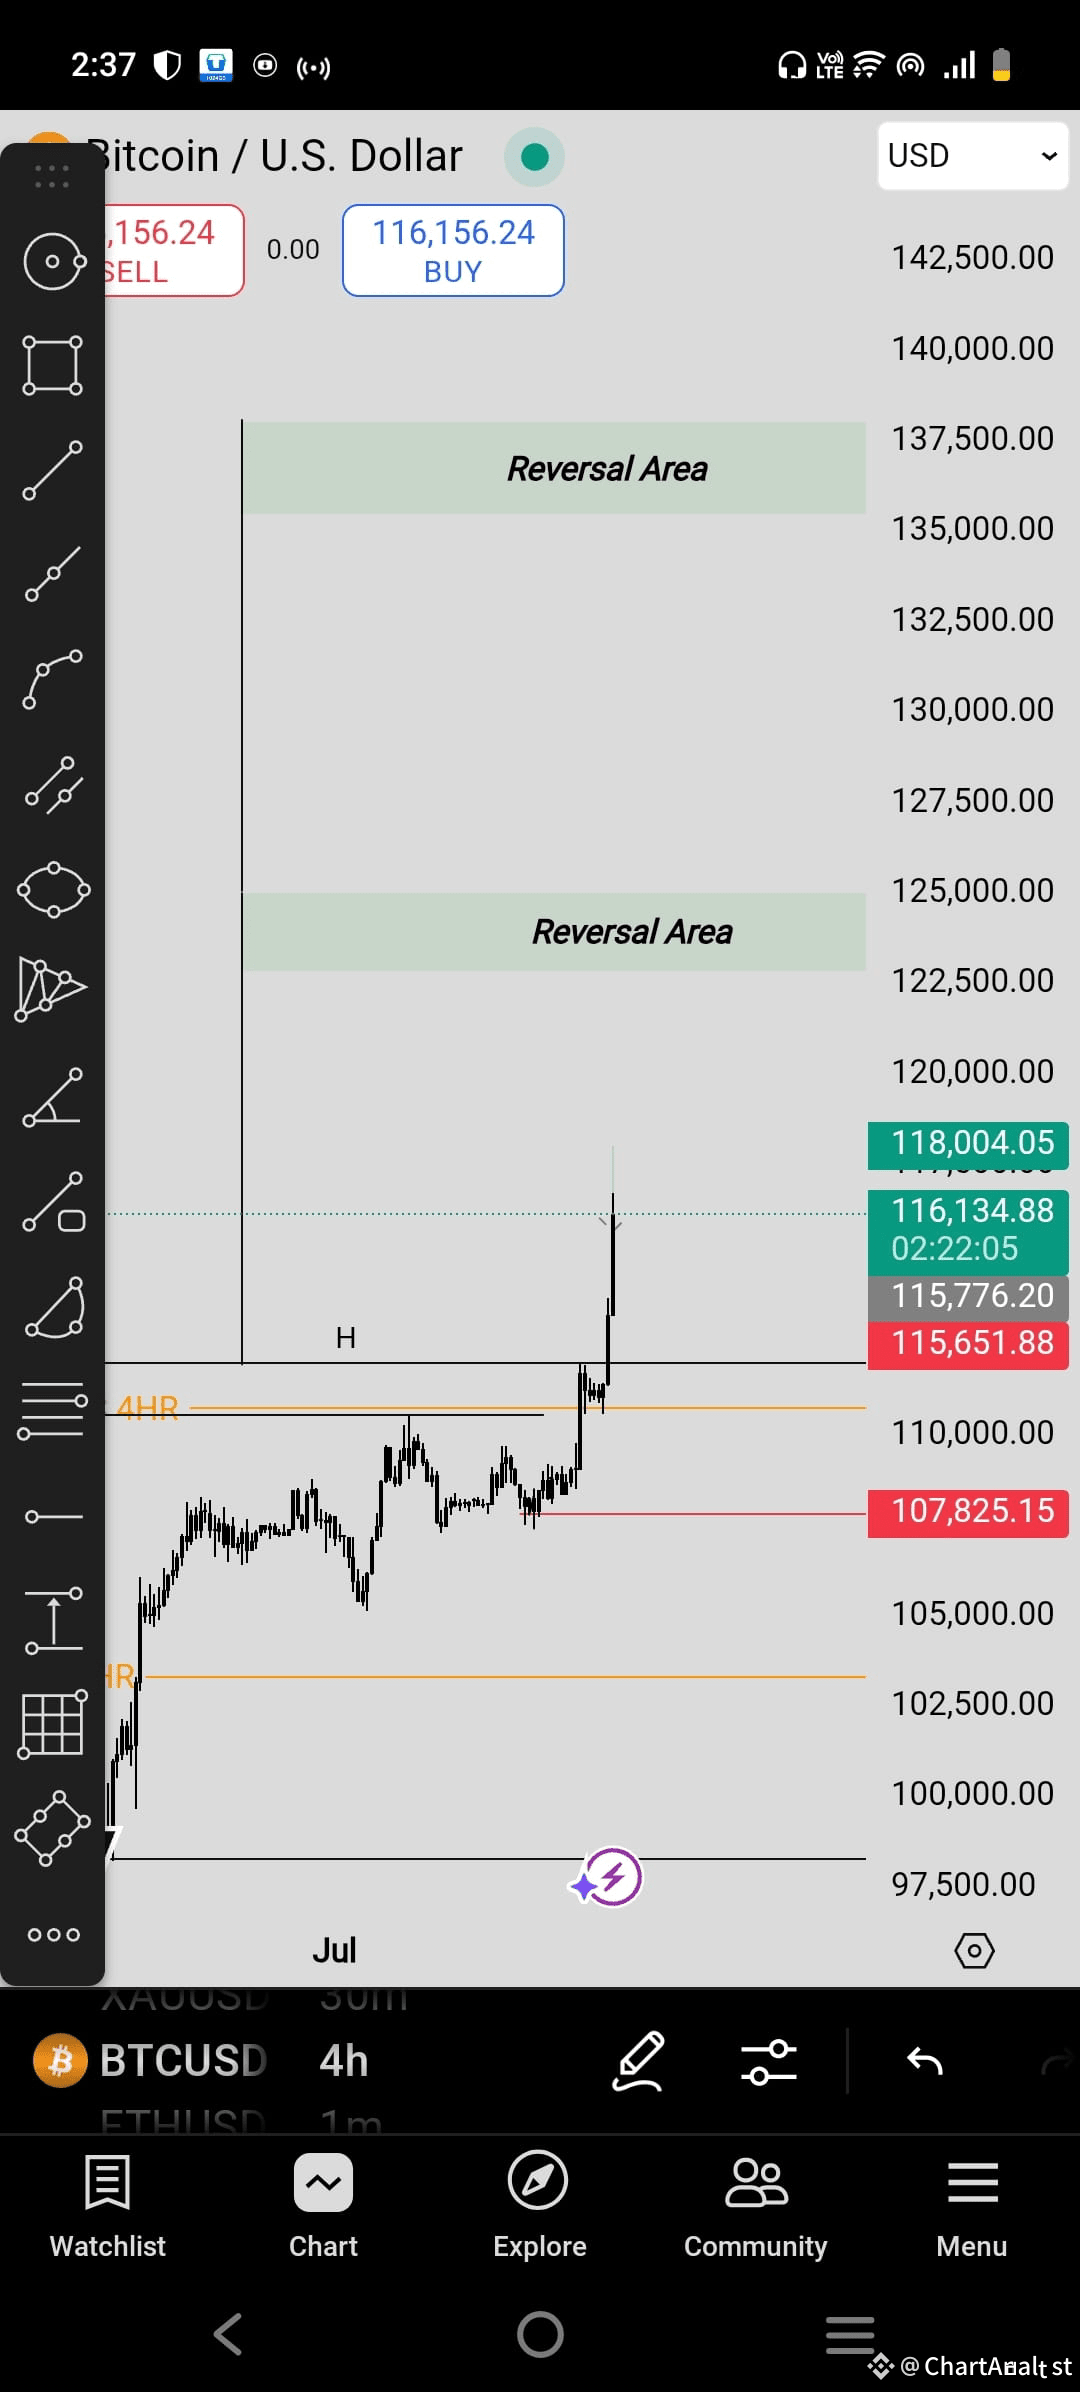
منطقة عكسية 125k منطقة عكسية 135k مرحبًا بكم في عالم خيالي قوة مفاهيم MMC نحن محللو MMC نتنبأ بكل كمية وكل حركة في السوق.
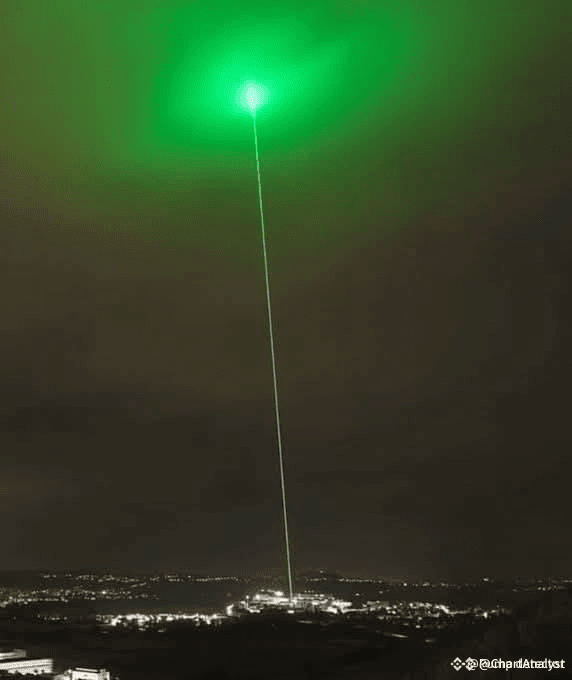
كل تاجر يحلم بأن يكون مثل
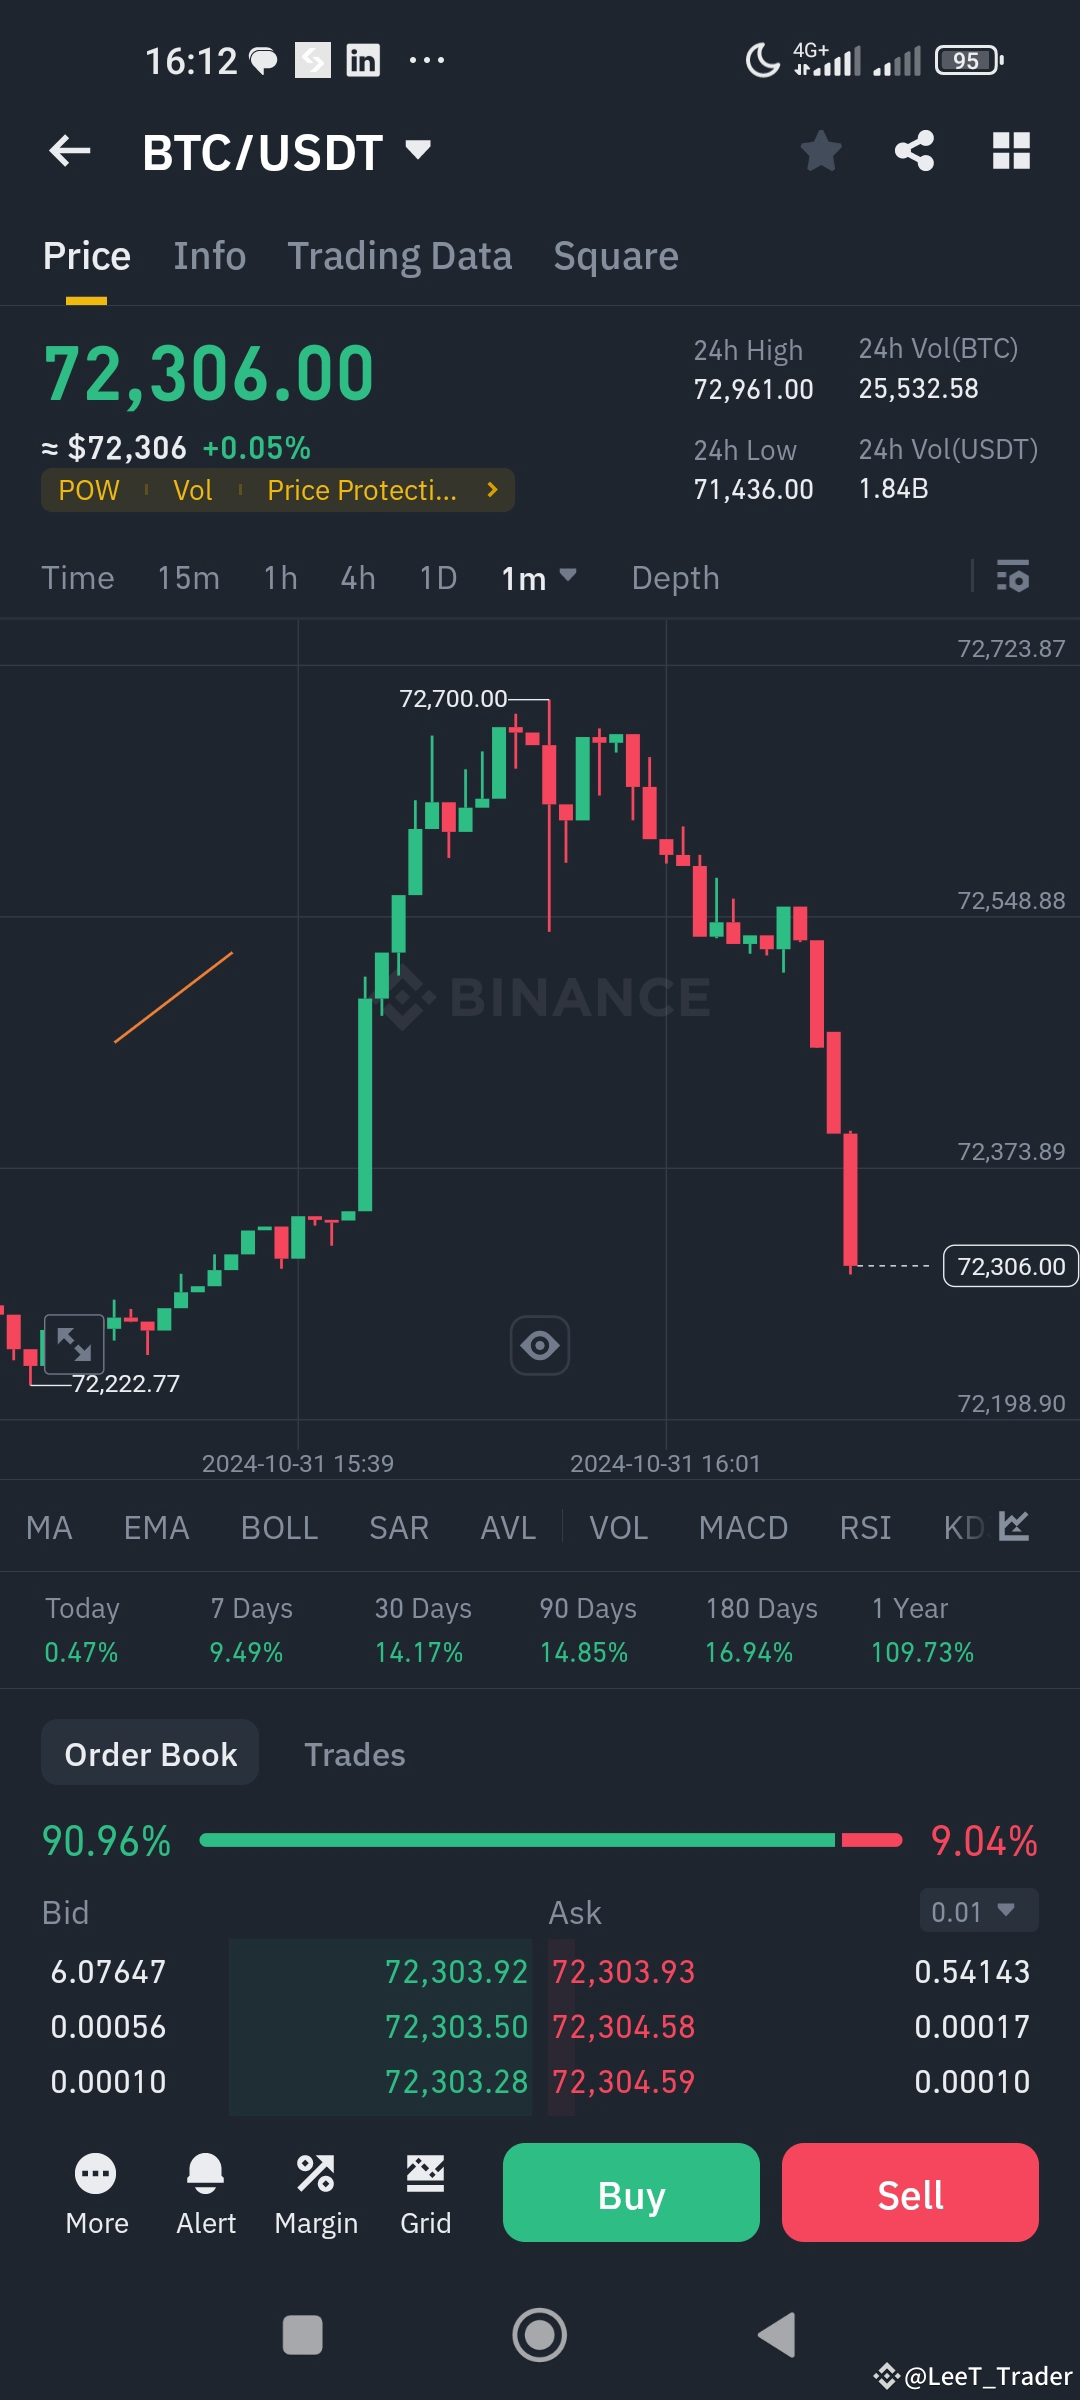
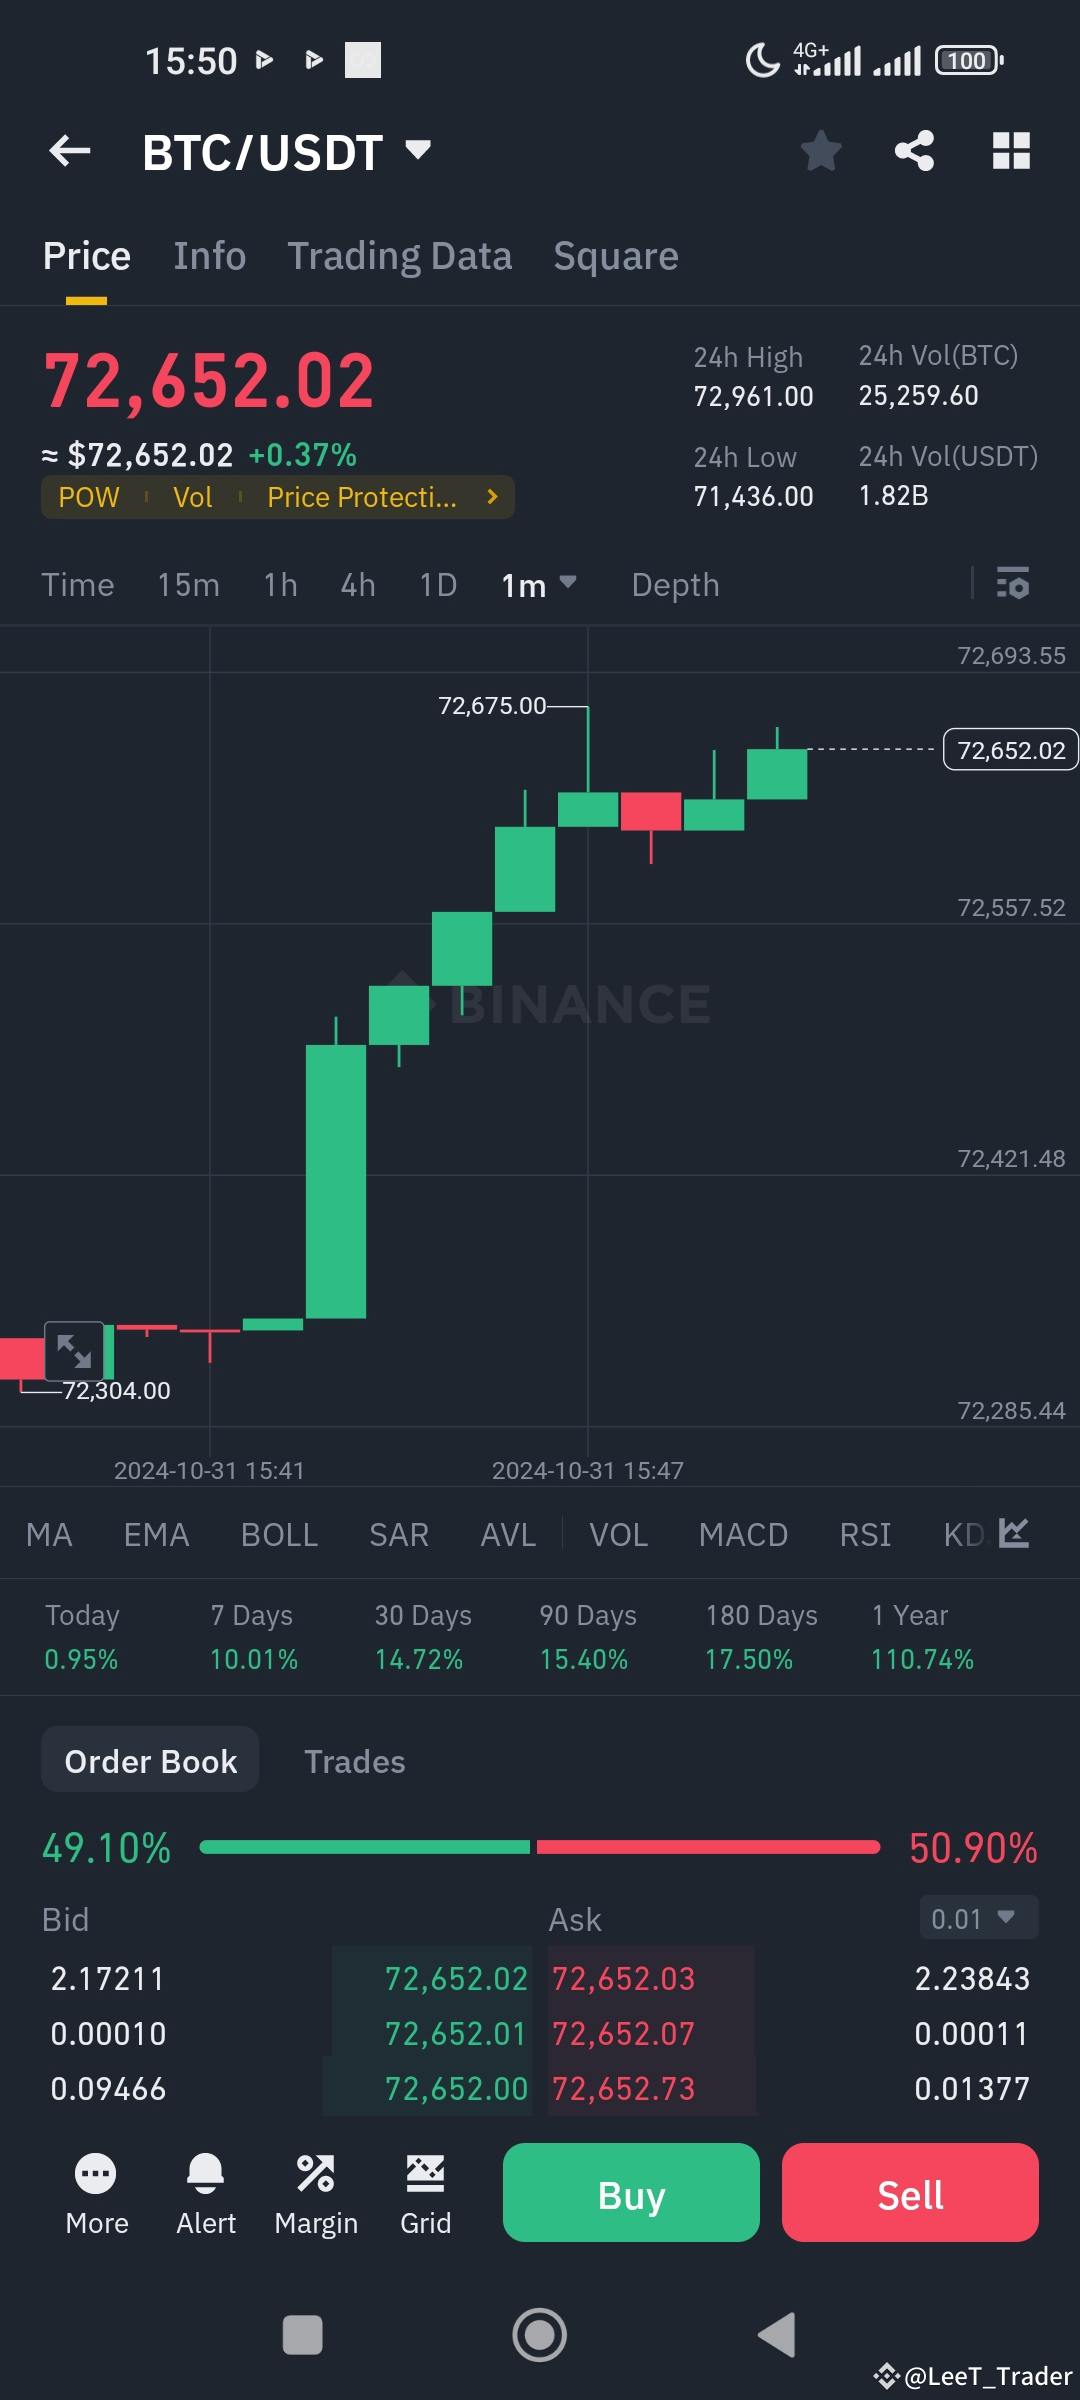
اجعل نفسك مؤشراً بدلاً من استخدام المؤشرات، امنح وقتك للرسوم البيانية، وحل الألغاز وراءها، انظر إلى السحر لتصبح مربحاً #SaylorBTCPurchase #TRXETF #BNBChainMeme #PowellRemarks
عرض الترجمة
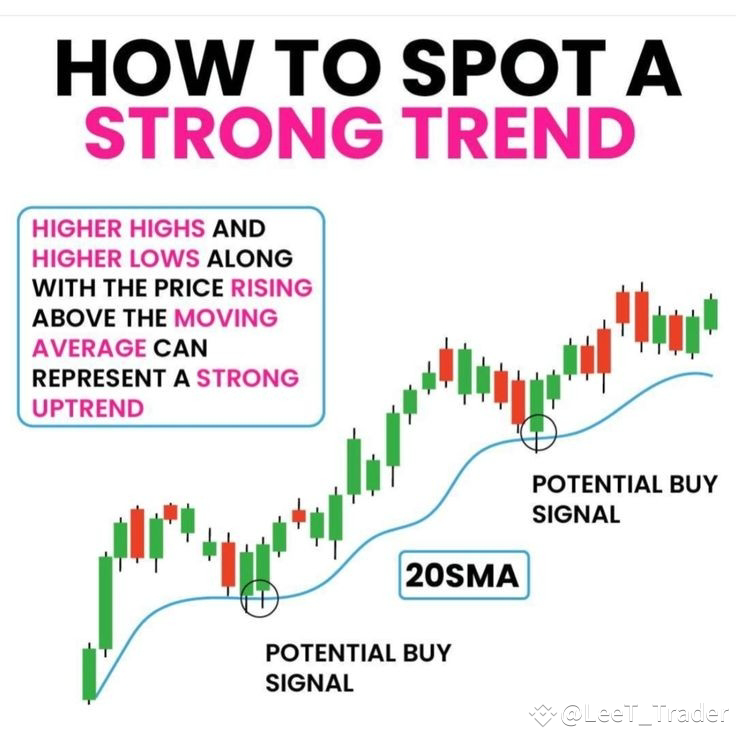
How to Spot a Strong Trend with the 20-SMA
Explained .
The 20-SMA is a line on a chart that represents the average closing price of an asset over the past 20 trading days. It smooths out price fluctuations, making it easier to identify trends.
Identifying Upward Trends
Price Above the 20-SMA: When the price of an asset is consistently above the 20-SMA, it indicates a bullish trend.
Steep Slope of the 20-SMA: A steeply sloping 20-SMA suggests a strong and accelerating upward trend.
Price Pullbacks to the 20-SMA: During upward trends, the price may pull back to the 20-SMA and then bounce back higher, confirming the strength of the trend.
Identifying Downward Trends
Price Below the 20-SMA: When the price of an asset is consistently below the 20-SMA, it indicates a bearish trend.
Steeply Sloping Downward 20-SMA: A steeply sloping downward 20-SMA suggests a strong and accelerating downward trend.
Price Rallies to the 20-SMA: During downward trends, the price may rally to the 20-SMA and then fall back lower, confirming the strength of the trend.
Explained .
The 20-SMA is a line on a chart that represents the average closing price of an asset over the past 20 trading days. It smooths out price fluctuations, making it easier to identify trends.
Identifying Upward Trends
Price Above the 20-SMA: When the price of an asset is consistently above the 20-SMA, it indicates a bullish trend.
Steep Slope of the 20-SMA: A steeply sloping 20-SMA suggests a strong and accelerating upward trend.
Price Pullbacks to the 20-SMA: During upward trends, the price may pull back to the 20-SMA and then bounce back higher, confirming the strength of the trend.
Identifying Downward Trends
Price Below the 20-SMA: When the price of an asset is consistently below the 20-SMA, it indicates a bearish trend.
Steeply Sloping Downward 20-SMA: A steeply sloping downward 20-SMA suggests a strong and accelerating downward trend.
Price Rallies to the 20-SMA: During downward trends, the price may rally to the 20-SMA and then fall back lower, confirming the strength of the trend.
سجّل الدخول لاستكشاف المزيد من المُحتوى