
### PEPE Token: Critical Analysis and Future Movement Predictions
**Current Status:**
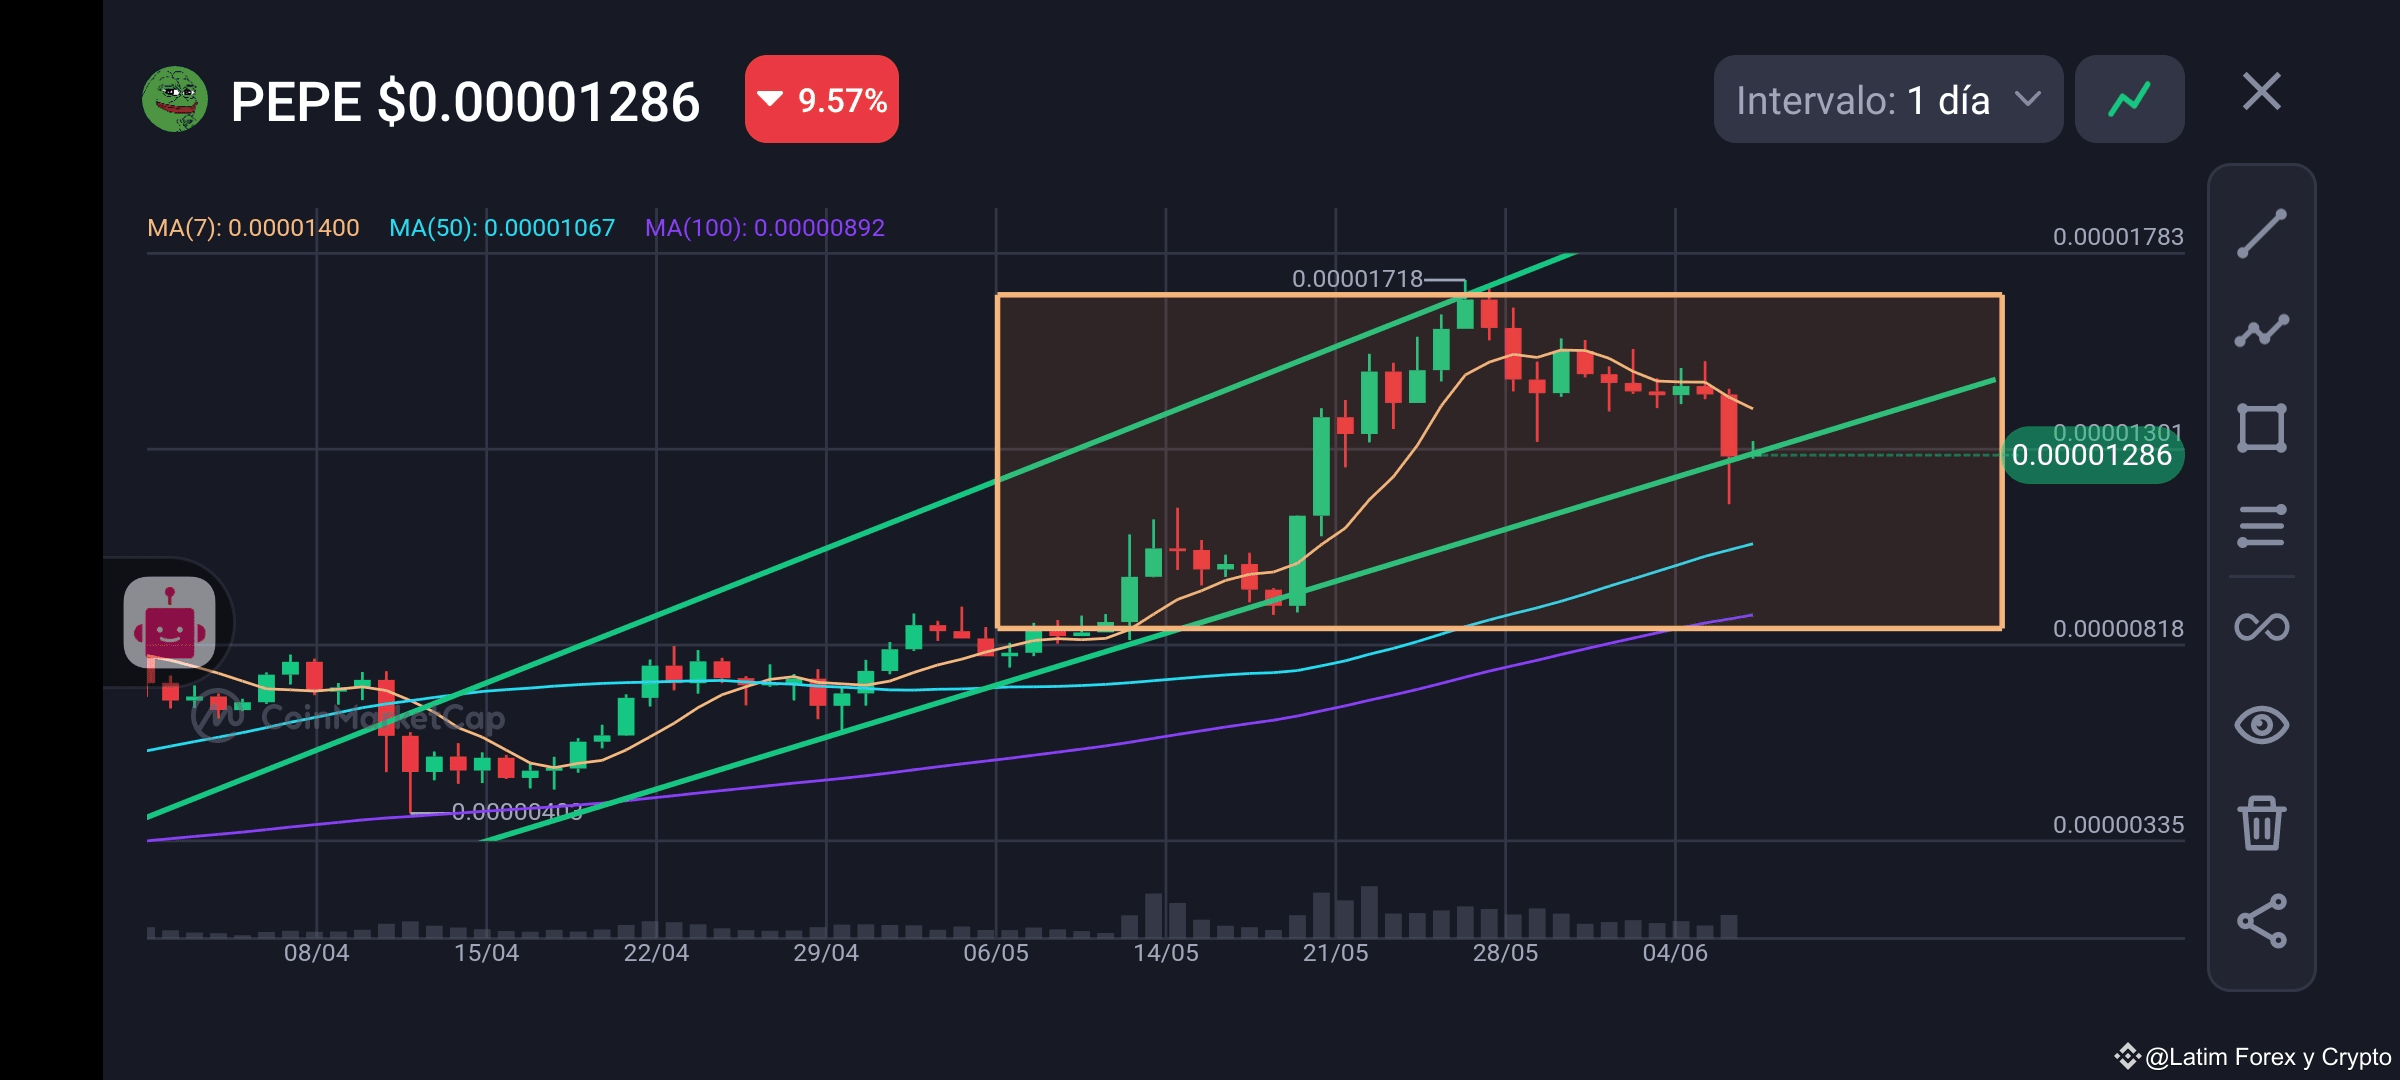
- **Price:** $0.00001286 (down 9.57%)
- **Moving Averages:**
- **MA(7):** $0.00001400
- **MA(50):** $0.00001067
- **MA(100):** $0.00000892
**Technical Overview:**
1. **Recent Performance:**
- The PEPE token has experienced a significant drop, currently down by 9.57%.
- The price has fallen below the 7-day moving average but remains above the 50-day and 100-day moving averages, indicating a potential for short-term recovery.
2. **Trend Analysis:**
- **Support and Resistance Levels:**
- **Immediate Support:** $0.00000818
- **Immediate Resistance:** $0.00001783
- The price is currently within an upward channel, despite the recent dip.
- The PEPE token had previously reached a high of $0.00001718 before correcting downwards.
**Possible Scenarios for Future Movement:**
1. **Bullish Scenario:**
- **Recovery Above Resistance:** If the PEPE token can recover and break above the resistance at $0.00001301, it might aim for the previous high at $0.00001718, and potentially test the upper channel resistance at $0.00001783.
- **Support from Moving Averages:** The 50-day and 100-day moving averages provide strong support, indicating that the token could rebound from the current level.
2. **Bearish Scenario:**
- **Failure to Hold Support:** If the price continues to drop and breaks below the support at $0.00001286, it could test the lower channel support at $0.00000818.
- **Continued Downward Pressure:** A sustained break below the lower channel could lead to further declines, with the next significant support at $0.00000335.
### Conclusion:
Our previous prediction of a downward correction has been realized as the PEPE token is currently experiencing a pullback. The immediate future will depend heavily on how the price interacts with the current support and resistance levels. A rebound above the 7-day moving average could signal a bullish recovery, while a break below the current support levels could indicate further declines. Traders should watch these key levels closely to gauge the token's next moves.