
Ethereum (ETH) Technical Analysis: Strong Range Bound, Waiting for Breakout
Ethereum (ETH) is currently trading at $1855 level, after experiencing a recent drop from $2050 to $1800. In this technical analysis, we will examine the current chart patterns, identify the key support and resistance levels, and discuss potential scenarios for the future direction of Ethereum's price.
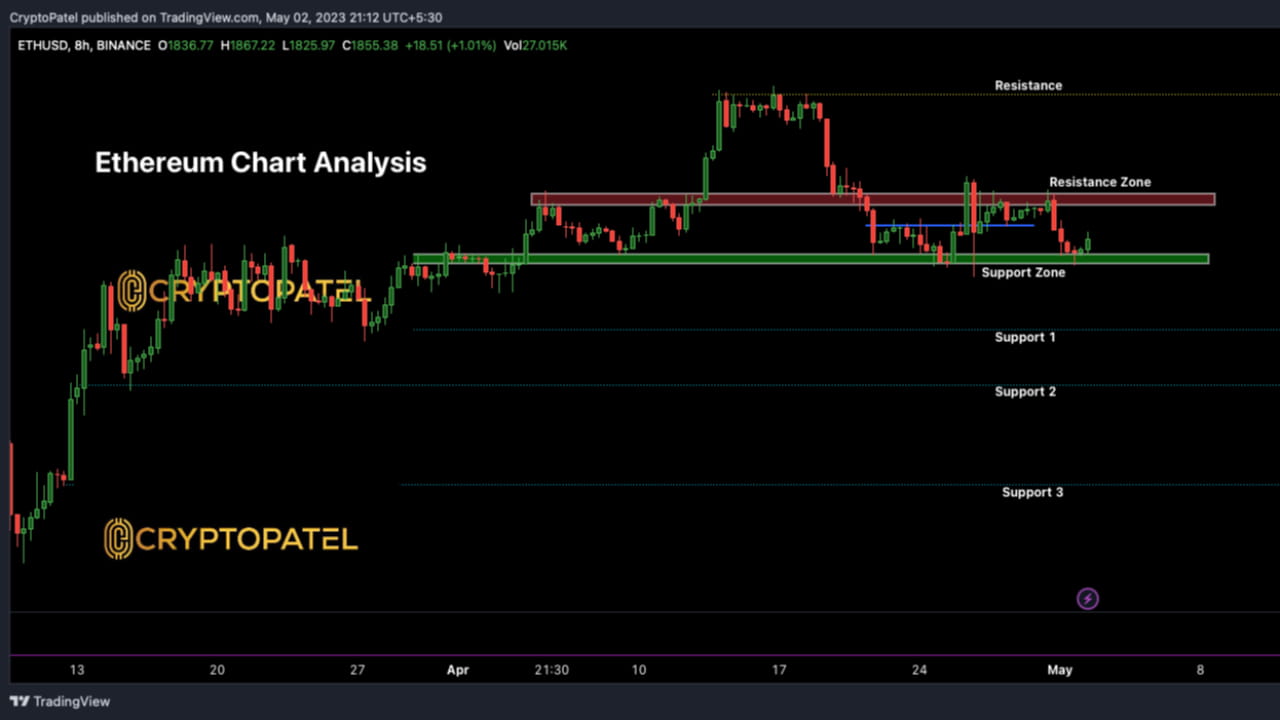
Technical Analysis Chart :
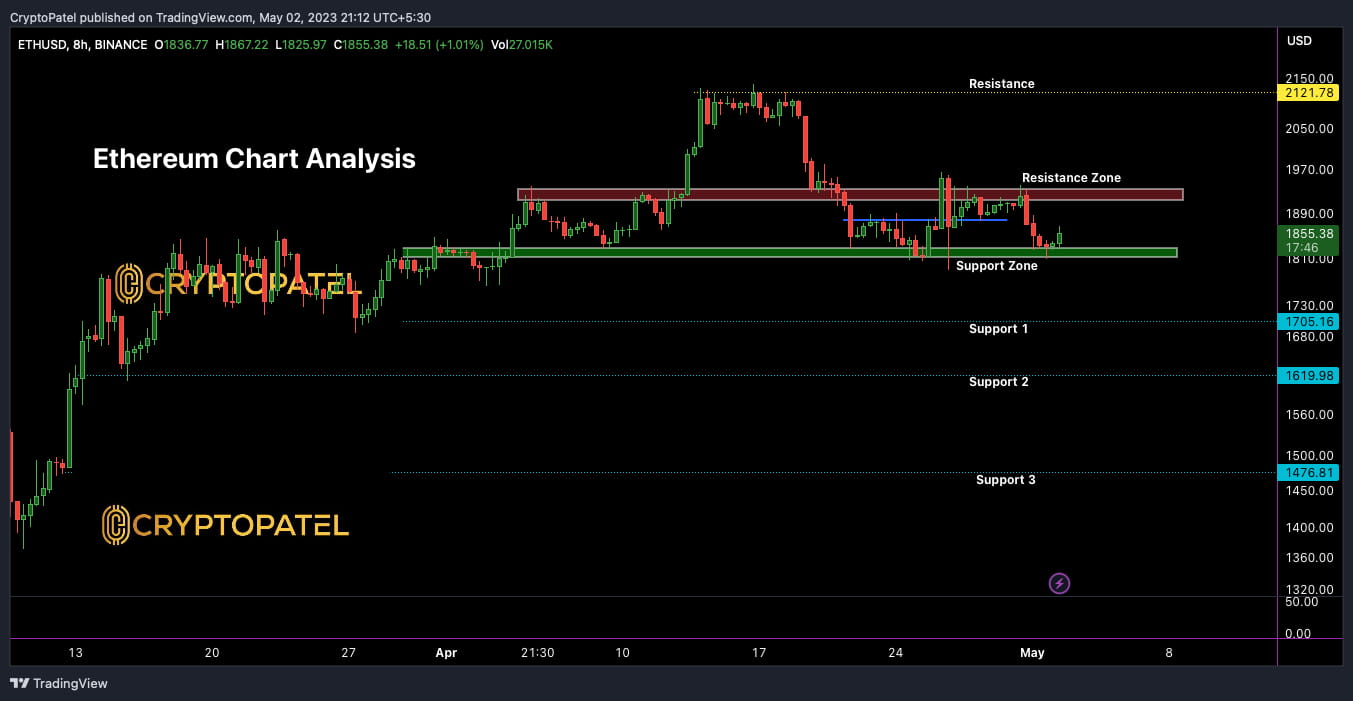
The Ethereum chart indicates a range-bound market between $1800 and $1930, with strong support at $1800 and strong resistance at $1930. The chart suggests that Ethereum's price is currently consolidating within this range, waiting for a breakout.Scenario 1:
If the $1800 support level breaks down, we could potentially see a further drop in price to the $1400-$1500 range in the short term.
Scenario 2:
If the support level at $1800 holds, we could potentially see a rise in price towards the resistance level at $1930. A breakout above this level could lead to a further rise towards $2100 or even $2500.
CryptoPatel Levels:
According to CryptoPatel, a cryptocurrency analyst, the key support levels for Ethereum are $1800, $1700, $1619, and $476, while the key resistance levels are $1930 and $2100.
Conclusion:
Based on the current chart analysis, Ethereum is currently range-bound and waiting for a breakout. There are two potential scenarios for Ethereum's price direction, with the key support and resistance levels identified. As always, it's important to conduct your own research and analysis before investing in any coins.
Hey, it's CryptoPatel here!
I'm passionate about providing you with the latest insights and analysis on the world of cryptocurrencies.
If you enjoy my content and want to show your support, please like, share, and follow me for more high-quality updates.
Thank you for your support, and let's continue to stay connected for more exciting content!
LIKE ❤️
Share ⏩
Follow 🤝