
MMT Price Analysis, Latest Crypto News & Technical Outlook (MMT/USDT)
2. Introduction & Market Overview
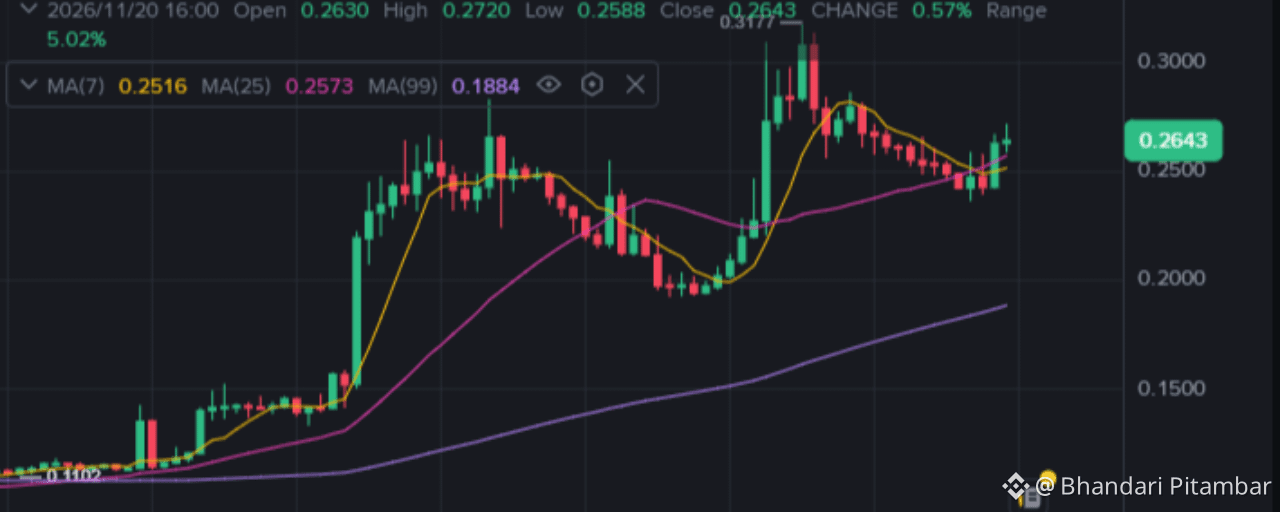
MMT/USDT is showing a developing bullish recovery on the 1-hour chart, with the price trading around $0.2654 in the latest visible candle.
The chart shows a strong upward move from approximately $0.11–$0.15, followed by a rally toward $0.31, a corrective decline toward $0.19, and another recovery toward $0.27.
The immediate technical picture is cautiously bullish, but the market has not yet confirmed a sustained breakout above the recent resistance zone.
Important chart observations:
Latest visible price: $0.2654.
Latest candle change: +0.98%.
Price is above MA(7), MA(25), and MA(99).
MA(7): $0.2517.
MA(25): $0.2573.
MA(99): $0.1884.
Recent visible swing high: approximately $0.3174.
Recent corrective low: approximately $0.19.
These readings suggest improving short-term momentum and a stronger broader 1-hour trend, although the short moving averages have not yet established a fully bullish alignment.
3. Today's Global Crypto Market News
Overall market: Risk-off
The broader cryptocurrency market is experiencing significant selling pressure on November 20, 2026. Bitcoin and Ethereum weakness, institutional fund withdrawals, and expectations of tighter Federal Reserve policy are weighing on investor confidence.
Bitcoin and Ethereum face renewed selling pressure
Date: November 20, 2026
Bitcoin traded around $61,700–$62,100 in reports published today.
Ethereum traded around $1,735–$1,755.
Total cryptocurrency market capitalization was reported near $2.14 trillion.
The market Fear & Greed Index reached 12, indicating Extreme Fear.
Why it matters: Bitcoin weakness can reduce risk appetite across altcoins, particularly smaller DeFi tokens such as MMT.
Source: Coinucation, November 20, 2026.
Coinucation+1
Institutional ETF outflows increase
U.S. spot Bitcoin ETFs experienced approximately $306.5 million in net outflows on November 18, while seven-day withdrawals reached approximately $1.40 billion.
Ethereum investment products also experienced substantial withdrawals.
Market impact: Persistent ETF outflows suggest weaker institutional demand and can create additional pressure on speculative cryptocurrency assets.
Source: Coinucation, November 20, 2026.
Coinucation+1
Federal Reserve policy uncertainty
Reports published November 19–20 highlighted hawkish Federal Reserve meeting minutes and increasing expectations of another interest-rate increase.
Higher interest rates can strengthen the appeal of traditional yield-bearing investments relative to speculative assets.
Potential impact on MMT: If macroeconomic risk aversion continues, MMT could experience profit-taking even if its individual technical structure remains positive.
Source: Delta Exchange, November 20, 2026.
Delta Exchange India+1
Institutional and market developments
Other developments worth monitoring include:
Anthropic's Nasdaq debut and the associated rotation of investor capital.
Continued volatility in technology stocks.
Changes in stablecoin supply and cryptocurrency liquidity.
Increased attention to tokenized real-world assets.
These developments may influence broader risk appetite, but there is insufficient evidence to attribute MMT's price movement directly to any single event.
Coinucation+2
4. MMT Latest News & Fundamental Analysis
What is Momentum (MMT)?
MMT is the governance token of the Momentum ecosystem, a decentralized finance project operating within the Sui ecosystem.
Its token utility includes:
Governance participation.
veMMT voting and bonding mechanisms.
Ecosystem incentive distribution.
Participation in certain ecosystem products.
Community and liquidity incentives.
According to the project's official documentation, locking MMT generates veMMT, with governance power influenced by the amount locked and the duration of the lock.
Momentum+1
MMT tokenomics
Third-party market data, November 20, 2026
Metric
Reported value
Maximum supply
1 billion MMT
Circulating supply
204.10 million MMT
Circulating percentage
20.41%
Market capitalization
Approximately $48–54 million
Fully diluted valuation
Approximately $244–263 million
CoinGlass+2
Important fundamental consideration: Only around 20.4% of the maximum supply is currently circulating. This creates potential dilution risk as additional tokens enter circulation.
Upcoming token unlock
According to Tokenomics.com, the next scheduled unlock is December 4, 2026:
Tokens: approximately 12.3 million MMT.
Estimated value: $2.8 million.
Percentage of maximum supply: approximately 1.23%.
Estimated percentage of market capitalization: 4.2%.
The unlock is a potential supply-side risk, particularly if recipients sell their allocations. However, an unlock does not automatically mean that tokens will be sold.
Tokenomics.com
Fundamental outlook
The project has identifiable governance and ecosystem utility, but token price appreciation ultimately depends on actual adoption, liquidity, protocol activity, and demand for MMT.
The strongest fundamental risks are:
Low circulating supply relative to maximum supply.
Future vesting and token unlocks.
Dependence on sustained ecosystem growth.
Potential speculative trading dominating fundamental demand.
There is insufficient verified evidence in the available research to confirm a new major partnership, network upgrade, or exchange listing announcement specifically on November 20.
5. Live Market Analysis (November 20, 2026)
Multiple market feeds show different prices
The chart and third-party market feeds are not perfectly synchronized. The following analysis distinguishes the chart's last visible price from subsequently retrieved market data.
MMT/USDT — LAST VISIBLE CHART PRICE
$0.2654
+0.98% candle change
1-hour chart
Open
$0.2630
High
$0.2720
Low
$0.2588
Close
$0.2654
MA(7)
$0.2517
MA(25)
$0.2573
MA(99)
$0.1884
Visible volume (MMT)
2.252M
Market-data comparison
CoinGlass reported MMT around $0.2378 in one November 20 snapshot and around $0.2439–$0.2626 in other market-data snapshots. These observations have different update times and should not be treated as simultaneous quotes.
CoinGlass+2
Price and volume interpretation
The visible chart indicates that MMT has recovered above its three displayed moving averages.
However, the latest visible candle volume is considerably smaller than the exceptional volume bars during the earlier upward breakout.
This suggests that the current recovery needs additional buying-volume confirmation.
Live market assessment:
Short-term direction: Bullish recovery.
Medium-term visible trend: Bullish.
Immediate momentum: Improving.
Breakout confirmation: Not yet established.
Volatility: Elevated.
Exact current 24-hour volume, market capitalization, and liquidity cannot be reliably combined with the chart snapshot because the available feeds have different timestamps.
6. 24-Hour Candlestick Pattern Analysis
The available chart displays the 1-hour timeframe. It does not provide independently readable 5-minute, 15-minute, 4-hour, and daily candles, so those patterns cannot be verified from this chart.
1-hour candlestick structure
The chart shows three major phases:
Phase 1: Initial accumulation and breakout
MMT traded around $0.11–$0.15 before experiencing a substantial upward expansion.
The breakout was accompanied by increased trading volume, suggesting meaningful buying participation.
Phase 2: Strong rally and distribution risk
The price advanced toward approximately $0.25–$0.27 before extending toward $0.31.
Large volume bars appeared during this advance.
The move was followed by rejection near $0.31, indicating that sellers were active at higher prices.
Phase 3: Correction and recovery
Following the rejection, MMT declined toward approximately $0.19.
The price subsequently recovered and moved back above MA(7) and MA(25).
This recovery indicates improving short-term demand.
Latest candle interpretation
Component
Observation
Open
$0.2630
High
$0.2720
Low
$0.2588
Close
$0.2654
Candle direction
Bullish
Upper wick
$0.0066
Lower wick
$0.0042
The candle closed above its opening price, indicating buying pressure during the visible period.
However, the upper wick indicates some rejection near $0.2720.
Multi-timeframe assessment
Timeframe
Assessment
Confirmation
5-minute
Unavailable
Fresh candles required
15-minute
Unavailable
Fresh candles required
1-hour
Bullish recovery
Price above displayed MAs
4-hour
Not independently verified
Full candles required
Daily
Not independently verified
Full candles required
Candlestick conclusion: The 1-hour structure supports a bullish recovery, but the $0.27–$0.28 area remains important for determining whether the next upward expansion can develop.
7. Complete Technical Indicator Analysis
Moving average analysis
The displayed moving averages provide the clearest technical evidence.
Indicator
Value
Signal
MA(7)
$0.2517
Bullish
MA(25)
$0.2573
Price below MA
MA(99)
$0.1884
Bullish
The price at $0.2654 is above all three averages.
However, MA(7) remains below MA(25), so the shorter moving-average alignment has not fully confirmed a bullish crossover.
Interpretation:
Price above MA(7): Positive short-term momentum.
Price above MA(25): Recovery above the intermediate average.
Price above MA(99): Stronger underlying trend.
MA(7) below MA(25): Some remaining short-term weakness.
Momentum indicators
Indicator
Reading
Signal
RSI(14)
Not available
Unconfirmed
Stochastic RSI
Not available
Unconfirmed
MACD
Not available
Unconfirmed
ROC
Not available
Unconfirmed
ADX/DMI
Not available
Unconfirmed
These indicators cannot be calculated reliably from the visible screenshot alone.
Volatility and volume
Indicator
Assessment
Bollinger Bands
Unavailable
ATR
Unavailable
VWAP
Unavailable
OBV
Unavailable
MFI
Unavailable
Volume Profile
Unavailable
The most important visible volume observation is the substantial increase in participation during the earlier breakout, followed by declining activity during the latest consolidation.
This suggests that buyers need to demonstrate renewed participation before another strong upward move can be considered confirmed.
Fibonacci retracement analysis
Using the approximate visible swing low of $0.19 and swing high of $0.3174 as reference points:
Fibonacci level
Approximate price
23.6%
$0.2873
38.2%
$0.2687
50%
$0.2537
61.8%
$0.2387
78.6%
$0.2175
These are estimated retracement levels, not independently verified trading indicators.
The current price is close to the 38.2% retracement level, making the $0.268–$0.272 region important for short-term confirmation.
Technical indicator conclusion: The available moving averages favor buyers, but missing RSI, MACD, and volatility readings prevent a complete momentum confirmation.
8. Market Structure, Smart Money & Derivatives Sentiment
Market structure
MMT's visible 1-hour price structure shows:
An initial accumulation region around $0.11–$0.15.
A bullish breakout toward $0.25.
An extension toward $0.31.
A corrective decline toward $0.19.
A recovery toward $0.2654.
The recovery suggests improving market structure.
However, the price still needs to break the previous resistance region to establish another convincing higher high.
Smart Money Concepts
Concept
Current assessment
Higher-high structure
Earlier rally established a higher high
Higher-low structure
Recovery developing after correction
Bullish BOS
Requires a confirmed break above recent swing resistance
Bearish CHoCH
Possible if important recovery support fails
Bullish order block
Approximate $0.19–$0.21 demand region
Supply zone
Approximately $0.28–$0.317
Liquidity above price
$0.272–$0.28 and $0.30–$0.317
Liquidity below price
$0.258–$0.25 and $0.22–$0.20
These are chart-based zones, not verified institutional order-book positions. Exact fair value gaps and order blocks require lower-timeframe candle data.
Derivatives market analysis
CoinGlass market data provides additional information about MMT derivatives positioning.
Reported November 20, 2026; third-party derivatives snapshot
Metric
Reported reading
Open interest
Approximately $53.49M
24h OI change
+11.41%
Funding rate
-0.0012% / 8h
Futures volume
Approximately $987M
Spot volume
Approximately $134M
24h liquidations
Approximately $4.16M
Short liquidation share
Approximately 67%
CoinGlass
What does this mean?
Rising open interest indicates increased derivatives participation.
Negative funding indicates shorts are paying longs.
A large share of short liquidations suggests short positions contributed to the recent upward price movement.
Futures turnover substantially exceeds spot turnover, indicating significant speculative participation.
One important warning: open interest relative to market capitalization was reported above 100%. This indicates an unusually leveraged market relative to its reported capitalization.
A sudden reversal could therefore produce substantial volatility.
Derivatives sentiment conclusion
Bullish price action, elevated leverage risk
The derivatives data supports a short-term bullish recovery, but it also reveals vulnerability to liquidation-driven price movements.
The latest data does not establish whether the next move will be a continuation rally or a leveraged correction.
9. Bitcoin & Broader Crypto Market Impact
MMT is trading in a difficult broader market environment.
Bitcoin performance
Bitcoin was reported around $61,700–$62,100 on November 20, while broader market reports described persistent institutional selling pressure.
Coinucation+1
This creates a challenging environment for speculative altcoins.
Ethereum performance
Ethereum was reported around $1,735–$1,755.
Its weakness reflects the broader reduction in cryptocurrency risk appetite.
Coinucation+1
Global market conditions
Market factor
Current assessment
Bitcoin
Bearish pressure
Ethereum
Bearish pressure
ETF flows
Negative
Investor sentiment
Extreme Fear
Institutional demand
Weakening
Altcoin environment
Cautious
MMT individual momentum
Bullish recovery
How could this affect MMT?
There are two competing forces.
Positive factor: MMT is demonstrating relative short-term strength despite weakness in the wider cryptocurrency market.
Negative factor: If Bitcoin experiences another significant decline, speculative capital may leave smaller cryptocurrencies.
Therefore, MMT's immediate technical recovery should not be interpreted as evidence that the entire altcoin market has turned bullish.
10. Key Support & Resistance Levels
The following levels combine the visible chart, displayed moving averages, and approximate historical swing regions.
Support levels
Support zone
Price
Importance
Immediate support
$0.258–$0.260
Latest candle low region
Short-term support
$0.251–$0.253
MA(7) region
Intermediate support
$0.238–$0.245
Retracement and recovery area
Strong support
$0.220–$0.224
Previous swing support
Major support
$0.190–$0.200
Previous corrective low
Resistance levels
Resistance zone
Price
Importance
Immediate resistance
$0.272–$0.275
Recent candle high
Short-term resistance
$0.280–$0.287
Breakout confirmation area
Intermediate resistance
$0.300–$0.305
Psychological and supply region
Major resistance
$0.310–$0.3174
Previous swing high
Important breakout and breakdown triggers
Bullish breakout
Above $0.275
A convincing 1-hour close above $0.275, supported by increasing volume, would strengthen the bullish continuation scenario.
Bearish breakdown
Below $0.250
A confirmed 1-hour close below $0.250 would weaken the recovery and increase the probability of a deeper correction.
Major bullish target
$0.3174
A successful move through $0.30 could expose the previous swing high.
11. Bullish, Bearish & Neutral Price Scenarios
Bullish scenario
Bullish continuation
The bullish scenario requires MMT to maintain support above $0.258 and break through $0.272–$0.275.
Potential upside targets:
Target
Price
Target 1
$0.280
Target 2
$0.287
Target 3
$0.300
Target 4
$0.3174
Bullish confirmation conditions:
1-hour candle closes above $0.275.
Trading volume increases during the breakout.
Price maintains support above $0.258.
MA(7) moves above MA(25).
Bitcoin stabilizes instead of extending its decline.
If these conditions develop, MMT could attempt another move toward $0.30–$0.3174.
Bearish scenario
Correction risk
The bearish scenario becomes more likely if MMT fails to maintain its recovery.
Potential downside targets:
Target
Price
Target 1
$0.251
Target 2
$0.245
Target 3
$0.238
Target 4
$0.223
Major downside
$0.190–$0.200
Bearish confirmation conditions:
Rejection around $0.272–$0.275.
Increasing selling volume.
A 1-hour close below $0.250.
MA(7) turns downward.
Bitcoin experiences another significant decline.
A break below $0.223 would substantially weaken the visible recovery structure.
Neutral scenario
Sideways consolidation
MMT could consolidate between approximately $0.250 and $0.280.
In this situation:
Buyers may defend $0.250–$0.258.
Sellers may continue defending $0.272–$0.280.
Trading volume may gradually decline.
Price may fluctuate without establishing a decisive trend.
A breakout above $0.280 or breakdown below $0.250 would provide a stronger directional signal.
Scenario comparison
Scenario
Trigger
Potential destination
Bullish
Above $0.275
$0.287–$0.3174
Neutral
$0.250–$0.280
Consolidation
Bearish
Below $0.250
$0.245–$0.190
These are conditional scenarios, not guaranteed forecasts.
12. Trading Strategy & Risk Management
I'm not a financial advisor. The following setups are conditional technical scenarios, not personalized investment recommendations.
Short-term trading strategy
Potential long setup
Parameter
Price
Entry zone
$0.258–$0.262
Stop-loss
$0.248
Take-profit 1
$0.275
Take-profit 2
$0.287
Take-profit 3
$0.300
Conditions:
Price must hold the entry region.
A bullish confirmation candle should develop.
Buying volume should increase.
Avoid entering immediately after an extended green candle.
Breakout trading setup
Parameter
Price
Entry confirmation
Above $0.275
Stop-loss reference
$0.263
Take-profit 1
$0.287
Take-profit 2
$0.300
Take-profit 3
$0.3174
A breakout should be confirmed by a completed candle rather than a temporary price spike.
Potential short setup
Parameter
Price
Entry confirmation
Below $0.250
Stop-loss reference
$0.262
Take-profit 1
$0.245
Take-profit 2
$0.238
Take-profit 3
$0.223
This setup becomes relevant only if the support breakdown is confirmed by selling volume.
Risk management rules
Risk only a small percentage of trading capital per position.
Avoid excessive leverage because MMT derivatives positioning is elevated.
Do not enter during sudden price spikes without confirmation.
Calculate position size using the distance between entry and stop-loss.
Avoid chasing the price near major resistance.
Monitor Bitcoin before opening an altcoin position.
Reassess the setup if MMT closes below its invalidation level.
Most important consideration: MMT has already experienced a substantial rally. Entering after an extended move without a pullback or confirmed breakout creates unfavorable risk.
13. Final Global Market Conclusion & Analyst Outlook
What is happening in today's global crypto market?
The global cryptocurrency market remains under pressure on November 20, 2026.
Bitcoin and Ethereum are experiencing weakness, institutional ETF withdrawals remain a concern, and Federal Reserve policy uncertainty is reducing speculative risk appetite.
The broader market bias is bearish.
What are the strongest drivers for MMT?
The most important positive technical factors are:
Price trading above all three displayed moving averages.
Recovery from approximately $0.19.
Earlier breakout accompanied by increased trading volume.
Positive short-term price momentum.
Significant derivatives participation and short liquidations.
The main fundamental and market risks are:
Low circulating supply relative to maximum supply.
Upcoming token unlocks.
Elevated derivatives leverage.
Futures activity substantially exceeding spot activity.
Weakness across the broader cryptocurrency market.
What levels should traders monitor over the next 24–48 hours?
The most important levels are:
$0.275
Bullish breakout confirmation
$0.258–$0.250
Critical short-term support
$0.300–$0.3174
Major upside resistance
$0.223–$0.190
Deeper correction zone
What is the medium-term outlook?
The medium-term outlook remains cautiously positive from the available 1-hour chart structure, but a sustained bullish trend requires confirmation.
If MMT maintains support above $0.250 and breaks above $0.275 with increasing volume, the price could attempt to revisit $0.30–$0.3174.
Conversely, a breakdown below $0.250 could expose lower support levels around $0.238 and $0.223.
The December 4 token unlock also deserves attention because additional circulating supply could increase selling pressure.
Final analyst assessment
MMT is demonstrating relative technical strength while the wider cryptocurrency market remains weak.
The immediate opportunity for bullish continuation depends on whether buyers can overcome the $0.272–$0.275 resistance region.
However, the combination of elevated leverage, declining spot participation in some market snapshots, and broader macroeconomic uncertainty makes chasing the current price risky.
OVERALL CRYPTO MARKET BIAS: BEARISH — Bitcoin and Ethereum remain under pressure, institutional ETF outflows are weakening sentiment, and macroeconomic uncertainty is reducing appetite for speculative assets.
SELECTED COIN MARKET BIAS: BULLISH — MMT's visible 1-hour structure shows a recovery above its moving averages, supported by strong recent derivatives activity. However, confirmation above $0.275 is necessary, while $0.250 remains an important downside level.