
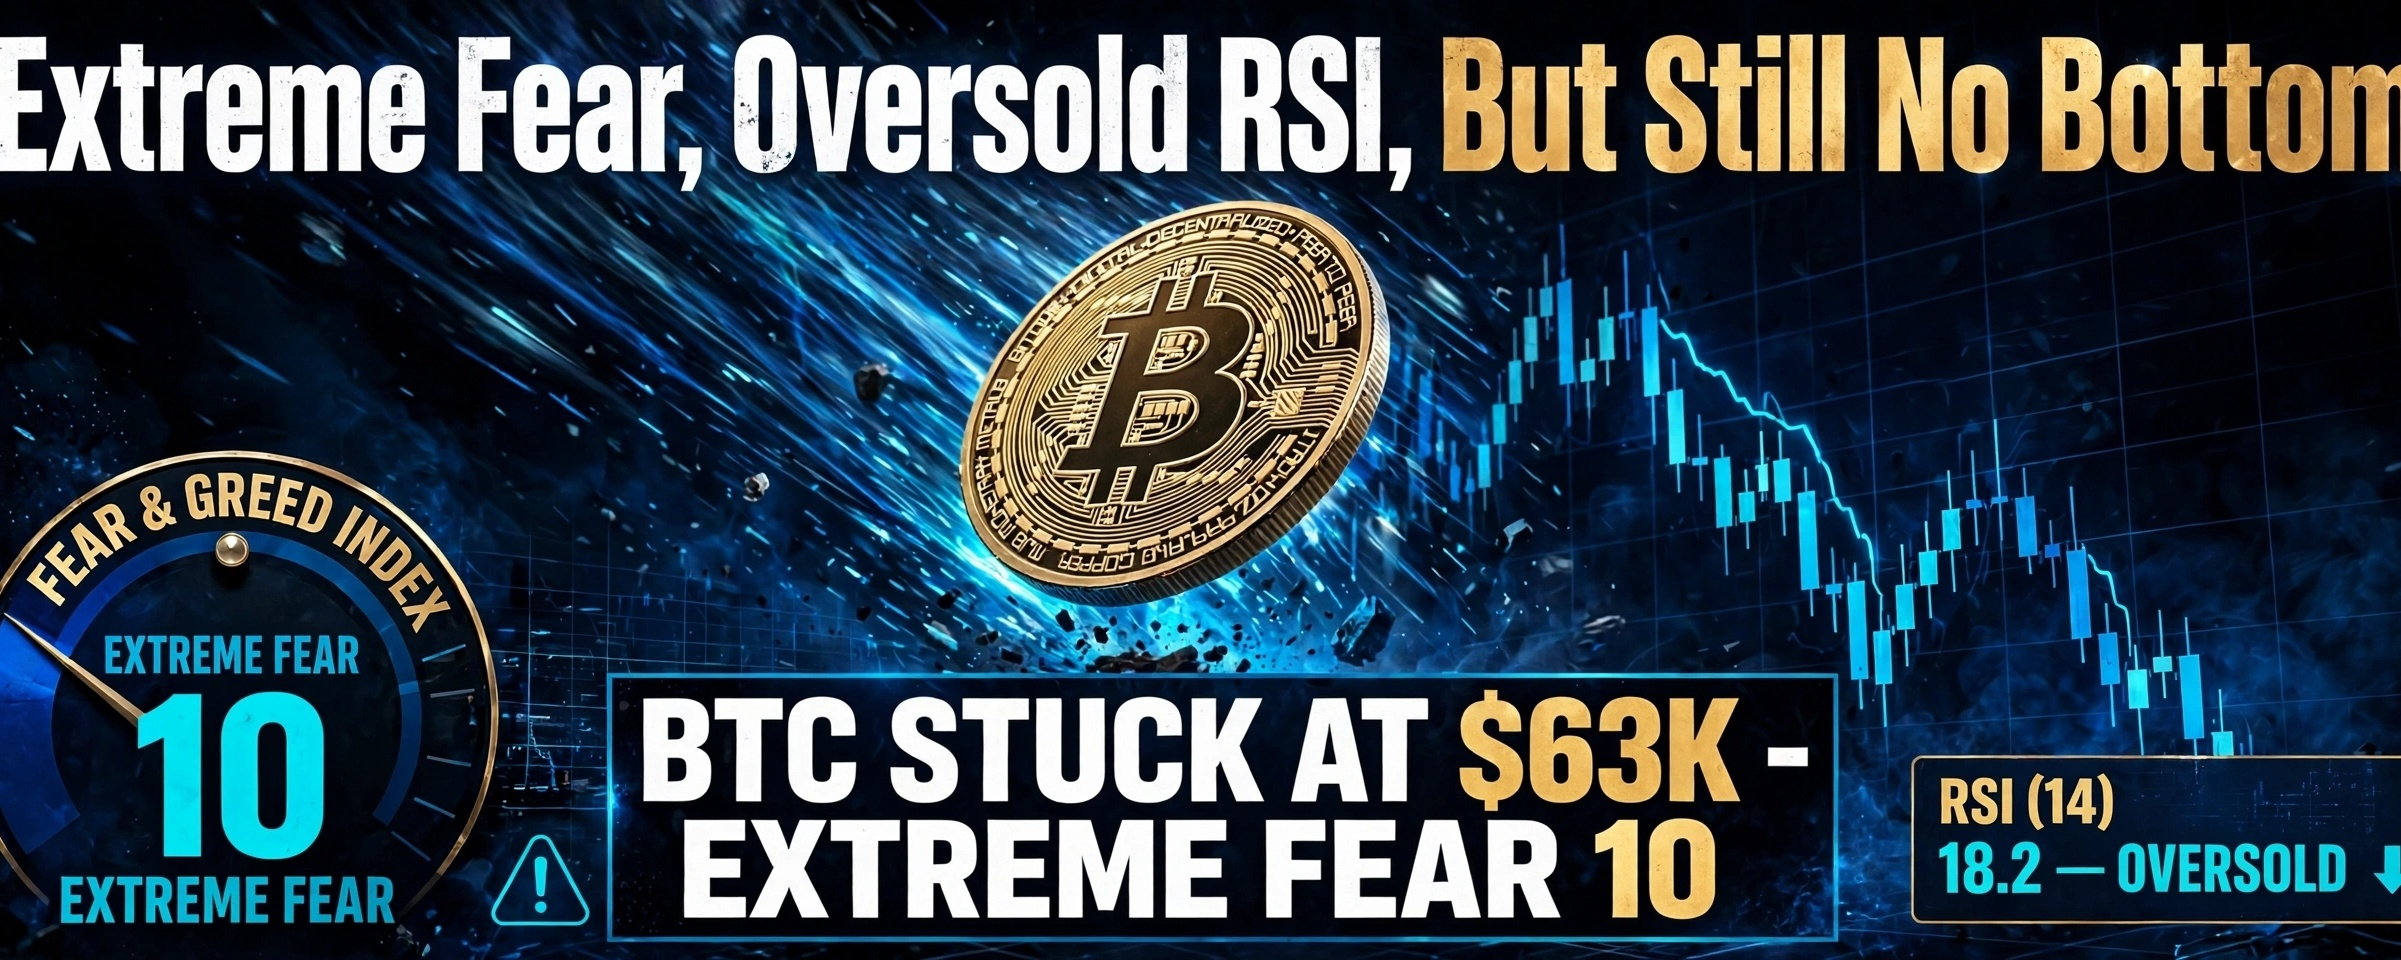

Extreme Fear, Oversold RSI, But Still No Bottom: Why Bitcoin Is Stuck At $63K After Hawkish FOMC Minutes
Market Snapshot - 19 Nov 2026
Bitcoin is trading around $62,891 - $63,400, after hitting a 24h low of $62,062 and a high of $64,080. In the last 7 days, BTC is down -12% to -14%, and down -28% Year-To-Date. Total crypto market cap is $2.18T - $2.19T, down -2.64% in 24h. f722aff0
Ethereum is holding above $1,787 - $1,811, up +0.90% in 24h but still down -10.7% in 7 days. BTC Dominance is 58.1%, which means money is not rotating to alts, it is leaving the market or sitting in stablecoins. aff0
And the most important number today: Crypto Fear & Greed Index is 10/100 - Extreme Fear. This is the lowest reading of this cycle. Yesterday it was 11, last week it was 28, last month it was 55. a613
This is not a normal dip. This is a macro-driven reset.
1. What Actually Happened? The Fed Changed The Game
The trigger was the FOMC Minutes from the October 27-28 meeting, released on Wednesday, Nov 18.
Almost all officials said further rate hikes "would likely be appropriate" to bring inflation back to 2%. A couple of officials even said an increase of more than 25 basis points could be considered in December if inflation data stays hot.
That changed everything. Markets are now pricing ∼96% chance of a 25bp hike on Dec 9, and a growing chance of another hike in January. Fed Governor Waller even called for a shock 50bp hike in December.
Result: Dollar Index jumped to 103.91, its highest since April 2025, and 10-year Treasury yield rose to 5.09%. When the dollar pays 5%, why would big money hold a non-yielding asset like Bitcoin?
2. Institutions Are Selling, Not Buying The Dip
This is the second problem, and it is bigger than the Fed.
US spot Bitcoin ETFs saw $306 million outflows on Wednesday alone, after $239 million on Tuesday. Total November outflows are now around $2.9 Billion. BlackRock's IBIT led the selling with $148.7M outflow in one session. cd4e
In the last 10 sessions through Nov 13, ETFs had already lost $2.6 Billion. Stablecoin supply also fell by $14-17 Billion in 30 days to around $244 Billion. That means there is less ready cash on exchanges to buy the dip.
On-chain data shows the average ETF holder bought near $82,300. With BTC at $63K, the typical holder is ∼21% underwater. That is capitulation, not profit-taking.
3. Technical Analysis: Oversold, But Still Bearish
This is where new traders get trapped.
Yes, RSI-14 is at 22-25, deeply oversold. Yes, BTC is near the lower Bollinger Band at $60,848. But price is still below ALL major averages: 7-day SMA $64,936, 20-day $72,127, 50-day $78,273, and 200-day $72,703. That is a classic bearish structure. 8a4a
MACD is still negative. Open Interest has fallen to $17.99B, a 13-month low, which means leverage has been flushed out, but new buying has not come in yet.
Key Levels To Watch:
- Immediate Support: $62,284 - $62,000. This is the weekend low. If it breaks, next is $60,728, then $59,380 (YTD low).
- Major Demand Zone: $63,111 - $64,373, where 1.22M BTC last changed hands. If this holds, analysts say there is little resistance until $76,996.
- Immediate Resistance: $65,174 - $65,200. A daily close above this is the first sign of relief.
- Strong Resistance: $66,508 - $68,000 (200-week average). Until BTC reclaims this, every bounce is a corrective bounce, not a reversal.
For ETH: Support $1,730 - $1,700, Resistance $1,815 - $1,880. ETH is slightly stronger than BTC today, but it is still trading well below its EMAs.
What About Altcoins?
BNB is at $586, SOL at $74.5, XRP at $0.98. All are mirroring BTC. With BTC Dominance at 58.1%, altseason is not coming until BTC stabilizes. The strongest sector in the last 24h was AI (+2.68%), the weakest was DeFi (+0.02%). This is selective buying, not a broad rally.
What Could Change The Trend? 3 Scenarios For December
Scenario A - Bearish (Most Likely If Flows Continue): If ETF outflows continue and Dec 9 brings a 25bp hike + hawkish guidance for January, BTC tests $60K, then $58K. This is what Wintermute warned: losing the 200-week average near $68K opens the $50Ks.
Scenario B - Relief Bounce: If PCE inflation (coming in 6 days) comes cooler than expected, and ETF outflows slow, BTC can bounce to $65K - $67K. This would still be a bounce inside a downtrend, not a new bull run.
Scenario C - Bullish Surprise: Fed pauses in December. Probability is very low right now, but if it happens, BTC could reclaim $70K quickly because positioning is so washed out.
My personal bias: Neutral to Cautiously Bearish short-term, Bullish on value long-term. We are in Extreme Fear, which historically is where smart money starts accumulating slowly, but not all at once. The market needs a reason to stop falling, and right now, the Fed is not giving it one.
My Strategy For Retail Traders Right Now:
1. Do not use high leverage. With RSI at 22, a bounce can liquidate shorts, and a breakdown can liquidate longs in the same day.
2. Do not go all-in at $62K. Use DCA. If you believe in BTC long-term, split your buying between $62K, $60K, and $58K.
3. Watch ETF flows, not Twitter hype. One day of $200M+ inflow will matter more than 100 bullish posts.
4. Mark the dates: PCE Inflation in 6 days, FOMC Decision on Dec 9. These two events will decide the rest of 2026.
Conclusion
Bitcoin is not crashing because crypto failed. Bitcoin is falling because the Fed is tightening, the Dollar is strong, institutions are de-risking, and liquidity is thin.
Extreme Fear at 10 tells us panic is at its peak. Oversold RSI tells us a bounce is overdue. But until BTC holds above $65,200 and ETF outflows stop, the trend remains down.
The question is not "Will Bitcoin recover?" History says it always does. The question is: "Can you survive the next 20 days until the Fed meeting without panicking?"
What is your plan? Are you buying this Extreme Fear, waiting for $58K, or sitting in stablecoins until Dec 9?
Drop your plan in the comments.
Not financial advice. DYOR. Always manage your risk.
$BTC $ETH $SOL #Bitcoin #Crypto #FOMC #FederalReserve #Write2Earn