

GOLD just crashed 3.2% in ONE day.
Price is now $3,733. This is the lowest price since September 2025. GOLD is down 33% from its January high of $5,600.
I have attached 3 charts. Read all 3, then tell me your view.
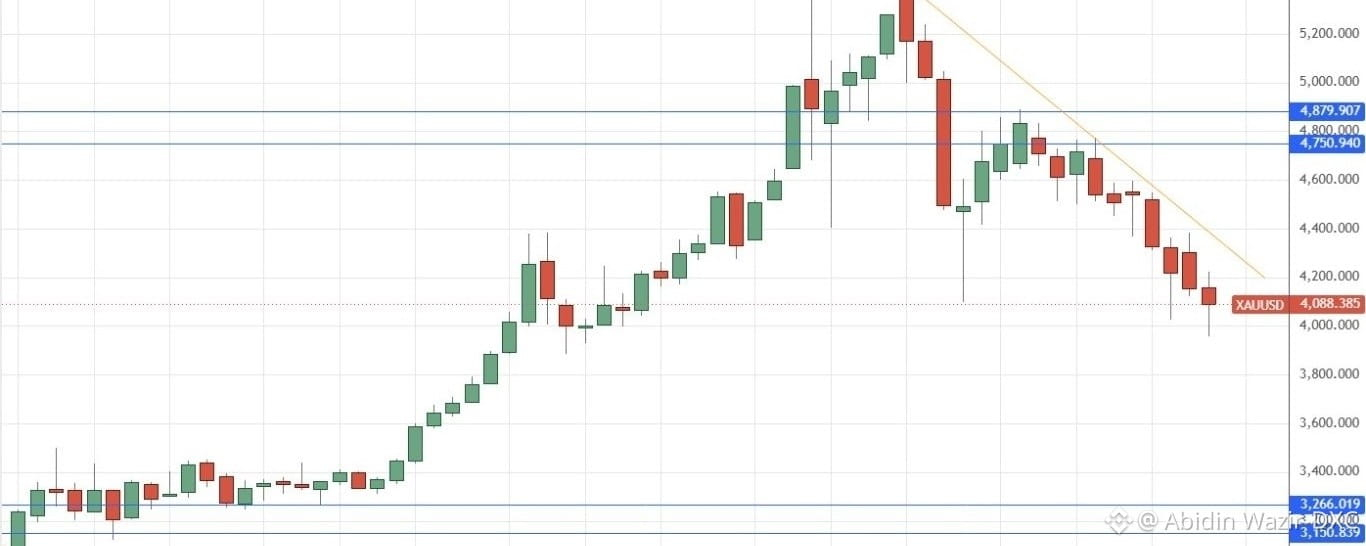
PHOTO 1 - WEEKLY CHART - TRENDLINE BROKEN
On Weekly chart, GOLD broke the trendline that was holding since 2023.
That trendline was at $3,841. Price is now below it at $3,733.
This is the first time in 3 years GOLD closed below this line. This is the main reason sellers are in control.
PHOTO 2 - BREAKDOWN CHART - SUPPORT / RESISTANCE
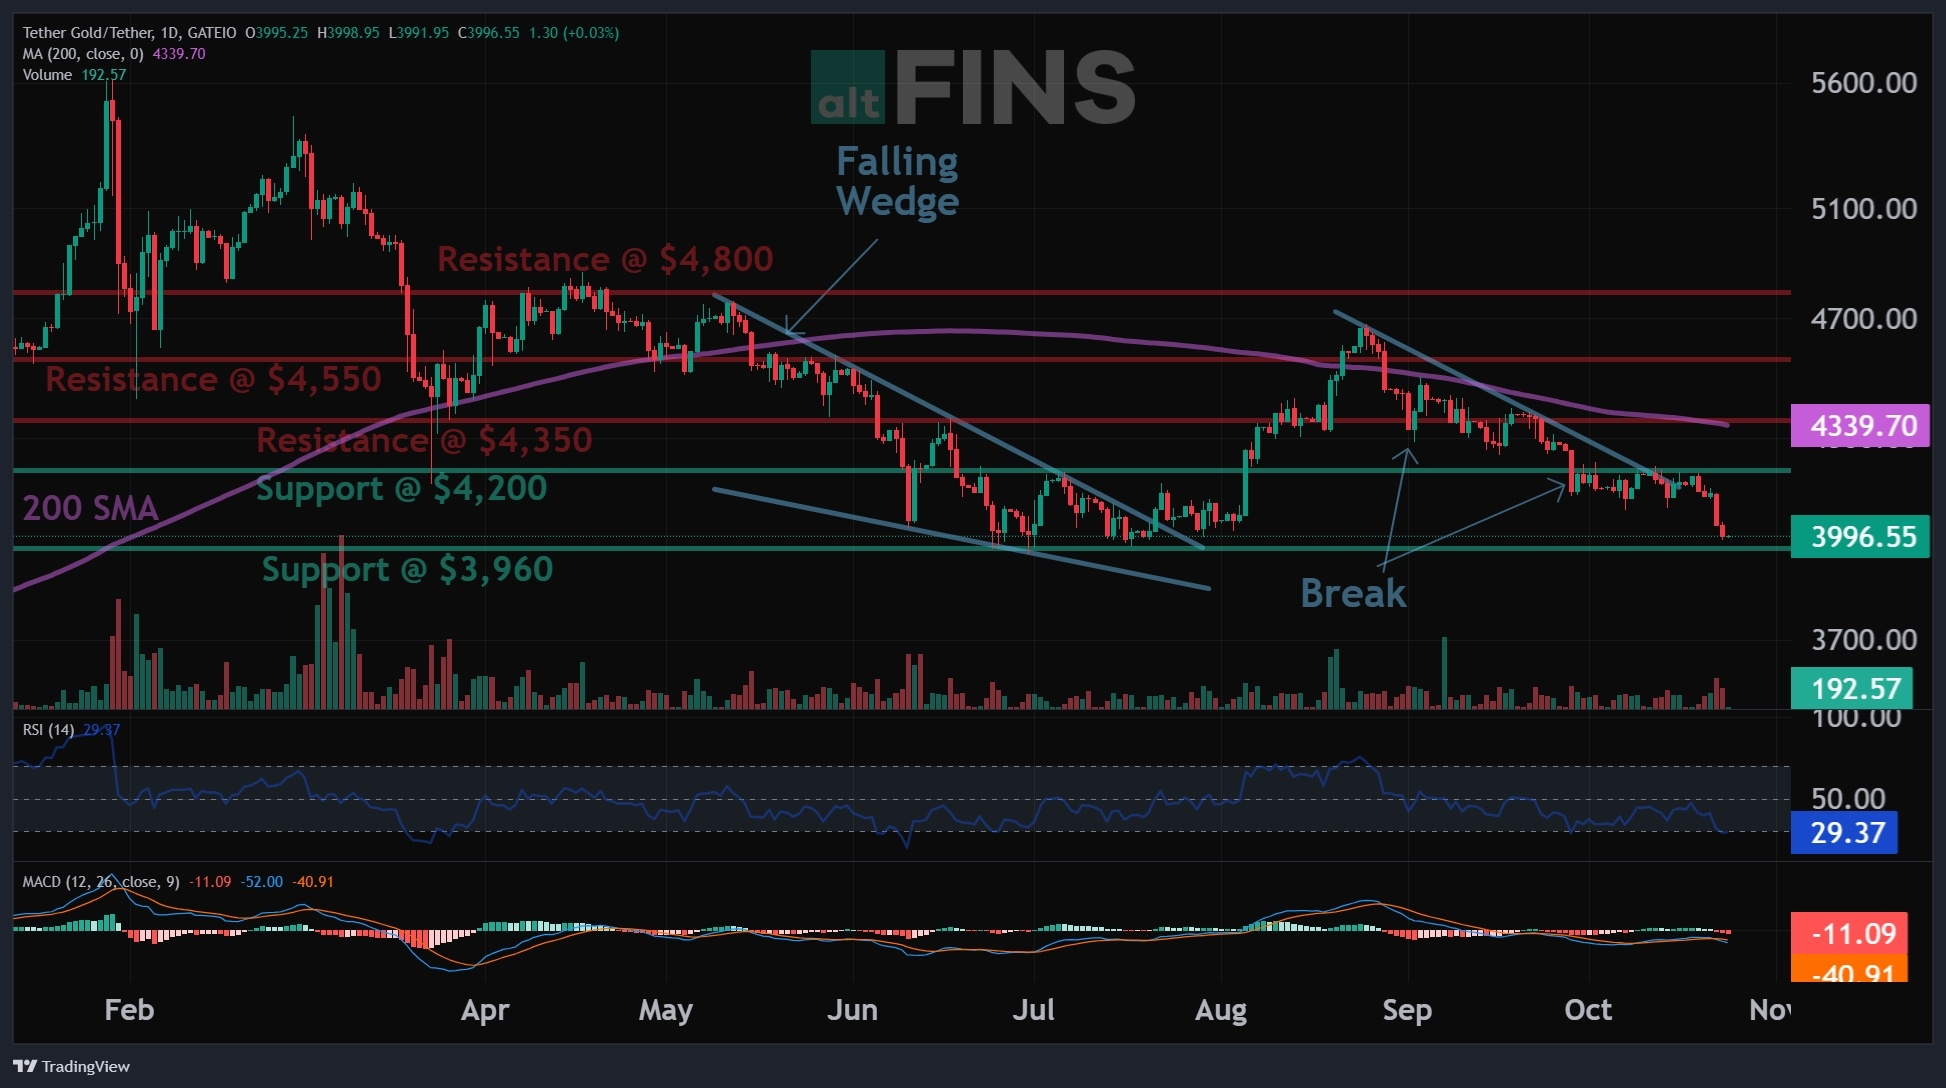
Resistance: $3,800 - $4,000
Support: $3,700 - $3,500
RSI is at 30 - Oversold. That means bounce can come anytime, but trend is still DOWN until price closes back above $3,800.
PHOTO 3 - SUPPLY / DEMAND ZONE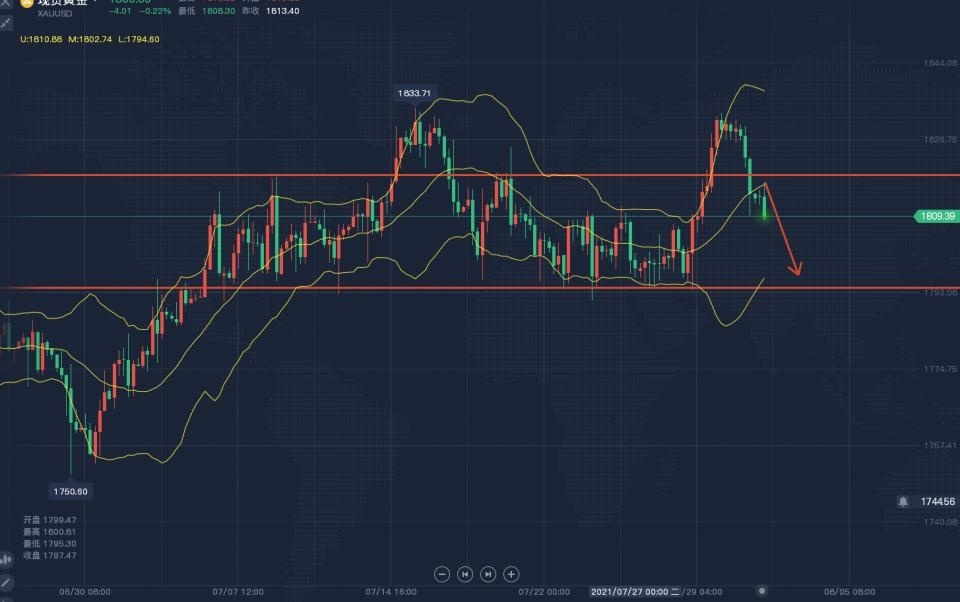
Top Box = Supply Zone $3,800 - $4,000. Sellers are sitting here.
Bottom Box = Demand Zone $3,700 - $3,500. Buyers are waiting here.
Price is stuck between these two boxes.
WHY DID GOLD CRASH?
One reason: FED.
FOMC Minutes showed almost all FED officials want MORE rate hikes. FED Governor Waller said consider 50bps hike in December.
Market is now pricing 92% chance of December hike.
Dollar is at 19-month high. 10-Year Yield is at 5.1%.
THE BIG FIGHT - FED vs CENTRAL BANKS
FED is selling pressure. CENTRAL BANKS are buying.
Central Banks bought 321 Tonne in Q3. They are buying 60 Tonne every month.
Retail is panicking and selling. Smart money is quietly buying.
WHAT TO DO NOW?
Wait for Weekly Close on Sunday.
If price stays ABOVE $3,700 on Sunday Close - Bounce to $3,800 - $4,000 is possible.
If price closes BELOW $3,650 on Sunday Close - Drop to $3,500 is possible.
Middle of $3,700 is danger zone. No trade here is also a trade.
Are you PANIC SELLING or BUYING THE DIP?
Comment CRASH or DIP below.
This is educational information based on public news and chart. Not financial advice. Always do your own research.
Follow for daily GOLD crash updates.
#GOLD #XAUUSD #GoldCrash #Fed #BinanceSquare #AbidinDXC