
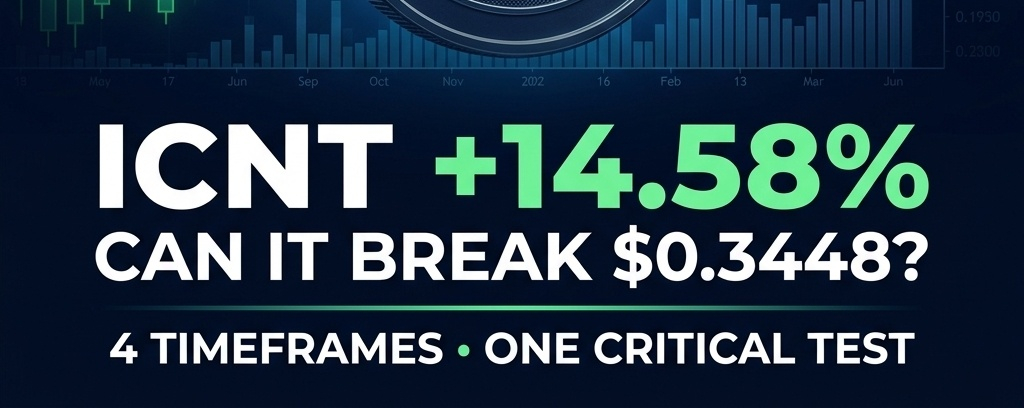

Impossible Cloud Network (ICNT) is attracting attention after climbing 14.58% in the latest Binance Futures snapshot.
Trading around $0.3237, ICNT is approaching an important resistance area. But here's the interesting part: its daily and 4-hour structures look constructive, while lower-timeframe volume is still lagging.
Is this the beginning of another upward move, or could the rally face a pause?
Let's examine all four timeframes.
📊 15-Minute Chart: Immediate Resistance Ahead
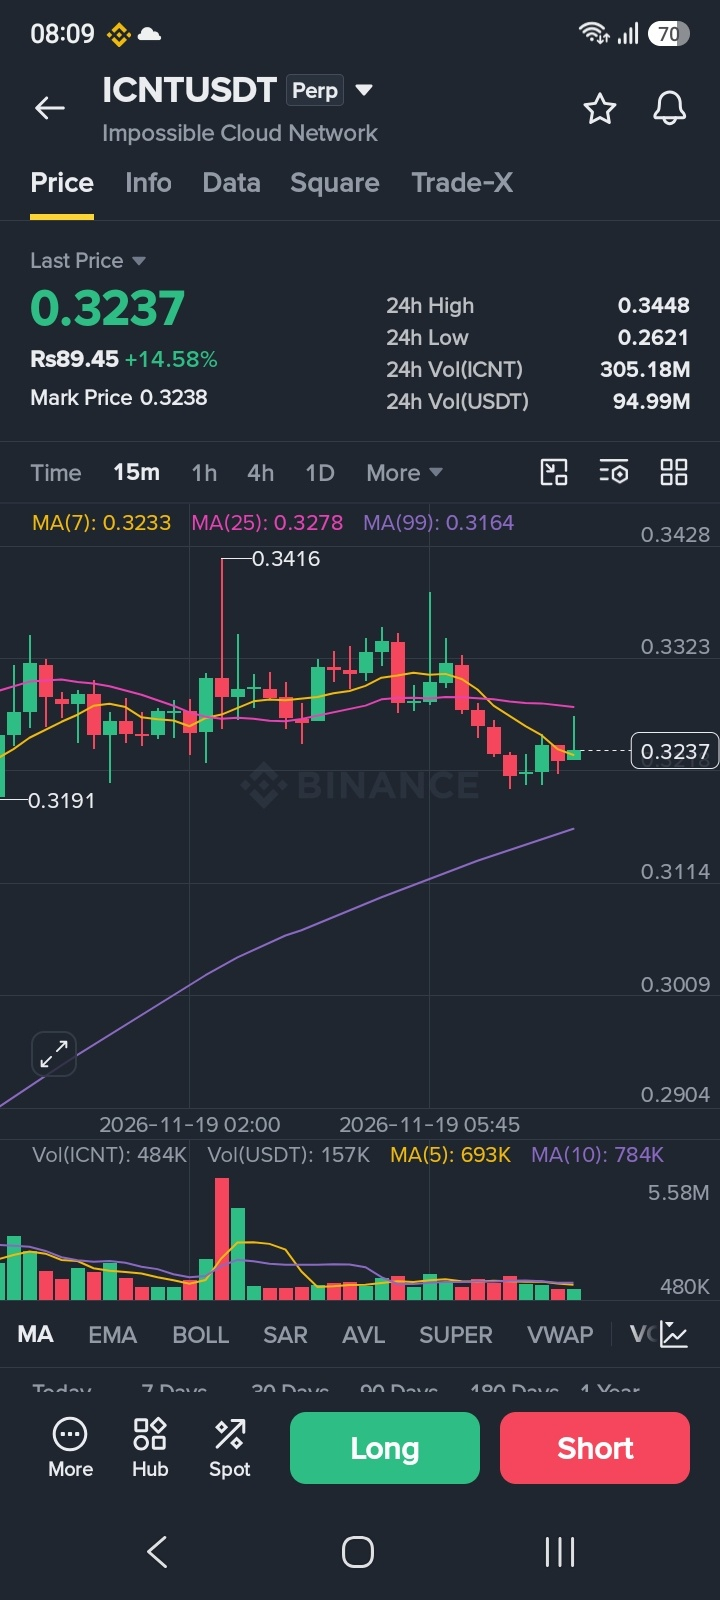
MA(7): $0.3233
MA(25): $0.3278
MA(99): $0.3164
Candle Volume: 484K ICNT
Volume MA(5): 693K
Volume MA(10): 784K
ICNT is slightly above MA(7) and MA(99), but remains below MA(25). The $0.3278 area is the immediate resistance to watch.
Volume remains below both averages, suggesting that short-term buying momentum needs further confirmation.
📊 1-Hour Chart: Recovery Structure Under Observation
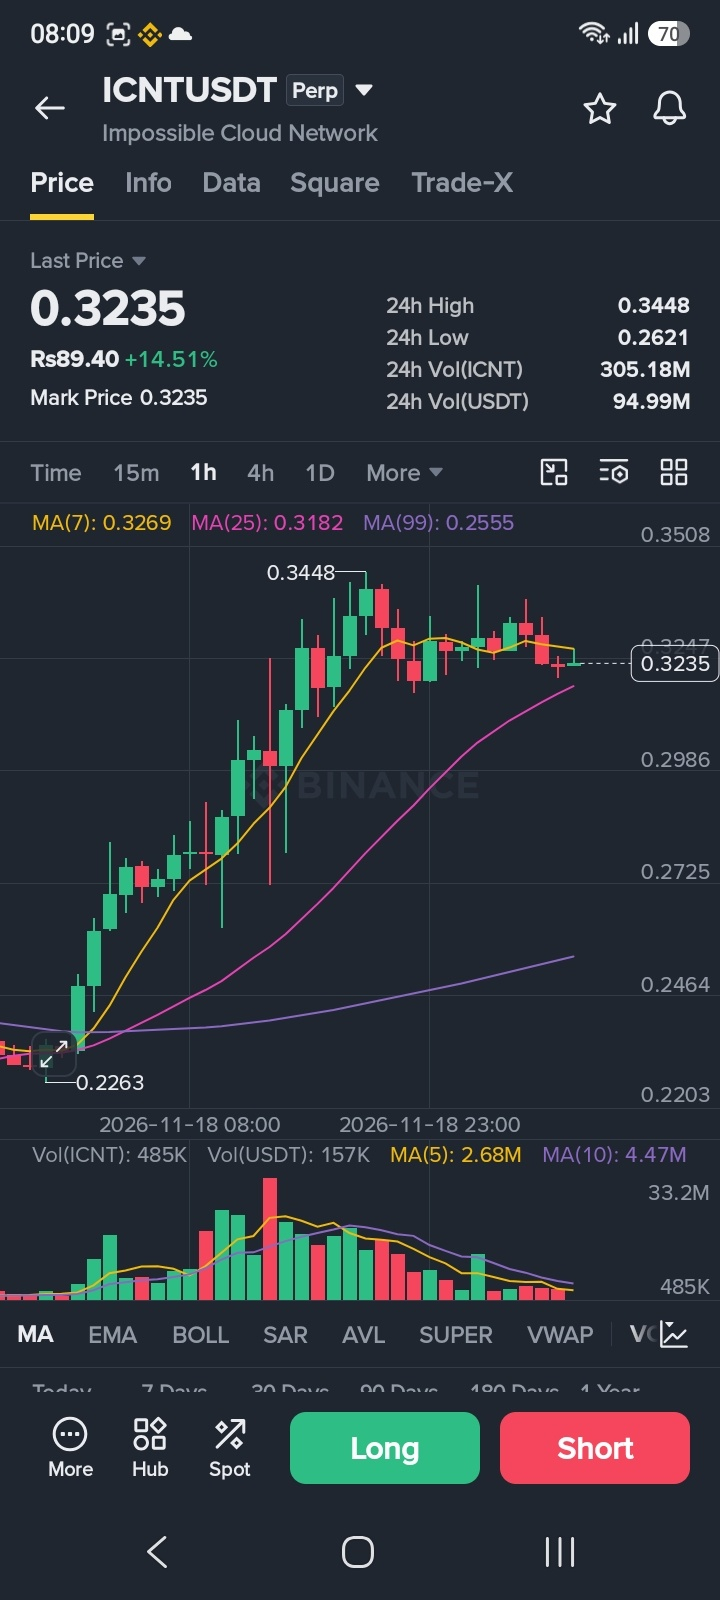
MA(7): $0.3269
MA(25): $0.3182
MA(99): $0.2555
Candle Volume: 485K ICNT
Volume MA(5): 2.68M
Volume MA(10): 4.47M
Price is below MA(7), but remains above MA(25) and MA(99).
This indicates a short-term pause within a broader recovery structure. However, the relatively low candle volume makes confirmation important.
📊 4-Hour Chart: Buyers Still Have a Structural Advantage
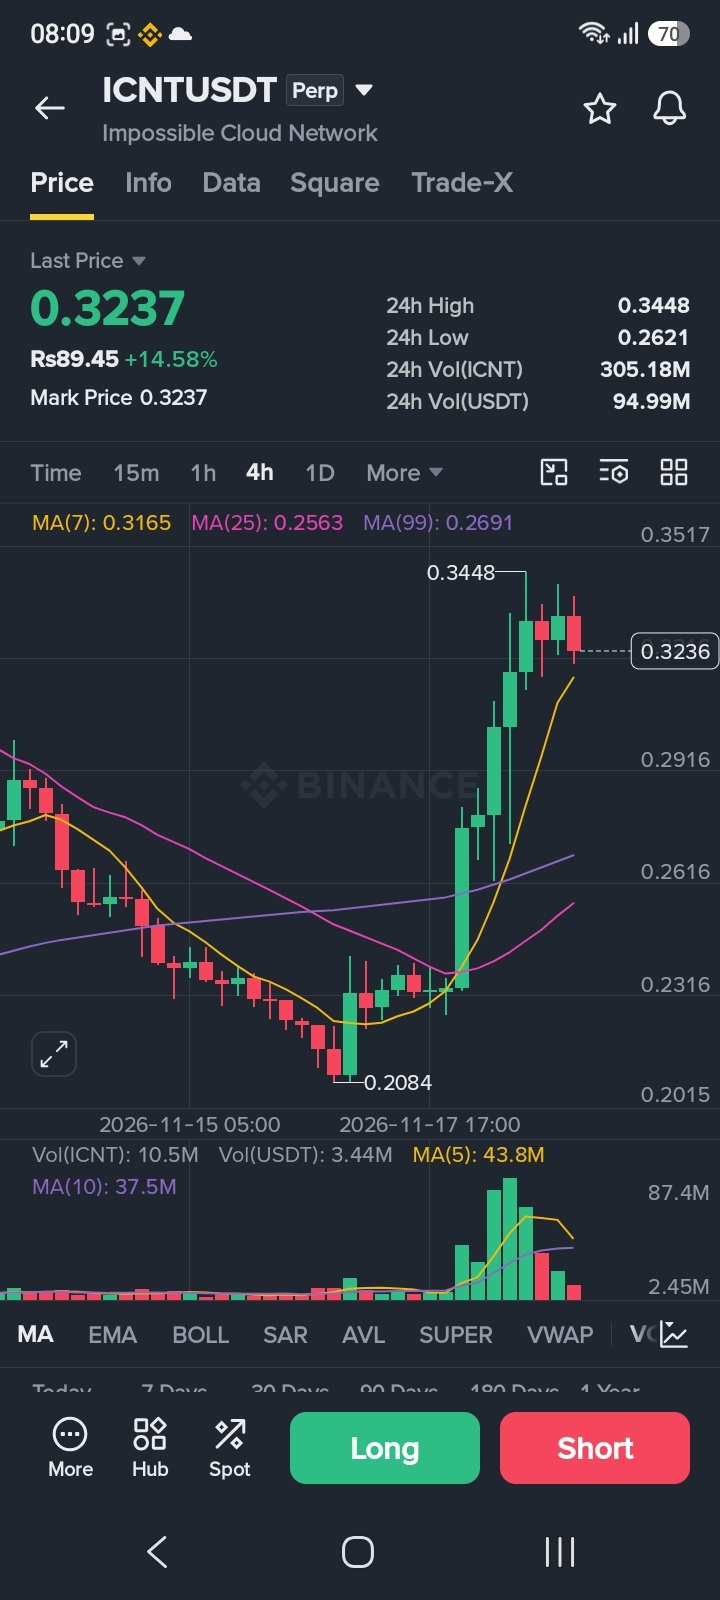
MA(7): $0.3165
MA(25): $0.2563
MA(99): $0.2691
Candle Volume: 10.5M ICNT
Volume MA(5): 43.8M
Volume MA(10): 37.5M
Price is above all three moving averages, which supports the positive 4-hour structure.
However, current candle volume is significantly below both volume averages. A stronger volume expansion would help validate another upward move.
📊 Daily Chart: The Bigger Trend Remains Constructive
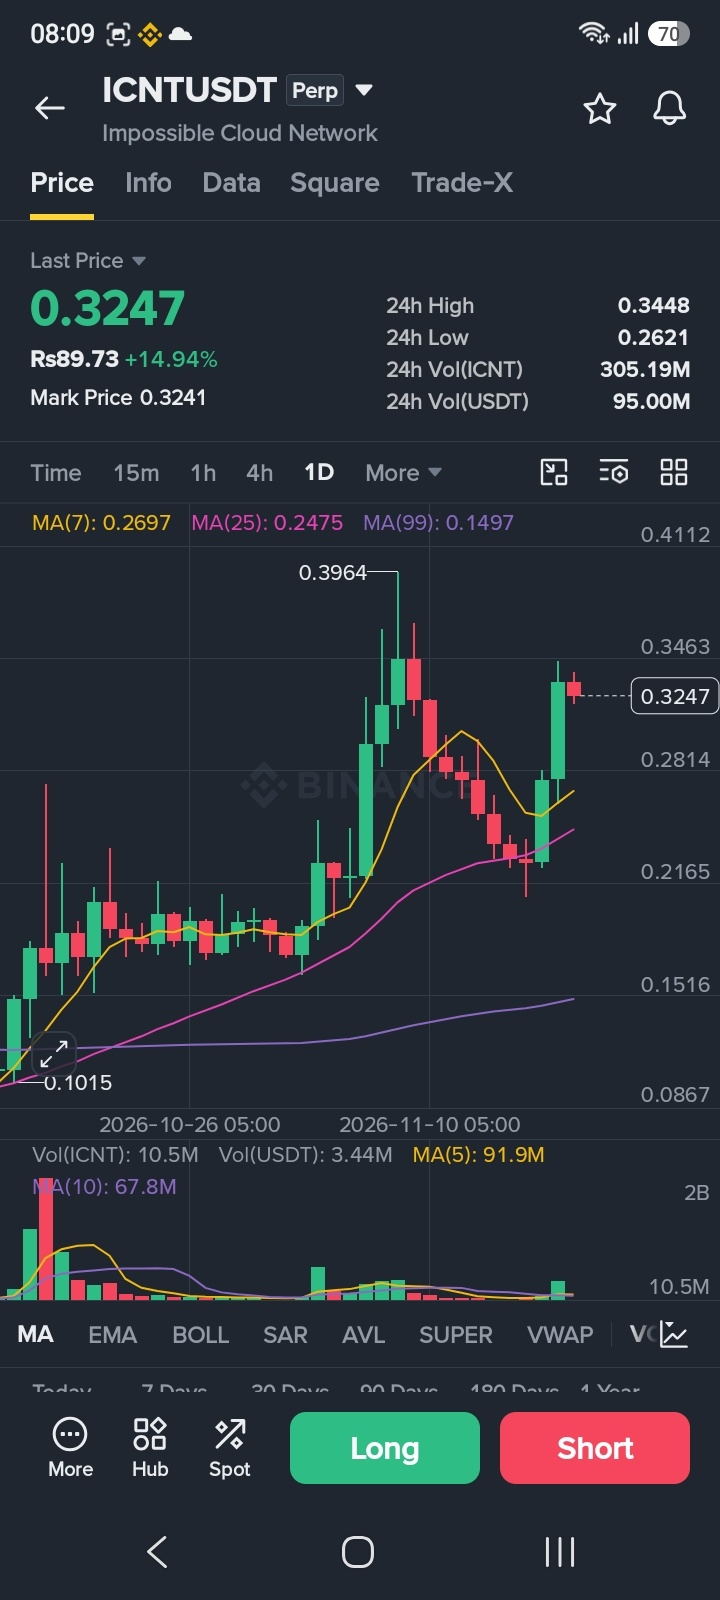
MA(7): $0.2697
MA(25): $0.2475
MA(99): $0.1497
Candle Volume: 10.5M ICNT
Volume MA(5): 91.9M
Volume MA(10): 67.8M
ICNT is trading above all three daily moving averages. This reflects a strong broader recovery structure.
Still, daily volume in the supplied snapshot is below both averages, so the rally should not be treated as a confirmed breakout.
🎯 Critical Support & Resistance Levels
Resistance zones:
$0.3278 — Immediate 15-minute MA(25)
$0.3448 — 24-hour high
$0.3508–$0.3517 — Higher chart resistance area
Support zones:
$0.3233 — 15-minute MA(7)
$0.3182 — 1-hour MA(25)
$0.3164 — 15-minute MA(99)
$0.2691–$0.2563 — Deeper 4-hour support area
🔍 What Could Happen Next?
Bullish scenario: A sustained move above $0.3278, followed by a break of $0.3448 with stronger volume, could bring the $0.3508–$0.3517 area into focus.
Bearish scenario: If ICNT loses the $0.3164–$0.3182 support area, the short-term recovery could weaken and lower support levels may become relevant.
Current outlook: The 4-hour and daily structures remain positive, but lower-timeframe resistance and weak volume deserve attention. Confirmation matters more than chasing the recent 14.58% rally.
💬 Your Take?
Can ICNT break $0.3448 and challenge $0.35, or will sellers defend the resistance zone?
Are you watching ICNT for a continuation move or a possible pullback?
Share your analysis below!
Disclaimer: This analysis is based on the Binance chart screenshots provided on November 19, 2026. It is for educational purposes only and is not financial advice. Always conduct your own research and manage risk.
#ICNT #ImpossibleCloudNetwork #CryptoAnalysis #TechnicalAnalysis #Altcoins #BinanceSquare #BinancePick