

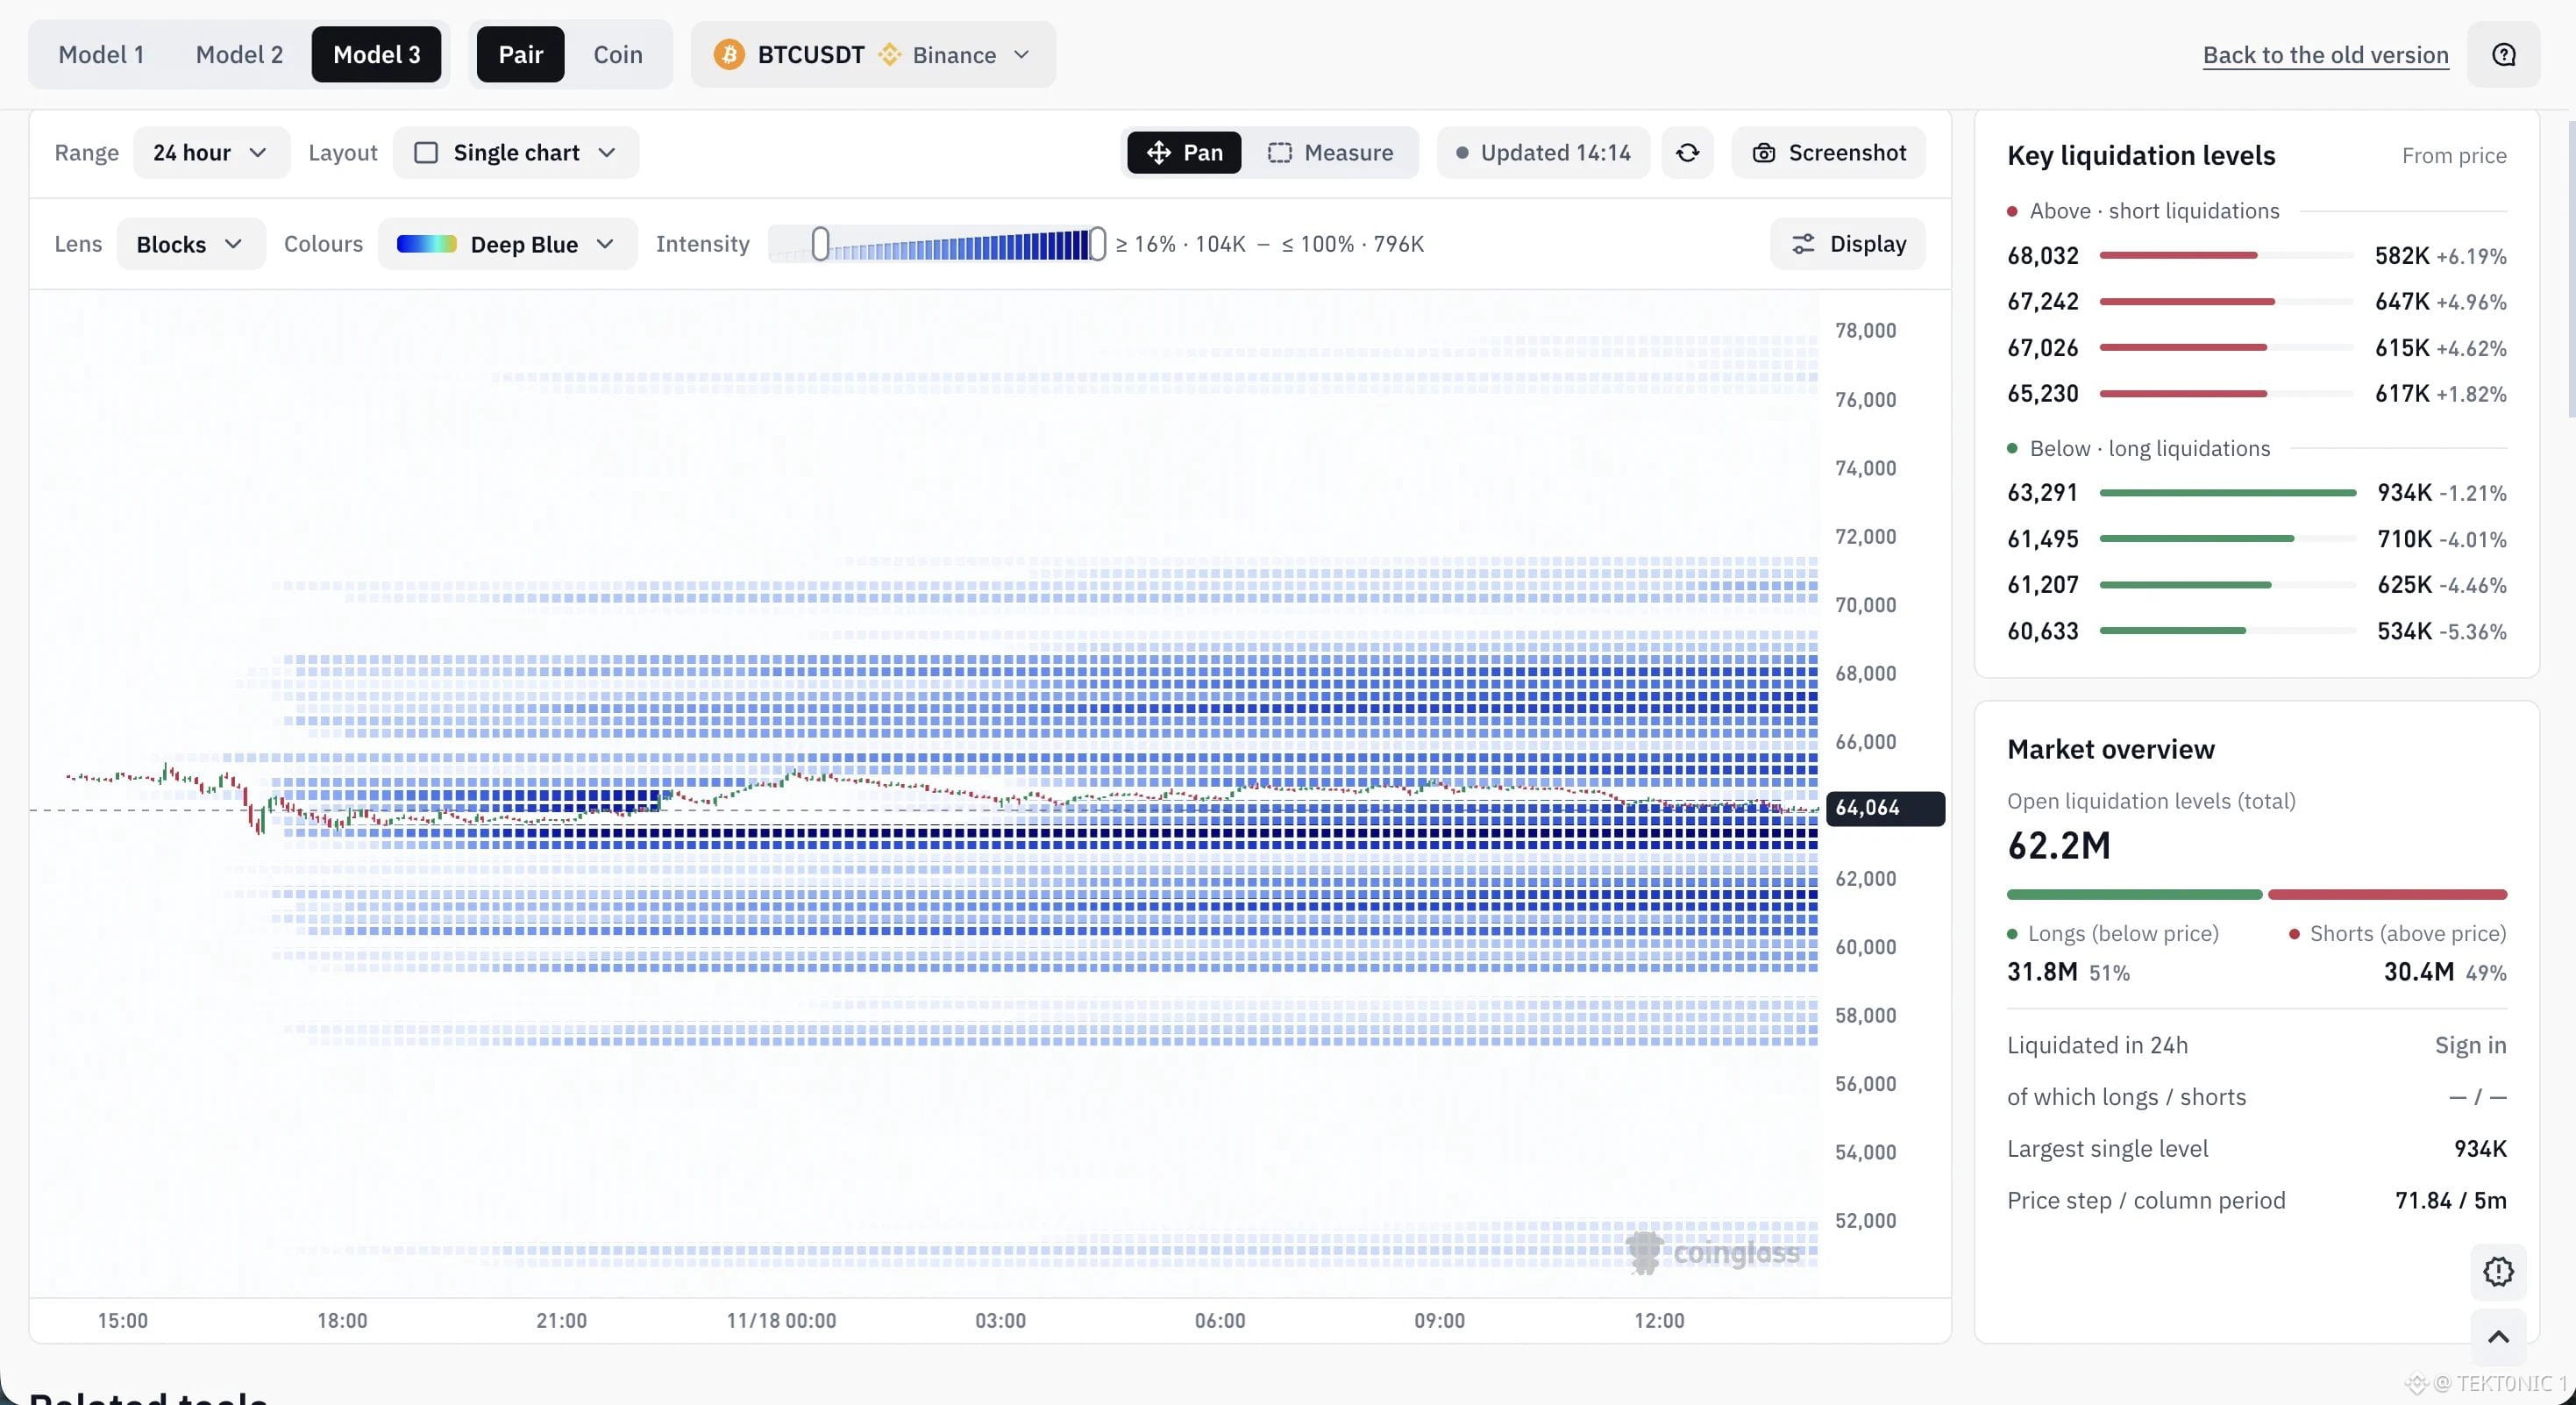
coinglass has launched its new liquidation heatmap, giving traders a clearer view of where leveraged positions could face forced closures. 👀 the tool maps estimated liquidation levels across different price ranges, using colour intensity to show where liquidation liquidity is concentrated. darker areas indicate larger estimated concentrations. in the $BTC USDT 24-hour view shown here, bitcoin is trading around $64,064. the largest visible liquidation cluster below price sits at $63,291, with approximately $934k in estimated long liquidations. above the current price, notable short liquidation levels appear around $65,230, $67,026 and $68,032. these zones show where rising prices could put leveraged short positions under pressure. the heatmap also separates potential long liquidations below the market from short liquidations above it. this helps traders identify areas where a price move could trigger forced position closures and potentially increase volatility. one important distinction: these levels are estimates, not guaranteed liquidation events or exact predictions of where price will move. actual liquidations depend on exchange positions, leverage, margin and changing market conditions. the value is in seeing where leveraged exposure is concentrated, rather than treating every highlighted zone as a price target. source: coinglass liquidation heatmap #BTC Price Analysis# #Bitcoin Price Prediction: What is Bitcoins next move?# $BTC $SOL
انضم إلى مُستخدمي العملات الرقمية حول العالم على Binance Square
⚡️ احصل على أحدث المعلومات المفيدة عن العملات الرقمية.
💬 موثوقة من قبل أكبر منصّة لتداول العملات الرقمية في العالم.
👍 اكتشف الرؤى الحقيقية من صنّاع المُحتوى الموثوقين.
البريد الإلكتروني / رقم الهاتف