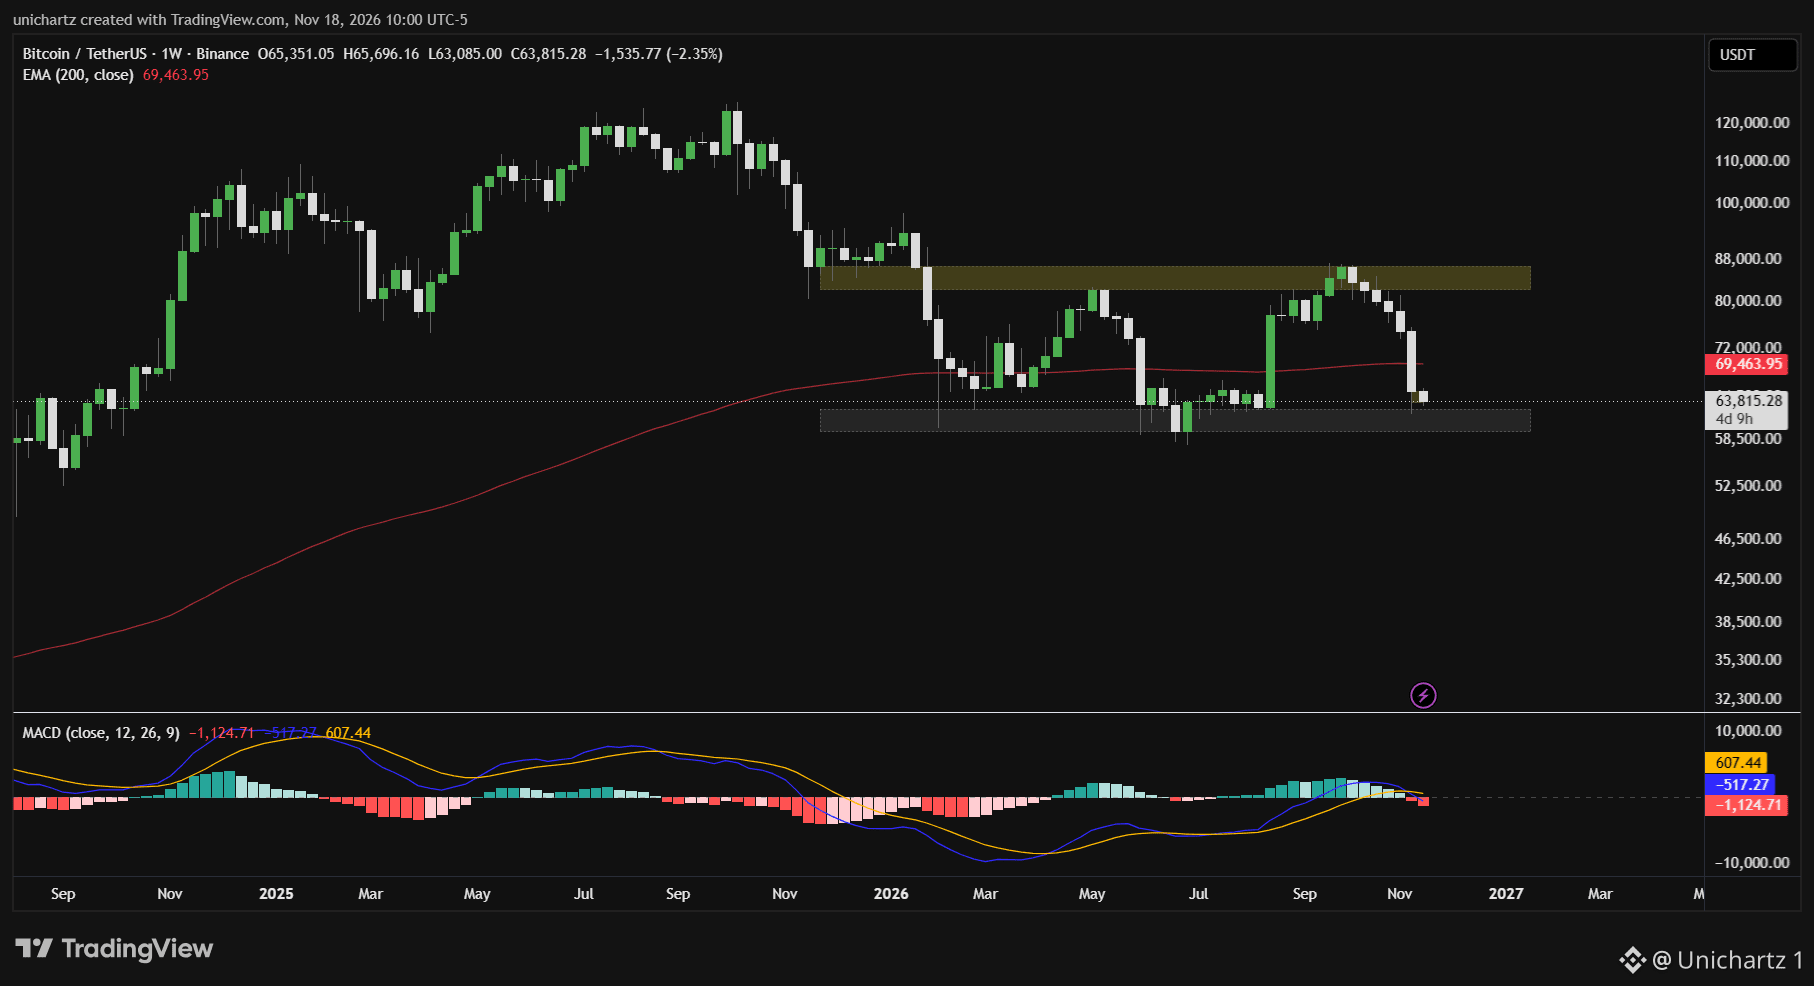
$BTC Weekly: $63,800 and This Chart Is Making Me Nervous.
Let's be real, this chart isn't looking great.
Bitcoin got shot down from the $82K-$88K range, dropped below its 200 EMA (around $69.4K), and is now hovering right on the $58.5K-$62K support zone. That EMA used to be solid support. Now it's acting as resistance overhead.
Here's what's concerning me:
📉 We're seeing lower highs. Every rally this year has topped out below the previous one.
📉 The MACD just crossed bearish, and the histogram is red. That tells me momentum is weakening, not strengthening.
📉 This support zone has been hit three times since February. Each time we retest a level, it gets weaker because the buyers who stepped in before might be tapped out.
Key Levels:
Support: $58.5K to $62K, then the $54K area.
Resistance: $69.4K (the 200 EMA), then $82K to $88K.
What would make me change my tune? A weekly close back above the 200 EMA with momentum picking back up. Until then, these bounces look more like selling opportunities than signs of a bottom.
My view: The overall structure is leaning bearish. If we close the week below $58.5K, it breaks a range that's held all year, and $54K becomes the next target. We still have four days left in the week, so that weekly close is pretty much everything.
I'll be updating this chart live as things unfold. Follow us to catch the important levels.
This isn't financial advice. Always manage your risk. #BTC Price Analysis# #BTC #Altcoin Season# #BNBChain# $ETH
Let's be real, this chart isn't looking great.
Bitcoin got shot down from the $82K-$88K range, dropped below its 200 EMA (around $69.4K), and is now hovering right on the $58.5K-$62K support zone. That EMA used to be solid support. Now it's acting as resistance overhead.
Here's what's concerning me:
📉 We're seeing lower highs. Every rally this year has topped out below the previous one.
📉 The MACD just crossed bearish, and the histogram is red. That tells me momentum is weakening, not strengthening.
📉 This support zone has been hit three times since February. Each time we retest a level, it gets weaker because the buyers who stepped in before might be tapped out.
Key Levels:
Support: $58.5K to $62K, then the $54K area.
Resistance: $69.4K (the 200 EMA), then $82K to $88K.
What would make me change my tune? A weekly close back above the 200 EMA with momentum picking back up. Until then, these bounces look more like selling opportunities than signs of a bottom.
My view: The overall structure is leaning bearish. If we close the week below $58.5K, it breaks a range that's held all year, and $54K becomes the next target. We still have four days left in the week, so that weekly close is pretty much everything.
I'll be updating this chart live as things unfold. Follow us to catch the important levels.
This isn't financial advice. Always manage your risk. #BTC Price Analysis# #BTC #Altcoin Season# #BNBChain# $ETH