🚨 ETHEREUM (ETH/USDT) – A Critical Market Zone to Watch!
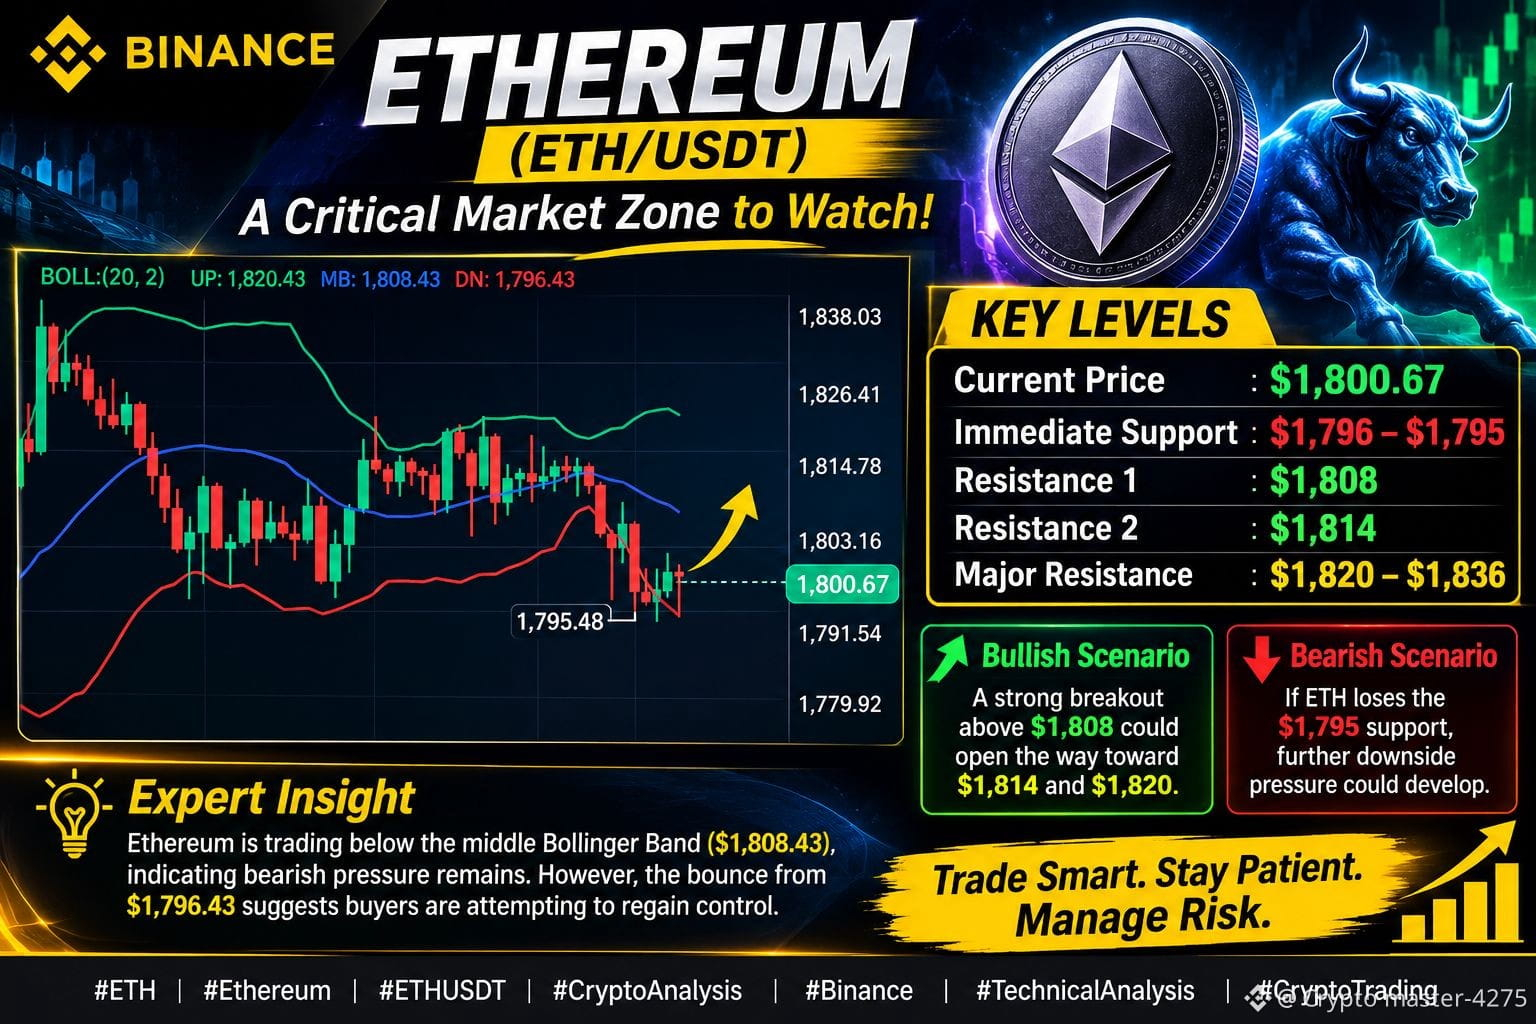
Ethereum is currently trading around $1,800.67, showing signs of short-term recovery after testing the $1,795.48 support zone.
📊 Technical Market Analysis (15-Minute Chart)
- Current Price: $1,800.67
- Immediate Support: $1,796 – $1,795
- Resistance 1: $1,808
- Resistance 2: $1,814
- Major Resistance: $1,820 – $1,836
Bollinger Bands Analysis:
ETH is trading below the middle Bollinger Band ($1,808.43), indicating that short-term bearish pressure remains. However, the recent bounce from the lower band ($1,796.43) suggests buyers are attempting to regain control.
Bullish Scenario 📈
A strong breakout above $1,808 could open the way toward $1,814 and potentially $1,820.
Bearish Scenario 📉
If ETH loses the $1,795 support, further downside pressure could develop.
🔥 My Market Perspective:
Ethereum is approaching an important decision zone. Traders should watch confirmation rather than chase sudden price movements. A decisive breakout or breakdown could define the next short-term direction.
Trade Smart. Stay Patient. Manage Risk.
#ETH #Ethereum #ETHUSDT #CryptoAnalysis #Binance #TechnicalAnalysis #CryptoTrading $BTC $BNB $ETH
Ethereum is currently trading around $1,800.67, showing signs of short-term recovery after testing the $1,795.48 support zone.
📊 Technical Market Analysis (15-Minute Chart)
- Current Price: $1,800.67
- Immediate Support: $1,796 – $1,795
- Resistance 1: $1,808
- Resistance 2: $1,814
- Major Resistance: $1,820 – $1,836
Bollinger Bands Analysis:
ETH is trading below the middle Bollinger Band ($1,808.43), indicating that short-term bearish pressure remains. However, the recent bounce from the lower band ($1,796.43) suggests buyers are attempting to regain control.
Bullish Scenario 📈
A strong breakout above $1,808 could open the way toward $1,814 and potentially $1,820.
Bearish Scenario 📉
If ETH loses the $1,795 support, further downside pressure could develop.
🔥 My Market Perspective:
Ethereum is approaching an important decision zone. Traders should watch confirmation rather than chase sudden price movements. A decisive breakout or breakdown could define the next short-term direction.
Trade Smart. Stay Patient. Manage Risk.
#ETH #Ethereum #ETHUSDT #CryptoAnalysis #Binance #TechnicalAnalysis #CryptoTrading $BTC $BNB $ETH