

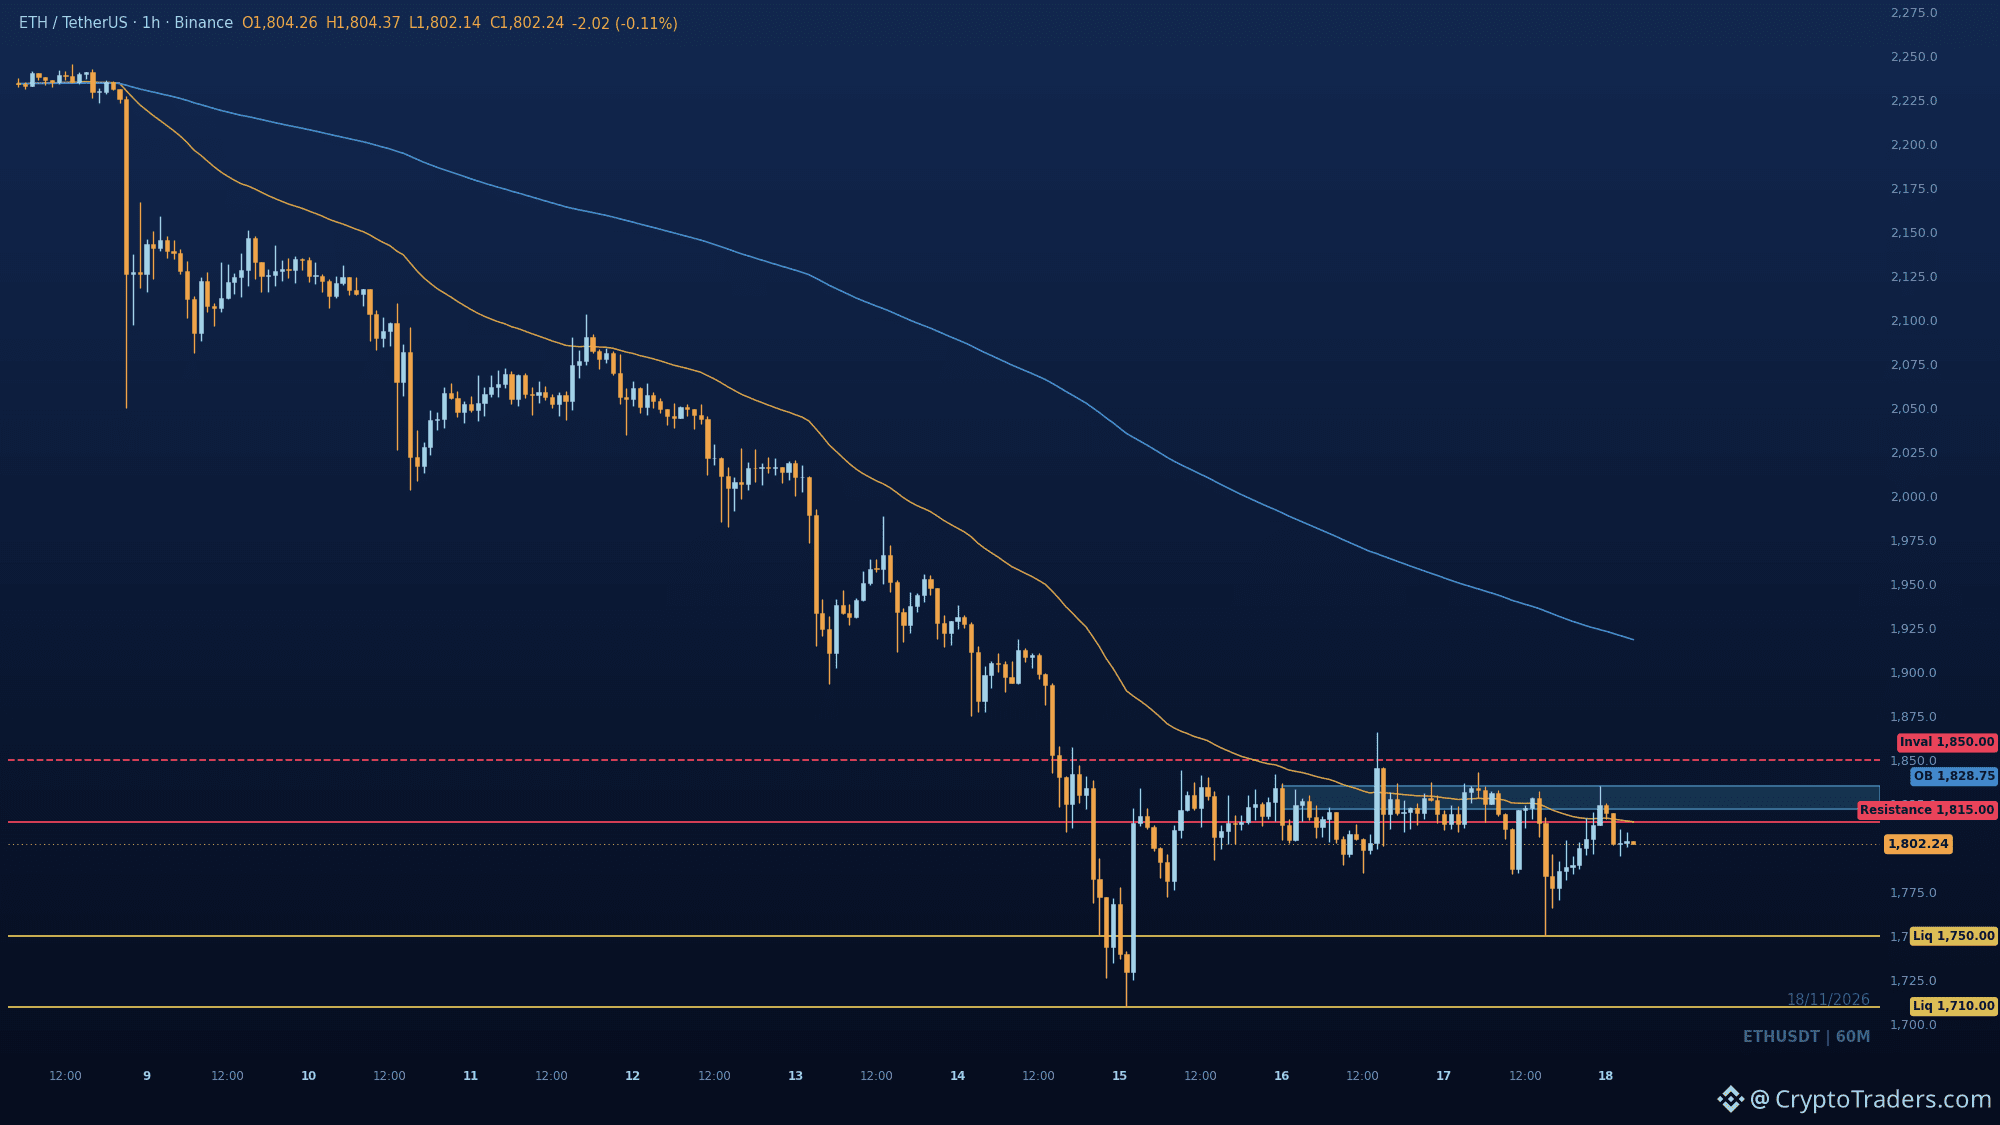
1,815. That is the number $ETH has already failed at twice this window, and it is where the 50 EMA sits right now. The chart shows stair-step distribution from 2,245 down to a 1,710 sweep, and the bounce since has been corrective at best. Every push into 1,815-1,835 has met offers, with the bearish order block at 1,822-1,835.5 marking the last up candle before each drop. Below, 1,750 sell-side is the obvious draw, with 1,710 the deeper window low. A close above 1,850 flips this read. Until then the base looks like reloading, not reversing. How many times do you let 1,815 reject before you stop trusting the bounce? More charts like this land in the group daily, my bio has the way in. #Altcoin Season#
انضم إلى مُستخدمي العملات الرقمية حول العالم على Binance Square
⚡️ احصل على أحدث المعلومات المفيدة عن العملات الرقمية.
💬 موثوقة من قبل أكبر منصّة لتداول العملات الرقمية في العالم.
👍 اكتشف الرؤى الحقيقية من صنّاع المُحتوى الموثوقين.
البريد الإلكتروني / رقم الهاتف