$BTC
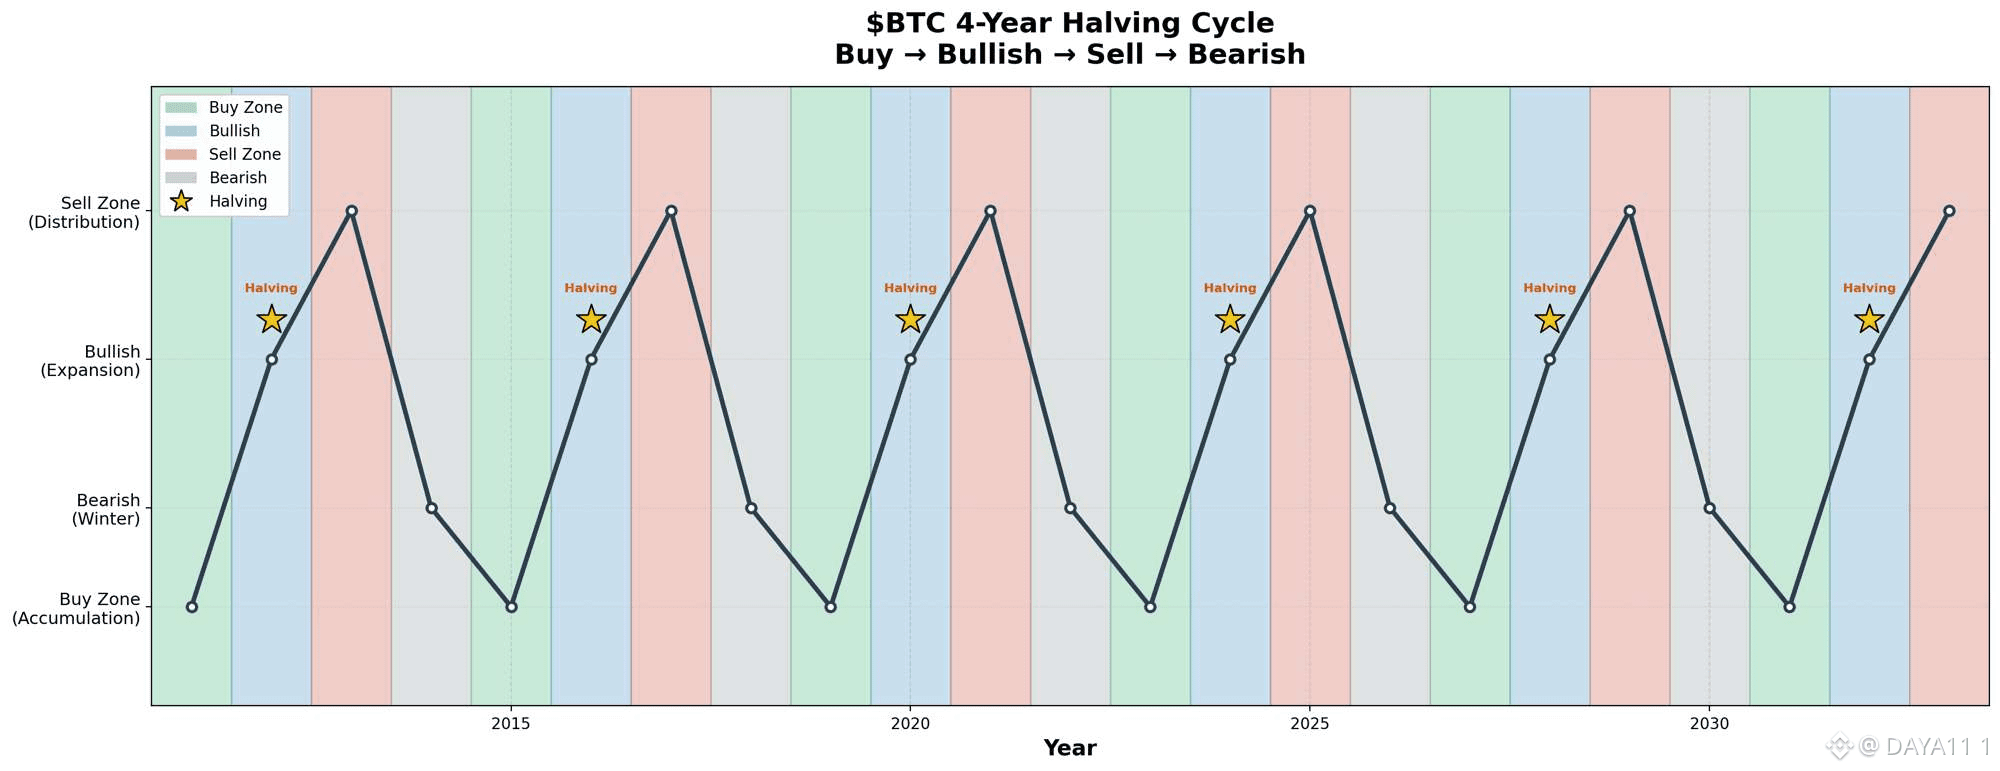
Here $BTC 4-Year Halving Cycle chart based on the zones you provided:
✅Buy Zone (green): 2011, 2015, 2019, 2023, 2027, 2031
🚀Bullish (blue): 2012, 2016, 2020, 2024, 2028, 2032
🤑Sell Zone (red): 2013, 2017, 2021, 2025, 2029, 2033
🔴Bearish (gray): 2014, 2018, 2022, 2026, 2030
Gold stars mark the approximate halving years.
#NFA #DYOR
Here $BTC 4-Year Halving Cycle chart based on the zones you provided:
✅Buy Zone (green): 2011, 2015, 2019, 2023, 2027, 2031
🚀Bullish (blue): 2012, 2016, 2020, 2024, 2028, 2032
🤑Sell Zone (red): 2013, 2017, 2021, 2025, 2029, 2033
🔴Bearish (gray): 2014, 2018, 2022, 2026, 2030
Gold stars mark the approximate halving years.
#NFA #DYOR