

$TRX / USD - Complete Analysis 18 Nov 2026 | Price: ∼$0.3077
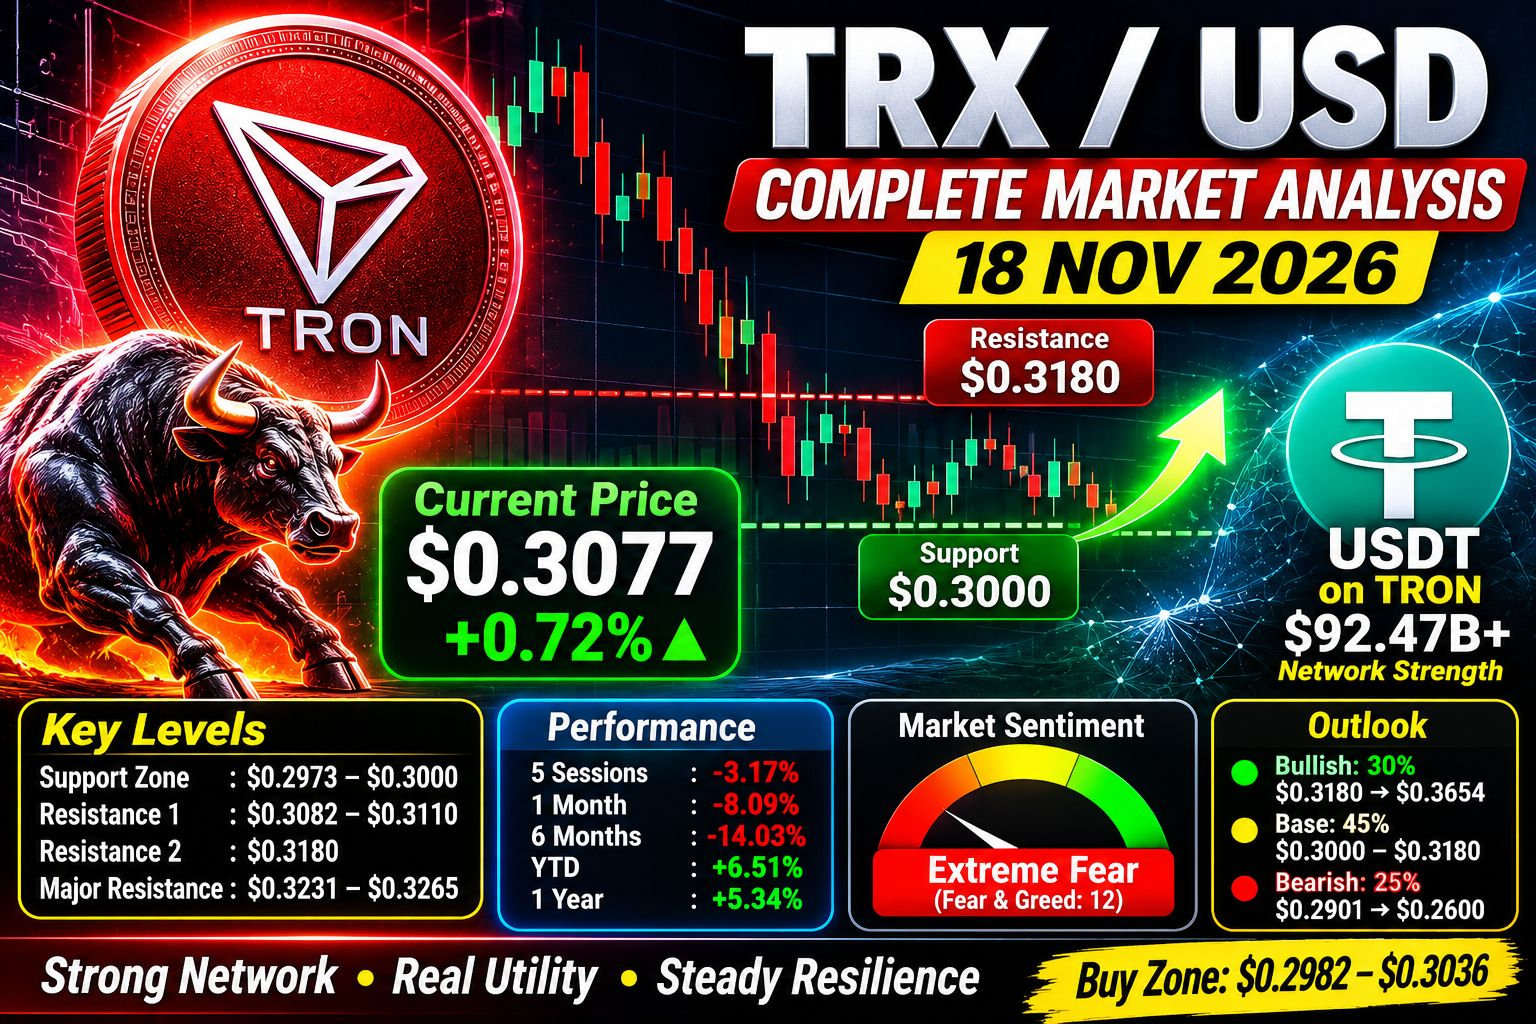
$TRX is the outlier in this market. While XRP is down -48% YTD and most altcoins are crashing, TRX is UP +6.51% YTD and +5.34% in 1 year. It is not rallying, but it is refusing to collapse.
This is a low-volatility, high-utility, bearish-consolidation coin right now. Boring price, incredibly strong network.

This is not financial advice.
1. Live Market Snapshot
| Metric | Value |
| --- | --- |
| Current Price | $0.3077 |
| 24h Range | $0.3048 - $0.3087 |
| 24h Change | +0.72% |
| Market Cap | ~$29.04B - Rank #8 |
| Circulating Supply | 95.04B TRX |
| Total Supply | 95.04B TRX |
| All-Time High | $0.4392 (4 Dec 2024) - now -30.0% below ATH |
Performance - This is the key story:
5 sessions: -3.17%
1 month: -8.09%
6 months: -14.03%
Year-to-date: +6.51%
1 year: +5.34%
Compare: XRP YTD -48%, TRX YTD +6.5%. TRX is holding up because its revenue does not depend on speculation.
Sentiment: Neutral 66%, Fear & Greed 12 - Extreme Fear (market-wide fear, not TRX-specific panic).
2. What Just Happened?
TRX has been in a very tight, boring range for 3 days:
15 Nov: $0.3069 - $0.3096 -> Close $0.3054
16 Nov: $0.3053 - $0.3074 -> Close $0.3052
17 Nov: $0.3052 - $0.3066 -> Close $0.3058
No crash, no pump. Just sideways grinding while the rest of crypto fell. US inflation data on 10 Nov pushed bond yields up and dampened risk appetite, which is keeping all coins capped.
3. Technical Analysis
Trend: Bearish on charts, Bullish on resilience
TRX trades 6.61% below its 200-day EMA at $0.32653, while the 50-day EMA has crossed $0.00197 below the 200-day line, completing a bearish crossover (Death Cross).
On the 4H chart, $TRX remains below both the H4 SMA-50 at $0.3122 and H4 SMA-200 at $0.3231, indicating a bearish medium-term structure even as price attempts to climb.
Technical rating: Strong Bearish on 4H, 1D, and 1W in automated models.
Momentum: Weak, Not Oversold
RSI (1D): 37.5 - 38
MACD: Bearish, histogram below zero
MA: Bearish
RSI 37 means selling pressure, but not oversold like XRP was at 17. TRX is slowly bleeding, not capitulating.
Key Levels
| Type | Level | Why it matters |
| --- | --- | --- |
| Strong Support | $0.2973 - $0.3000 | Major floor, monthly support, buy zone $0.2982 - $0.3036 |
| Support 1 | $0.3033 | Nearest support, S1 strength 89 |
| Support 2 | $0.3015 | 24h support |
| Resistance 1 | $0.3082 - $0.3110 | 4H Kijun + nearest resistance, only 0.9% above |
| Resistance 2 | $0.3092 - $0.3094 | R1 strength 87, 24h resistance |
| Resistance 3 | $0.3180 | Monthly resistance / December target |
| Major Resistance | $0.3231 - $0.3265 | 200 SMA + 200 EMA - must reclaim to flip bullish |
| Breakout Target | $0.3654 | Next major resistance if $0.32 breaks |
Highest-probability scenario: Base case at 45%, with Consolidation near current trend and a target range of $0.296 - $0.327.
24h forecast: Trade within $0.30752 - $0.30804, with 24h target $0.3040, support $0.3015, resistance $0.3094.
4. Fundamental Analysis - Why TRX Is Different
TRON is a Layer 1 blockchain founded in 2017 by Justin Sun. It uses Delegated Proof-of-Stake (DPoS) with 27 Super Representatives.
The #1 Reason TRX Holds Up: USDT
TRON is now the main network for USDT, the largest stablecoin.
USDT on Tron: $92.47B - $94.2B in circulation, 50.7% of all USDT
In Q3 2026, TRON overtook Ethereum for average USDT supply: $90.75B on TRON vs $87.73B on Ethereum
Average native stablecoin supply in Q3: $92.25B, up 4.18% QoQ and 14.58% YoY
In Q3 2026, TRON processed $2.21 Trillion in stablecoin settlement volume
TRON handled about 73% of stablecoin transaction volume in September 2026
Over 7 days in November: 16M+ USDT transfers, ~$177.8B in reported volume
Cumulative transaction value on TRON exceeded $30 Trillion
USDT makes up 98.5% of stablecoins on TRON. That is both its biggest strength and biggest risk.
Other Bullish Fundamentals
1. Real Revenue: In Q3 2026 the network created about 360M TRX and burned a large amount - TRX is deflationary when usage is high because fees burn TRX.
2. First US Spot Staked TRX ETF Launched: In Oct 2026, the first U.S. spot staked TRX ETF debuted, giving institutions regulated exposure + staking yield.
3. Institutional Adoption: Tron Inc., a Nasdaq-listed company backed by Justin Sun, became one of the 27... in Oct 2026, expanding institutional access.
4. Low Fees / Fast: 3-second blocks, bandwidth/energy model instead of high gas fees. Perfect for remittances and P2P payments in Asia, Africa, Latin America.
Bearish / Risk Factors
1. USDT Concentration Risk: If Tether ever has regulatory trouble, TRON is hit hardest.
2. Centralization + Justin Sun Risk: DPoS with 27 validators is more centralized than Bitcoin/Ethereum. Justin Sun is one of crypto's most controversial figures - reputation risk is real.
3. No Hype Narrative: TRX doesn't have meme, AI, or ETF hype like other coins. It grows slowly.
4. US Macro: Strong US inflation data keeps Tron vulnerable as rising funding costs dampen risk appetite.
5. Scenarios - What to Watch
🟢 Bullish Scenario (30% probability)
Trigger: Daily close above $0.3122 (H4 SMA-50), then above $0.3231
Target: $0.3180 -> $0.3265 -> $0.3654
Forecast: TRX could be $0.384 - $0.385 by end of 2026 in historical models, and $0.385 in 2027 in some forecasts.
🟡 Base / Sideways Scenario (45% probability - Most Likely)
Range: $0.3000 - $0.3180
November 2026 target is $0.3060 by end of month, with $0.3000 support and $0.3180 resistance framing the monthly channel. TRX keeps grinding sideways while USDT usage grows.
Projected for 2026: Trade between $0.2950 and $0.3300, with December target $0.3180.
🔴 Bearish Scenario (25% probability)
Trigger: Daily close below $0.2973 / $0.3000 with volume
Target: $0.2901 (stop zone) -> $0.28 -> $0.26
This would break the 2026 base and signal TRX finally joining the broader market sell-off.
6. Long-Term Outlook
| Year | Forecast Range / Target |
| --- | --- |
| Nov 2026 | $0.3000 - $0.3180, target $0.3060 |
| Dec 2026 | $0.3180 target, up to $0.385 in optimistic models |
| 2027 | $0.385 |
| 2030 | $0.510 |
| 2040 | $1.000 |
These are model forecasts, not guarantees. TRX moves slowly - it took 7 years to go from $0.01 to $0.30.
7. Strategy Summary (Not Advice)
For Traders:
TRX is a range-trading coin, not a breakout coin right now
Buy zone: $0.2982 - $0.3036, Stop: $0.2901, First target: $0.3239
Sell / Short zone: Near $0.3110 - $0.3180 if rejected
Do not expect 20% moves - TRX moves 1-2% per day
For Long-Term Holders / Staking:
TRX is one of the few coins where staking + real usage supports price
Its strength is defensive: it falls less in bear markets
Its weakness is offensive: it pumps less in bull markets
| | TRX | XRP |
| --- | --- | --- |
| YTD | +6.51% | -48.33% |
| Use Case | USDT settlement | Cross-border bank payments |
| Volatility | Very Low | Very High |
| Risk | Centralization / USDT | Regulation / ETF flows |
Want me to do:
TRX vs XRP - which is better to buy now head-to-head?
TRX 1H / 4H scalp levels with exact entry / SL / TP?
TRX staking calculator - how much you earn if you stake 10,000 TRX?
#TRX #TRXUpdate #TRX/USDT❤️ #trxanalysis #TradingCommunity