


Injective (INJ) is attracting attention after gaining approximately 3.5% in 24 hours, trading around $7.13.
But there's an interesting detail behind this recovery: the short-term technical structure is still showing signs of weakness.
📊 What the Charts Are Telling Us
15-Minute Chart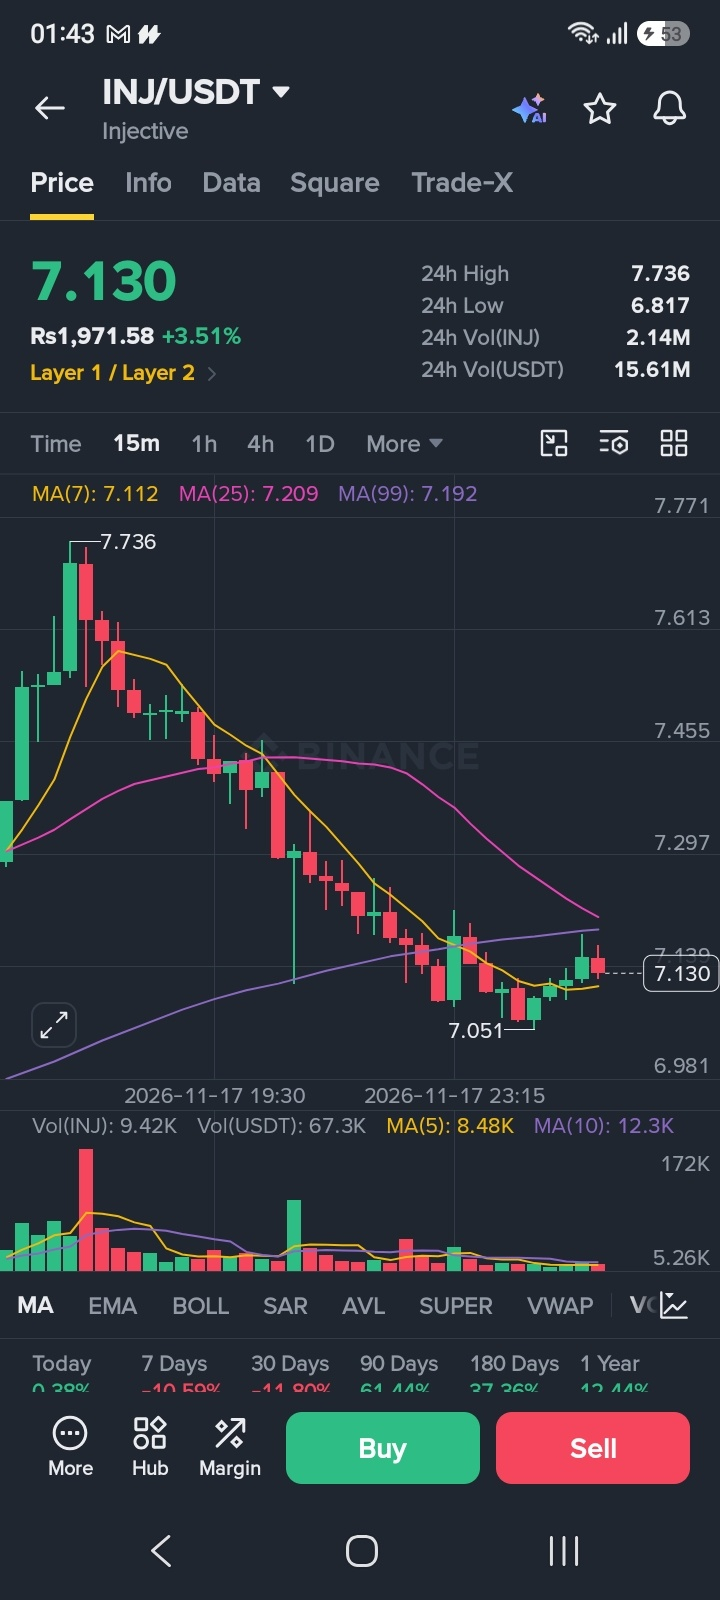
Price: $7.13
MA(7): $7.112
MA(25): $7.209
MA(99): $7.192
INJ is struggling to stay above its longer short-term moving averages.
1-Hour Chart
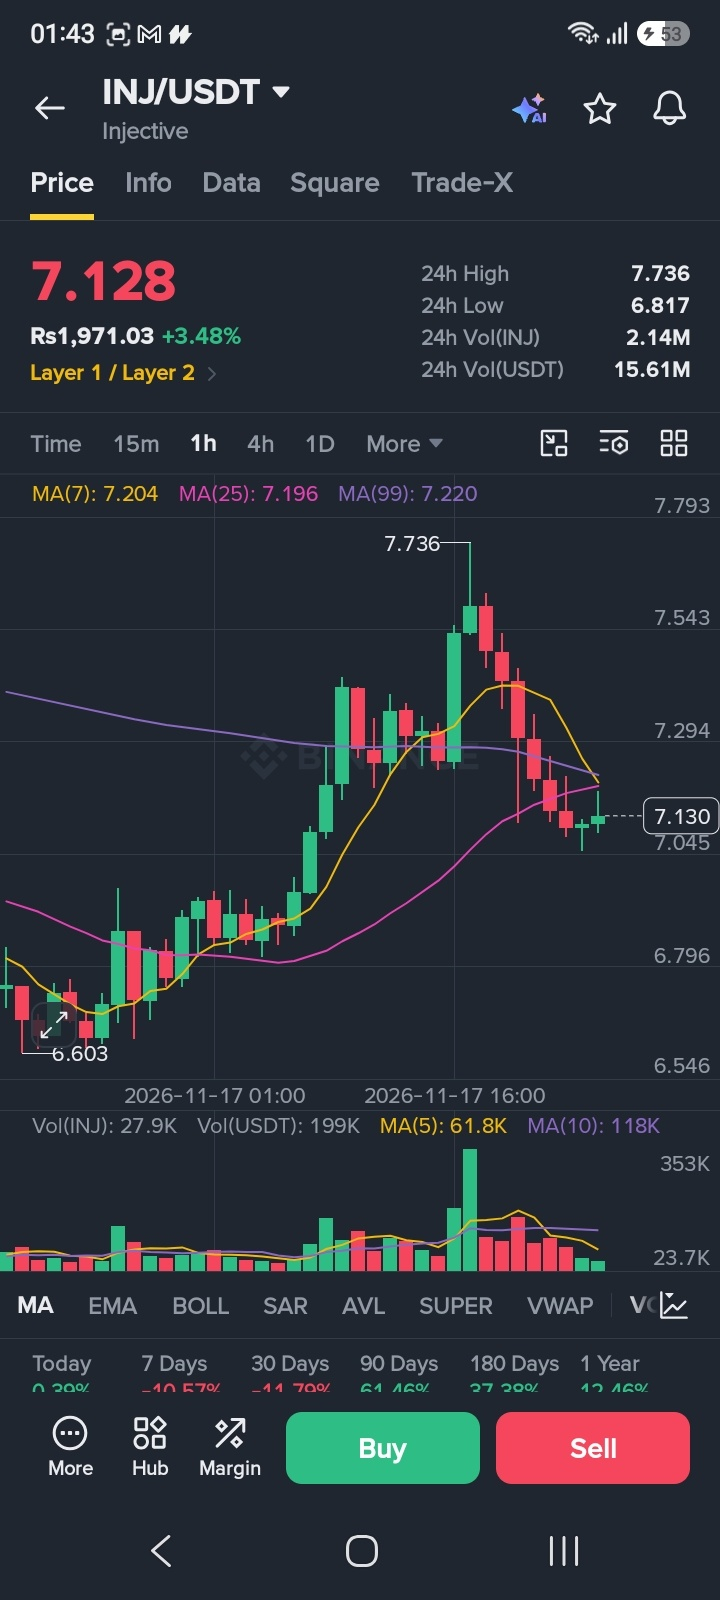
MA(7): $7.204
MA(25): $7.196
MA(99): $7.220
The price remains below all three moving averages, suggesting that buyers still need to prove their strength.
4-Hour Chart
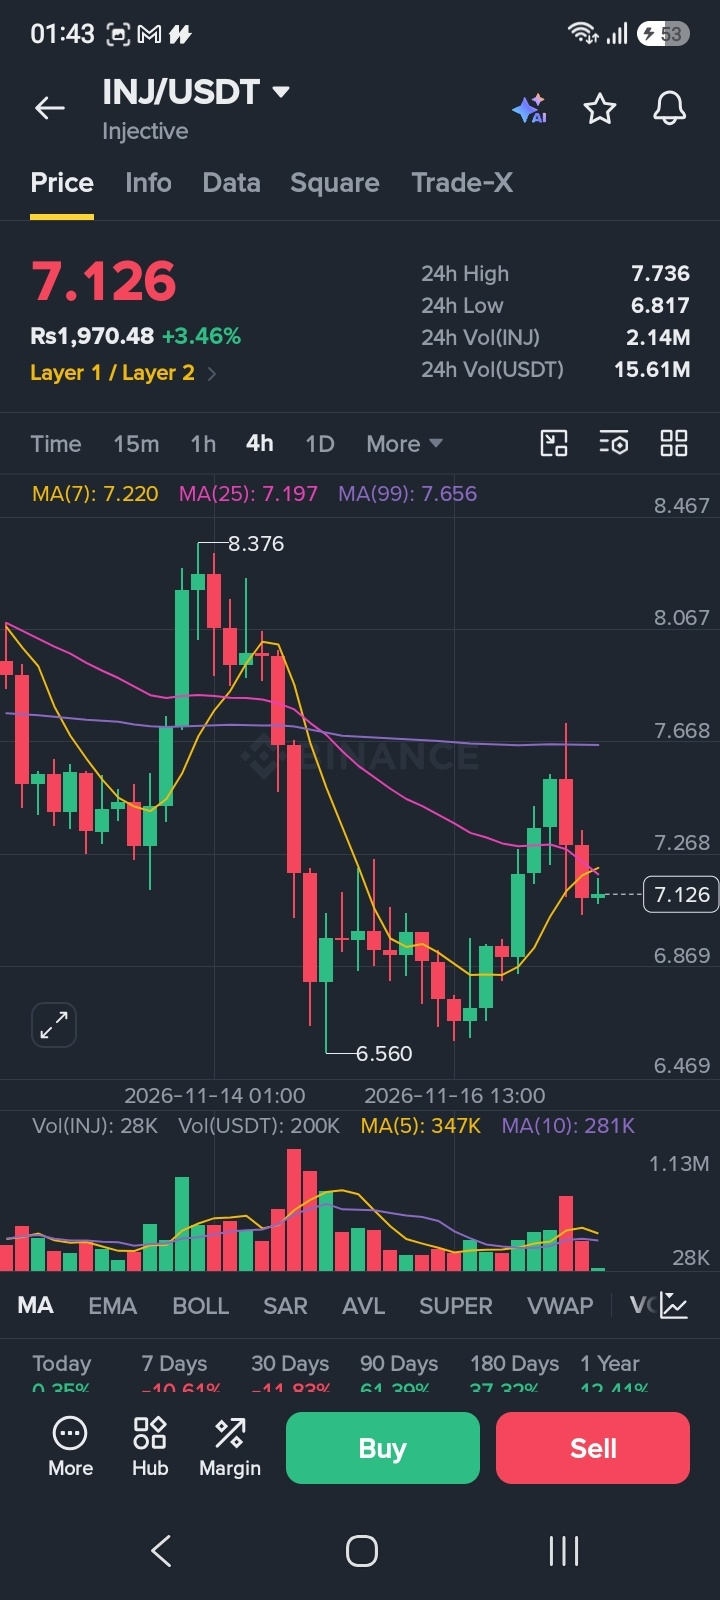
MA(7): $7.220
MA(25): $7.197
MA(99): $7.656
The broader short-term structure remains under pressure.
Daily Chart
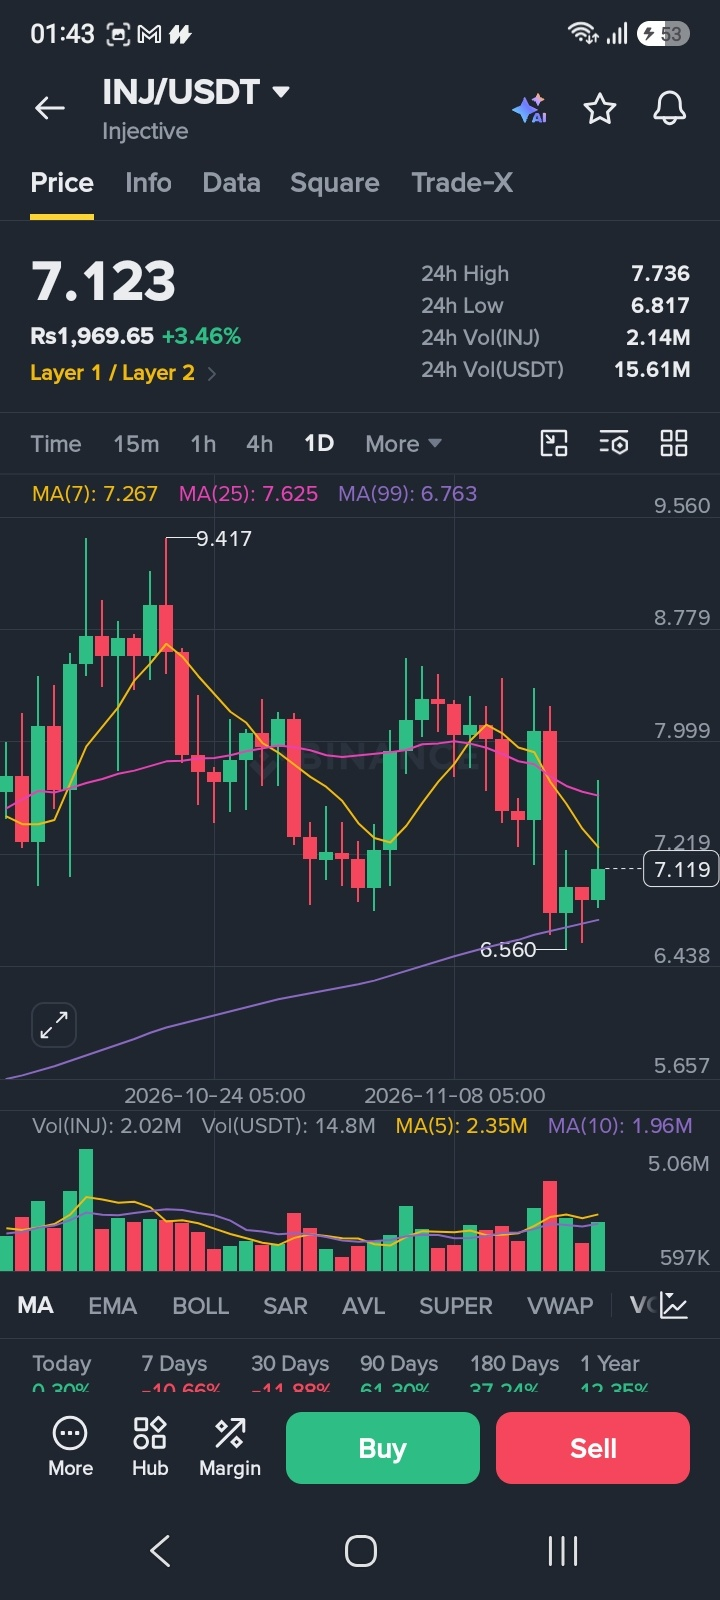
MA(7): $7.267
MA(25): $7.625
MA(99): $6.763
INJ is trading below its MA(7) and MA(25), but above its MA(99).
🎯 Key Levels to Watch
🔹 Resistance: $7.20–$7.27
🔹 Next resistance: $7.54
🔹 Major resistance: $7.73
🔹 Support: $7.00
🔹 Stronger support: $6.82
A convincing breakout above $7.27 with increasing volume could improve the bullish outlook.
However, losing the $7.00 area may expose INJ to another test of $6.82.
🔍 The Bigger Question
Is this the beginning of an Injective recovery, or just a temporary bounce before another move down?
For now, confirmation matters more than the daily percentage gain. Watch price action and trading volume before making assumptions.

What do you think? Can INJ reclaim $7.50, or will sellers take control again?
— far cam
Technical observations based on the provided Binance chart screenshots. This is not financial advice. Always do your own research (DYOR).
#INJ #Injective #CryptoAnalysis #BinanceSquare #Altcoins #TechnicalAnalysis #CryptoMarket