Solana (SOL) Gains 3.7% to $73.47 as Price Tests Key Resistance Near the 99-Period MA
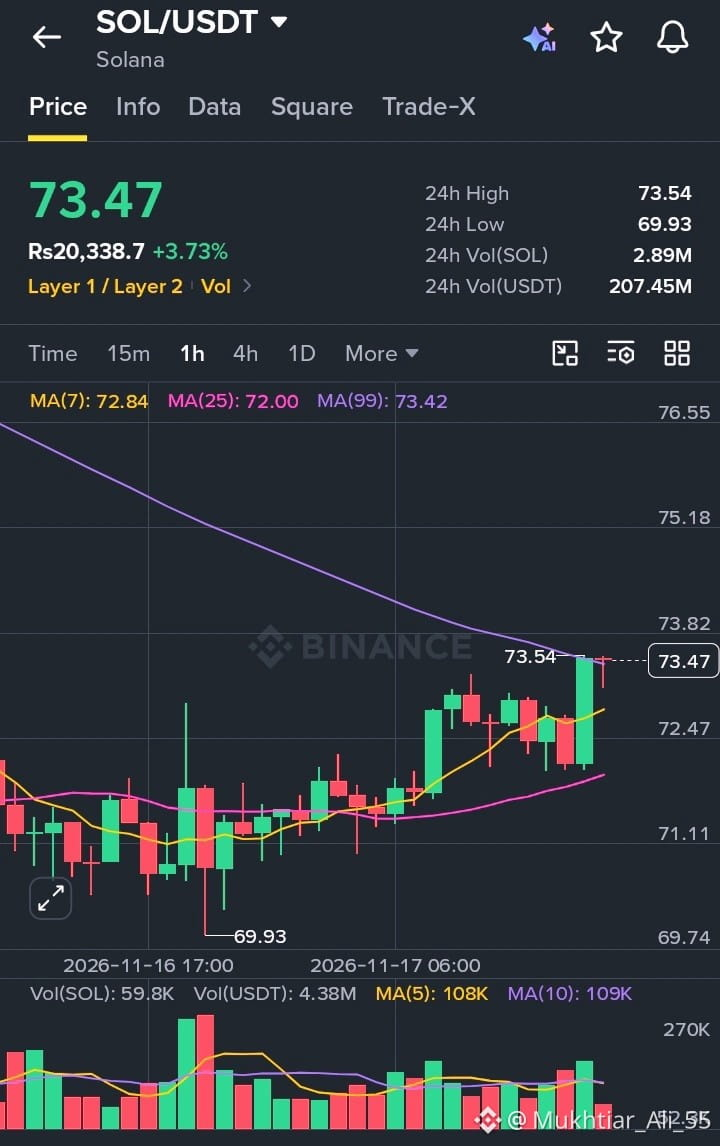
Solana is having a steady session. SOL/USDT is trading at 73.47 USDT (about Rs 20,338), up 3.73% on the day, after bouncing from a 24h low of 69.93 and touching a high of 73.54.
The 1-hour chart shows a gradual recovery. After the dip on November 16, price built a base around the 71-72 zone and then pushed higher through the morning of the 17th. The 7-period moving average (72.84) has crossed above the 25-period (72.00), a short-term bullish signal, and price is now trading above both.
The key level is right overhead. The 99-period moving average (73.42) has been sloping downward for most of this chart, and price is now sitting right on it, with the 24h high at 73.54 just above. This is the first real test of whether buyers can flip that longer-term average into support.
Volume is solid, with around 2.89M SOL traded, or roughly 207.45M USDT, in the last 24 hours. That said, the latest candles show slightly lower volume than the earlier spikes, so I’d like to see participation pick up on any breakout.
What I’m watching next:
Resistance: the 73.50-73.54 area, where the 99 MA and 24h high meet. A clean hourly close above it could open the way toward 75.
Support: the 72.80 zone near the MA(7), followed by the 72.00 level where the MA(25) sits.
The latest candle has a small upper wick, showing some selling pressure at resistance, so a brief pause or pullback would not be a surprise before the next move.
#Solana #SOL #CryptoTrading #TechnicalAnalysis #AltcoinUpdate
$SOL
Solana is having a steady session. SOL/USDT is trading at 73.47 USDT (about Rs 20,338), up 3.73% on the day, after bouncing from a 24h low of 69.93 and touching a high of 73.54.
The 1-hour chart shows a gradual recovery. After the dip on November 16, price built a base around the 71-72 zone and then pushed higher through the morning of the 17th. The 7-period moving average (72.84) has crossed above the 25-period (72.00), a short-term bullish signal, and price is now trading above both.
The key level is right overhead. The 99-period moving average (73.42) has been sloping downward for most of this chart, and price is now sitting right on it, with the 24h high at 73.54 just above. This is the first real test of whether buyers can flip that longer-term average into support.
Volume is solid, with around 2.89M SOL traded, or roughly 207.45M USDT, in the last 24 hours. That said, the latest candles show slightly lower volume than the earlier spikes, so I’d like to see participation pick up on any breakout.
What I’m watching next:
Resistance: the 73.50-73.54 area, where the 99 MA and 24h high meet. A clean hourly close above it could open the way toward 75.
Support: the 72.80 zone near the MA(7), followed by the 72.00 level where the MA(25) sits.
The latest candle has a small upper wick, showing some selling pressure at resistance, so a brief pause or pullback would not be a surprise before the next move.
#Solana #SOL #CryptoTrading #TechnicalAnalysis #AltcoinUpdate
$SOL