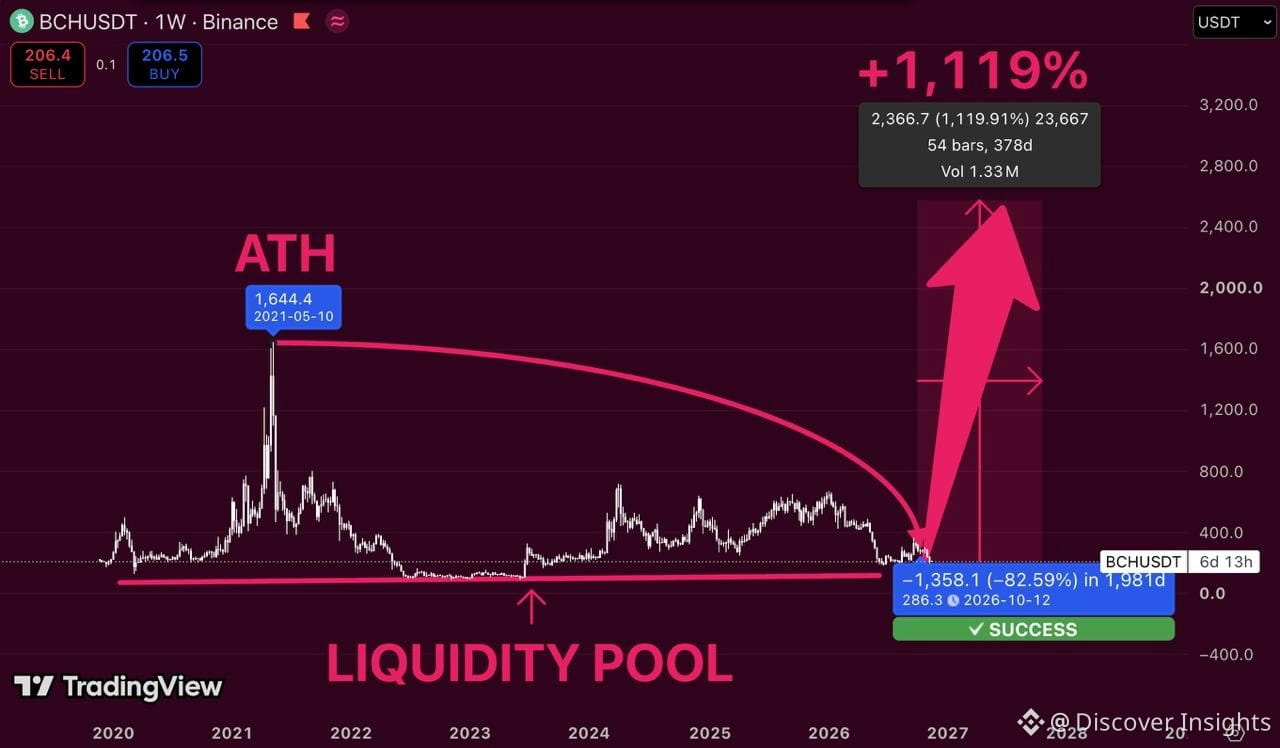
$BCH is trading around $206.
And this weekly chart is showing a potentially massive reversal setup.
Back in 2021, BCH reached $1,644 before experiencing a brutal correction.
After multiple rallies and failed recoveries, price has returned toward a major historical liquidity zone.
But here's what caught my attention.
The chart projects a potential 1,119% expansion from its marked historical reference point.
Here's my roadmap:
$300 — First resistance.
$400 — Recovery checkpoint.
$700 — Major resistance.
$1,000 — Psychological milestone.
$1,644 — Previous cycle high.
$2,600+ — Extreme bull scenario.
But first, buyers need to defend the current region and reclaim $300 with strong volume.
A sustained breakout above $400 would strengthen the bullish case.
The 1,119% projection is speculative, not a guaranteed outcome.
Still, if this historical liquidity zone holds, BCH could be approaching an important turning point.
Could the next major cycle finally push BCH beyond its 2021 peak?
#AnthropicIPOTestsInvestorAppetiteForAI
$BCH
And this weekly chart is showing a potentially massive reversal setup.
Back in 2021, BCH reached $1,644 before experiencing a brutal correction.
After multiple rallies and failed recoveries, price has returned toward a major historical liquidity zone.
But here's what caught my attention.
The chart projects a potential 1,119% expansion from its marked historical reference point.
Here's my roadmap:
$300 — First resistance.
$400 — Recovery checkpoint.
$700 — Major resistance.
$1,000 — Psychological milestone.
$1,644 — Previous cycle high.
$2,600+ — Extreme bull scenario.
But first, buyers need to defend the current region and reclaim $300 with strong volume.
A sustained breakout above $400 would strengthen the bullish case.
The 1,119% projection is speculative, not a guaranteed outcome.
Still, if this historical liquidity zone holds, BCH could be approaching an important turning point.
Could the next major cycle finally push BCH beyond its 2021 peak?
#AnthropicIPOTestsInvestorAppetiteForAI
$BCH