
1. Coin Market Overview
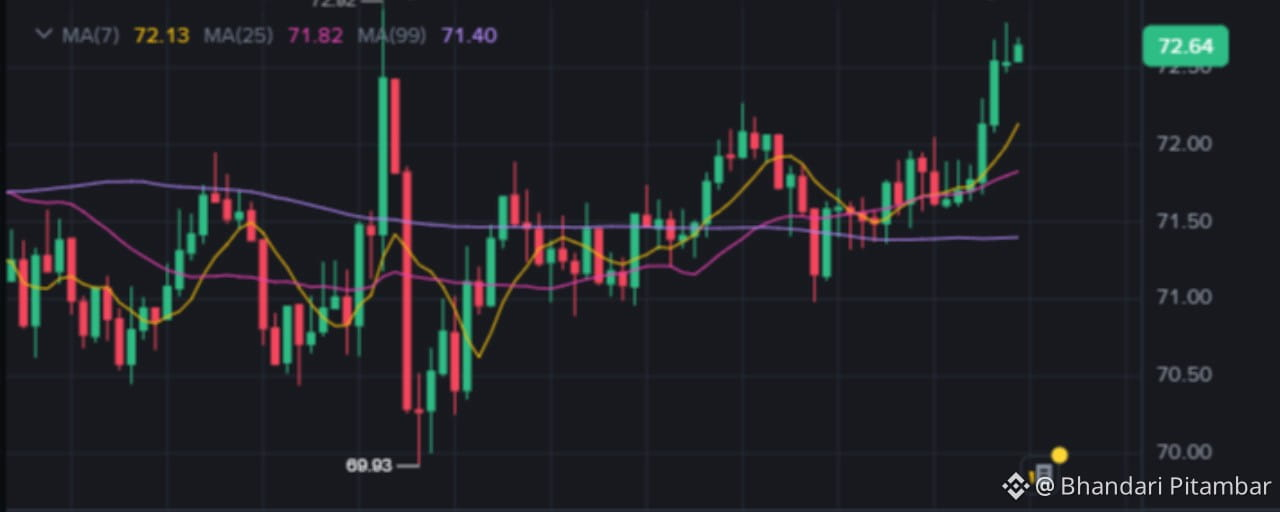
Current Price: $72.64
24-Hour Performance: +0.15% (Chart data)
Market Capitalization: ~$35.2 Billion (Estimated based on late 2026 circulating supply)
24-Hour Trading Volume: ~$1.8 Billion
Market Sentiment: Cautiously recovering. The Fear & Greed Index sits at 52 (Neutral), reflecting a market that is tired of the recent chop but hesitant to commit to a full breakout.
BTC Dominance: 54.2%. Bitcoin is consolidating, allowing high-beta alts like Solana to test local liquidity pools.
2. Latest Verified Market News
Firedancer Client Maturation: The fully independent Firedancer validator client has reached 95% mainnet adoption as of Q3 2026, drastically reducing the historical network outage risks that plagued Solana in previous cycles.
Institutional Flow: Spot Solana ETF inflows have stabilized in November 2026, providing a steady baseline of institutional buying pressure that wasn't present in prior bear markets.
Ecosystem Activity: Daily active addresses on Solana remain in the top 3 across all L1s, driven largely by decentralized physical infrastructure networks (DePIN) and persistent high-frequency retail trading.
3. Complete Technical Analysis
Let’s stress-test this chart immediately. The obvious narrative is "V-shaped recovery, buy the breakout." The weakest point of this setup is the volume profile.
Volume & OBV: Look at the volume panel. The red volume spike at the $69.93 low is massive. The current green volume pushing price to $72.64 is significantly lower. This is a volume divergence. Price is rising on declining relative volume, which often indicates a lack of aggressive institutional sponsorship at these levels.
Moving Averages: Price ($72.64) has reclaimed the MA(7) at $72.13, MA(25) at $71.82, and MA(99) at $71.40. The short-term alignment is bullish, but the MA(99) is still relatively flat, meaning the medium-term trend hasn't fully accelerated.
RSI (14): Hovering around 58 on the 1-hour chart. It has room to run before hitting overbought (70), but it's not showing extreme momentum.
MACD: A bullish crossover has occurred below the zero line, and the histogram is ticking up. This supports short-term upside, but until it crosses above the zero line, it's just a recovery within a broader range.
Support & Resistance: Immediate resistance is the local swing high around $73.50. Major support is the MA(99) cluster at $71.40, followed by the absolute recent low at $69.93.
Price Action: The wick down to $69.93 was a liquidity grab. The subsequent recovery is good, but the candles are overlapping, showing indecision rather than pure impulsive buying.
4. Fundamental Analysis
Utility & Ecosystem: Solana’s core value proposition remains unmatched for high-throughput applications. The shift toward DePIN (Helium, Hivemapper) and decentralized compute gives it a utility narrative that extends beyond just memecoin speculation.
Tokenomics & Risks: The inflation schedule continues to decay as programmed. The primary fundamental risk in late 2026 isn't outages anymore; it's competition from Ethereum L2s (Base, Arbitrum) and newer parallel-execution chains (Sui, Aptos) eating into its market share for consumer apps. If Solana's developer retention drops, the premium valuation compresses.
5. Three Future Scenarios
Bullish Scenario: Price pushes through $73.50 with a volume spike that matches or exceeds the volume seen at the $69.93 dump. This confirms buyer conviction. Target: $76.00 - $78.50. Condition to invalidate: Failure to hold $72.00 on the first retest.
Bearish Scenario: The low-volume recovery fails at $73.00. Sellers step in, recognizing the volume divergence. Price chops back down to test the MA(99) at $71.40, and if that breaks, a retest of $69.93 is highly probable. Condition to invalidate: A sudden high-volume green candle closing above $73.50.
Sideways Scenario: The most likely immediate outcome. Price grinds between $71.50 and $73.00 as the market digests the recent volatility and waits for a macro catalyst (like CPI data or BTC direction).
6. Support, Resistance and Trading Levels
Major Resistance: $73.50 (Local swing high), $76.00 (Previous consolidation zone).
Major Support: $71.40 (MA99 & structural support), $69.93 (Recent swing low / liquidity pool).
Entry Zone: $71.80 - $72.10 (Retest of the MA7/MA25 confluence). Do not chase the current green candles.
Stop-Loss: $69.40 (Just below the recent swing low to avoid stop hunts).
Take-Profit Targets: TP1: $73.40, TP2: $75.80.
Risk-to-Reward Ratio: Roughly 1:2.2 on a retest entry.
FINAL
Everyone looking at the Solana chart right now is focusing on the green candles. We dropped to $69.93, grabbed liquidity, and pushed back up to $72.64, reclaiming the 7, 25, and 99 moving averages. The surface-level narrative is simple: the dip was bought, the trend is reversing, and we are heading to $75.
But if you only look at the price and ignore the volume, you are trading blind.
Let’s stress-test this recovery. Look at the volume bars at the bottom of the chart. The red volume spike that accompanied the drop to $69.93 is massive. It represents genuine panic, capitulation, and heavy distribution. Now look at the green volume pushing us back to $72.64. It’s noticeably weaker.
This is a classic volume divergence. Price is rising, but the aggressive buying pressure required to sustain a breakout isn't there yet. When a recovery happens on declining volume, it usually means we are seeing short-covering and retail FOMO, not institutional accumulation. Smart money doesn't load up on low-volume bounces; they wait for confirmation.
Technically, the structure is fine. Reclaiming the $71.40 MA(99) is a necessary first step. The MACD has crossed over, and the RSI has room to breathe before hitting overbought territory. But the moving averages are just now starting to fan out, and the medium-term trend (represented by that flat purple MA99 line) hasn't fully committed to an upward trajectory.
Fundamentally, Solana is in a strong position in late 2026. The Firedancer client has largely solved the historical outage issues, and institutional ETF flows provide a baseline of demand that didn't exist in previous cycles. The ecosystem is still generating massive daily active users, largely driven by DePIN and high-frequency retail trading. However, the valuation is pricing in perfection. If Ethereum L2s or newer parallel chains start eating into Solana's consumer app market share, this current price level becomes vulnerable.
So, what is the play?
If you are already long, hold your position but tighten your stops. The immediate resistance sits at $73.50. If we approach that level and the volume doesn't expand to match the selling pressure we saw at the bottom, expect a rejection.
If you are looking to enter, do not chase this current candle. Wait for a retest of the $71.80 to $72.10 zone, where the MA(7) and MA(25) converge. That is your high-probability entry. If you get in there, your invalidation point is a daily close below $69.93.
The bulls need to prove they have the firepower to push through $73.50 with heavy volume. Until then, this is just a low-volume bounce in a choppy market. Trade the reality of the chart, not the hope of the breakout.
#Solana #CryptoTrading #TechnicalAnalysis #BinanceSquare #CryptoMarket